A Daily History of Holes, Dots, Lines, Science, History, Math, Physics, Art, the Unintentional Absurd, Architecture, Maps, Data Visualization, Blank and Missing Things, and so on. |1.6 million words, 7500 images, 4.9 million hits| Press & appearances in The Times, Le Figaro, Mensa, The Economist, The Guardian, Discovery News, Slate, Le Monde, Sci American Blogs, Le Pont, and many other places… 5000+ total posts since 2008.

  • Visionary Architecture and City Planning of an Industrial/Scientific Community (1842)

    JF Ptak Science Books  Post 2477

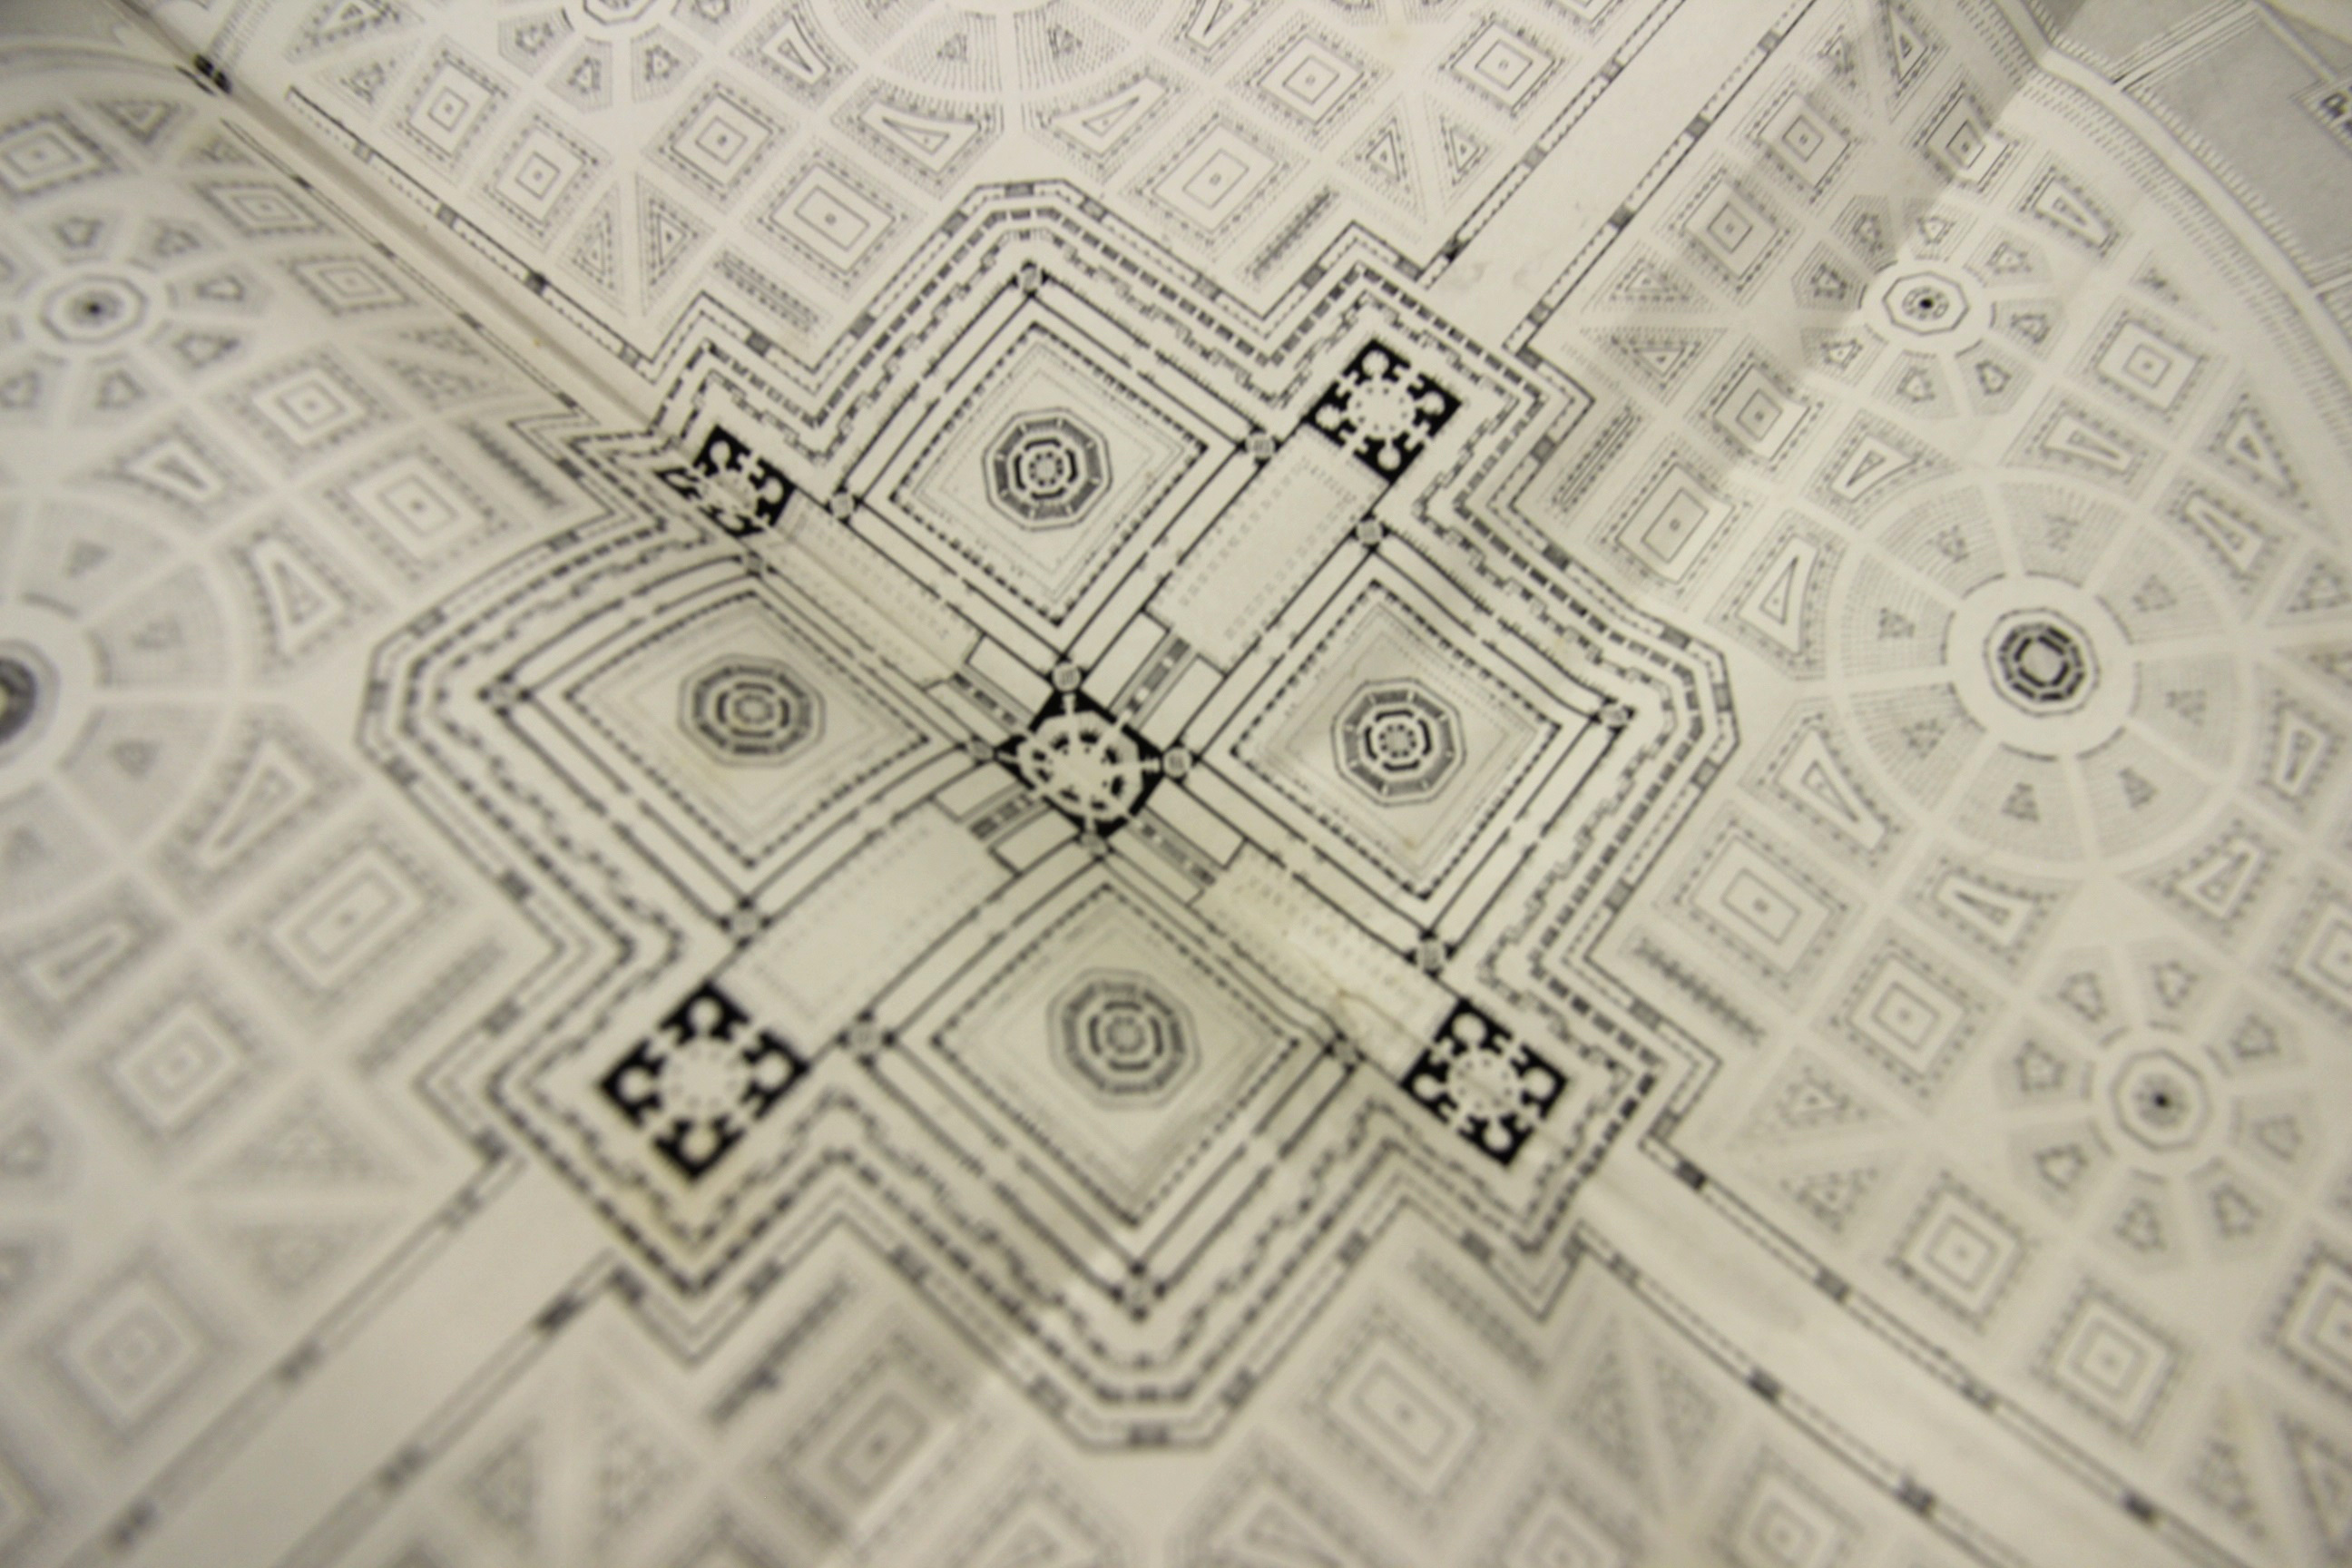
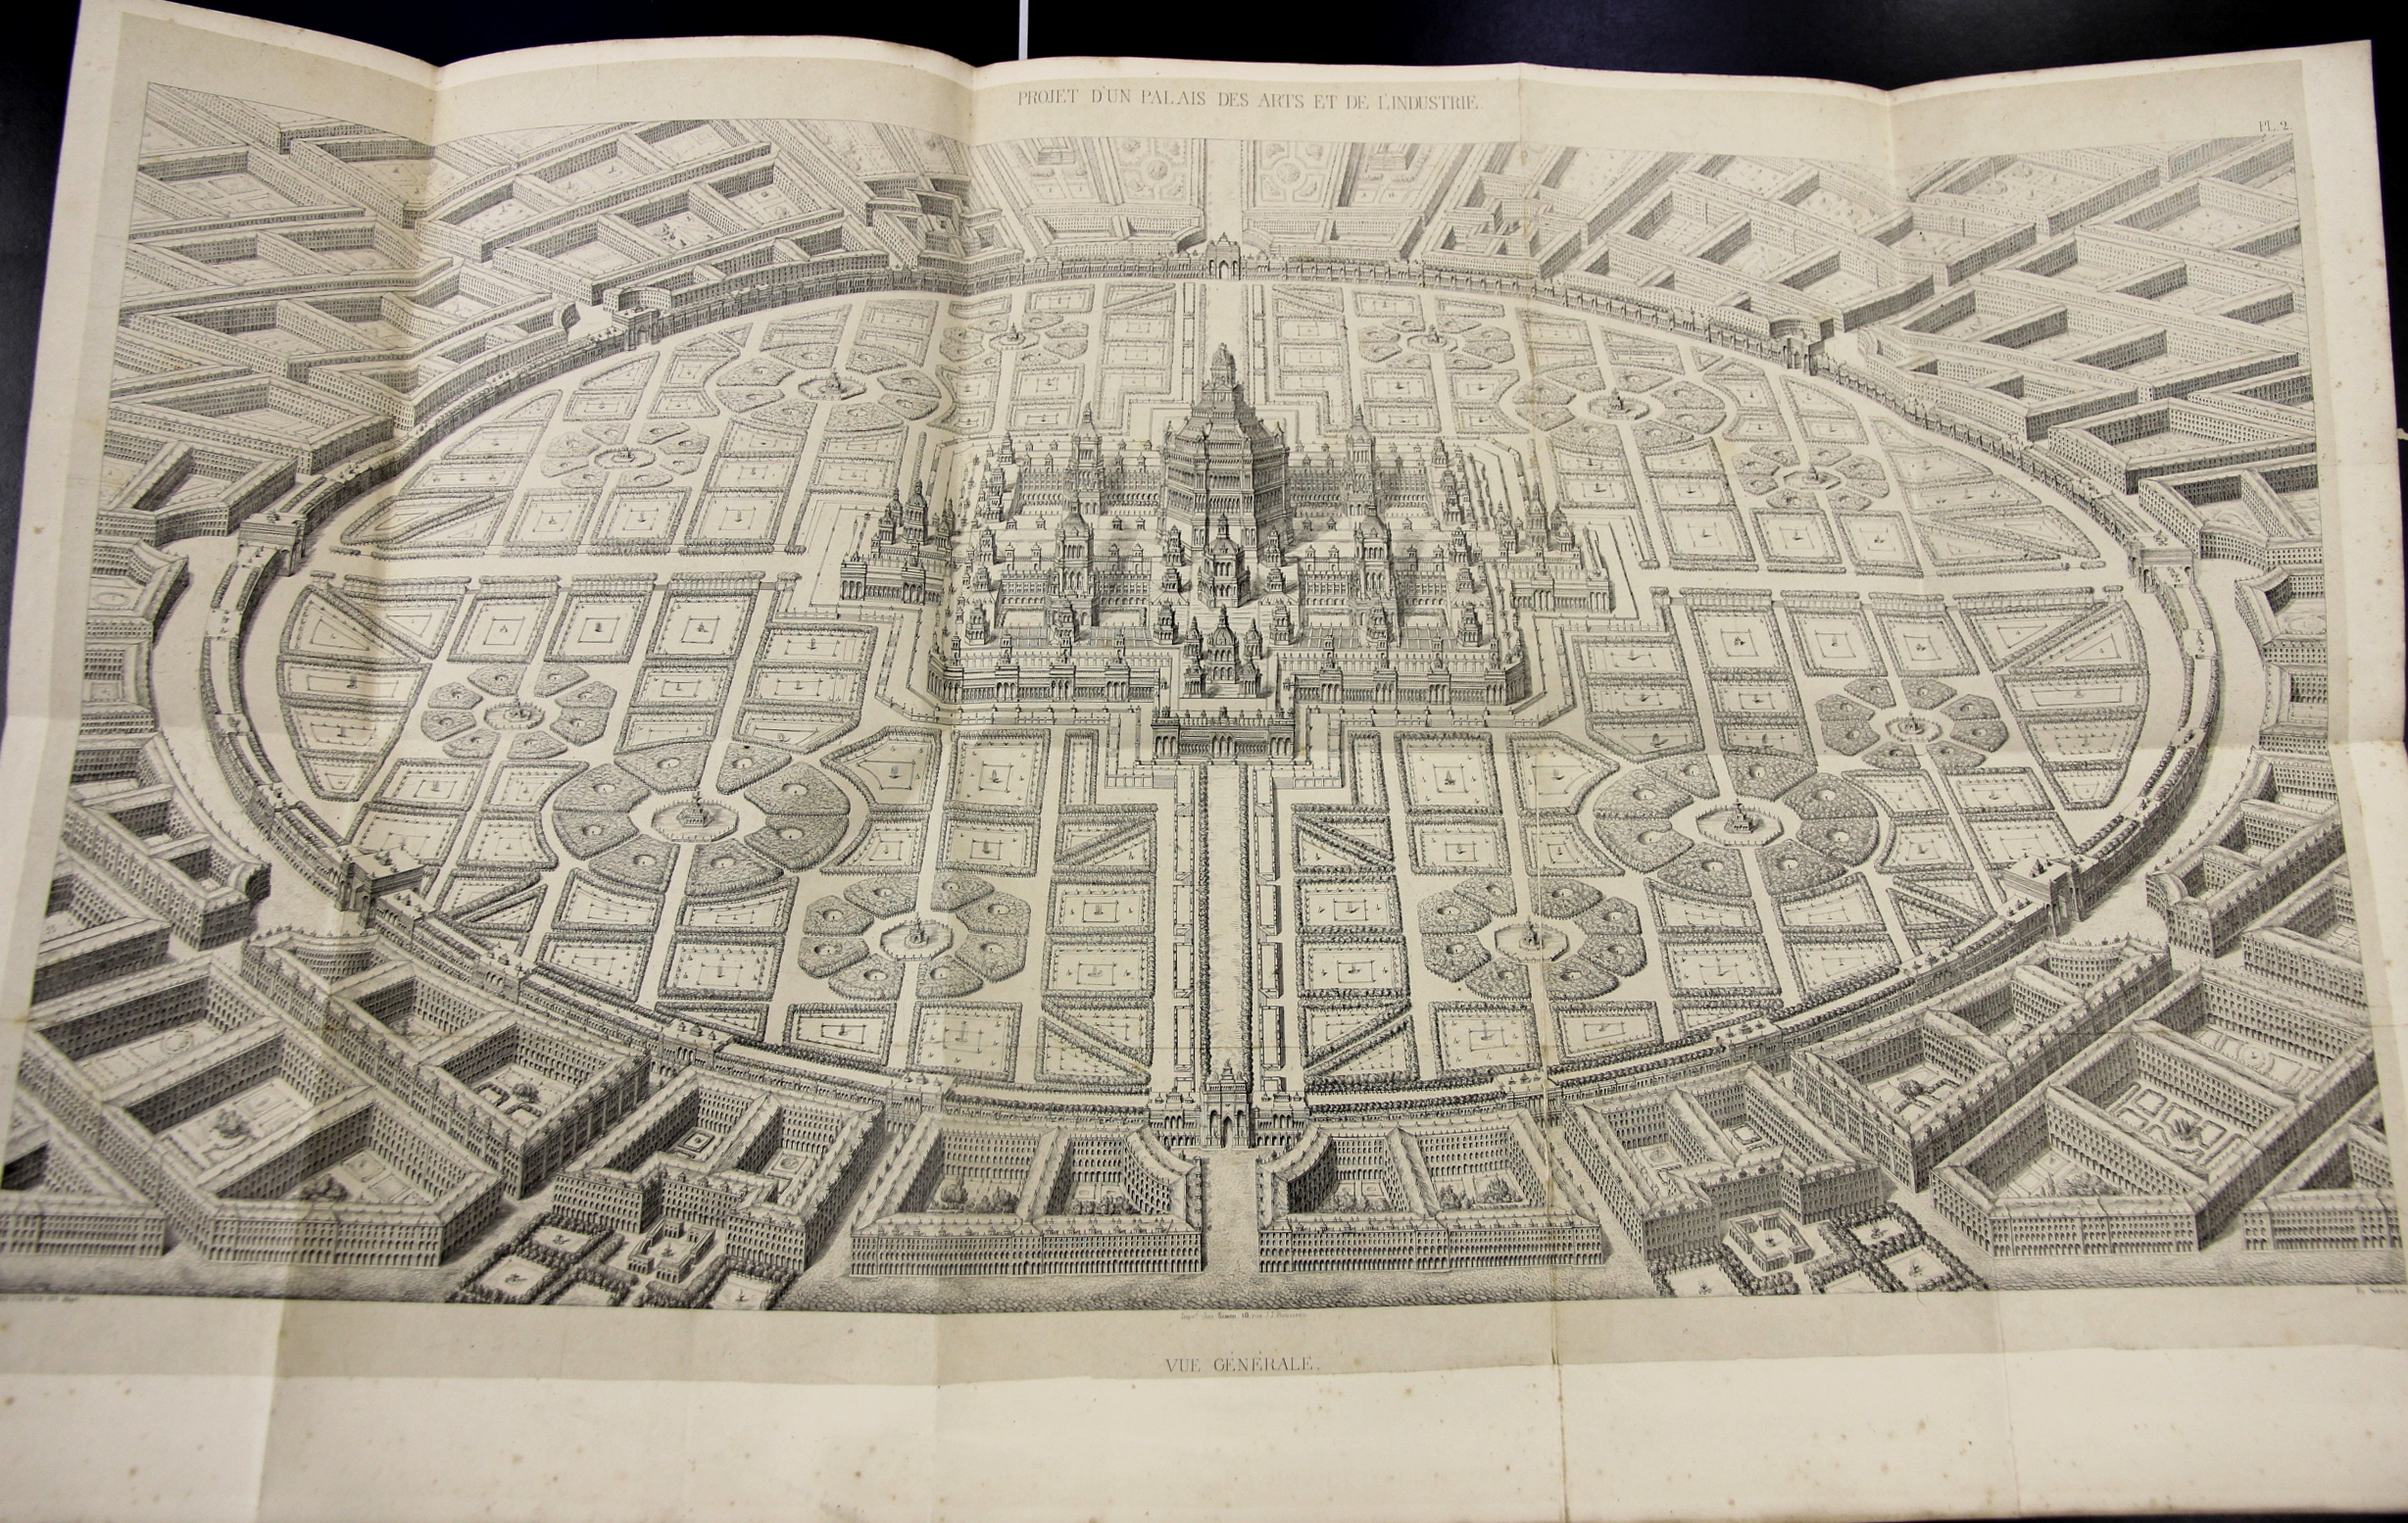
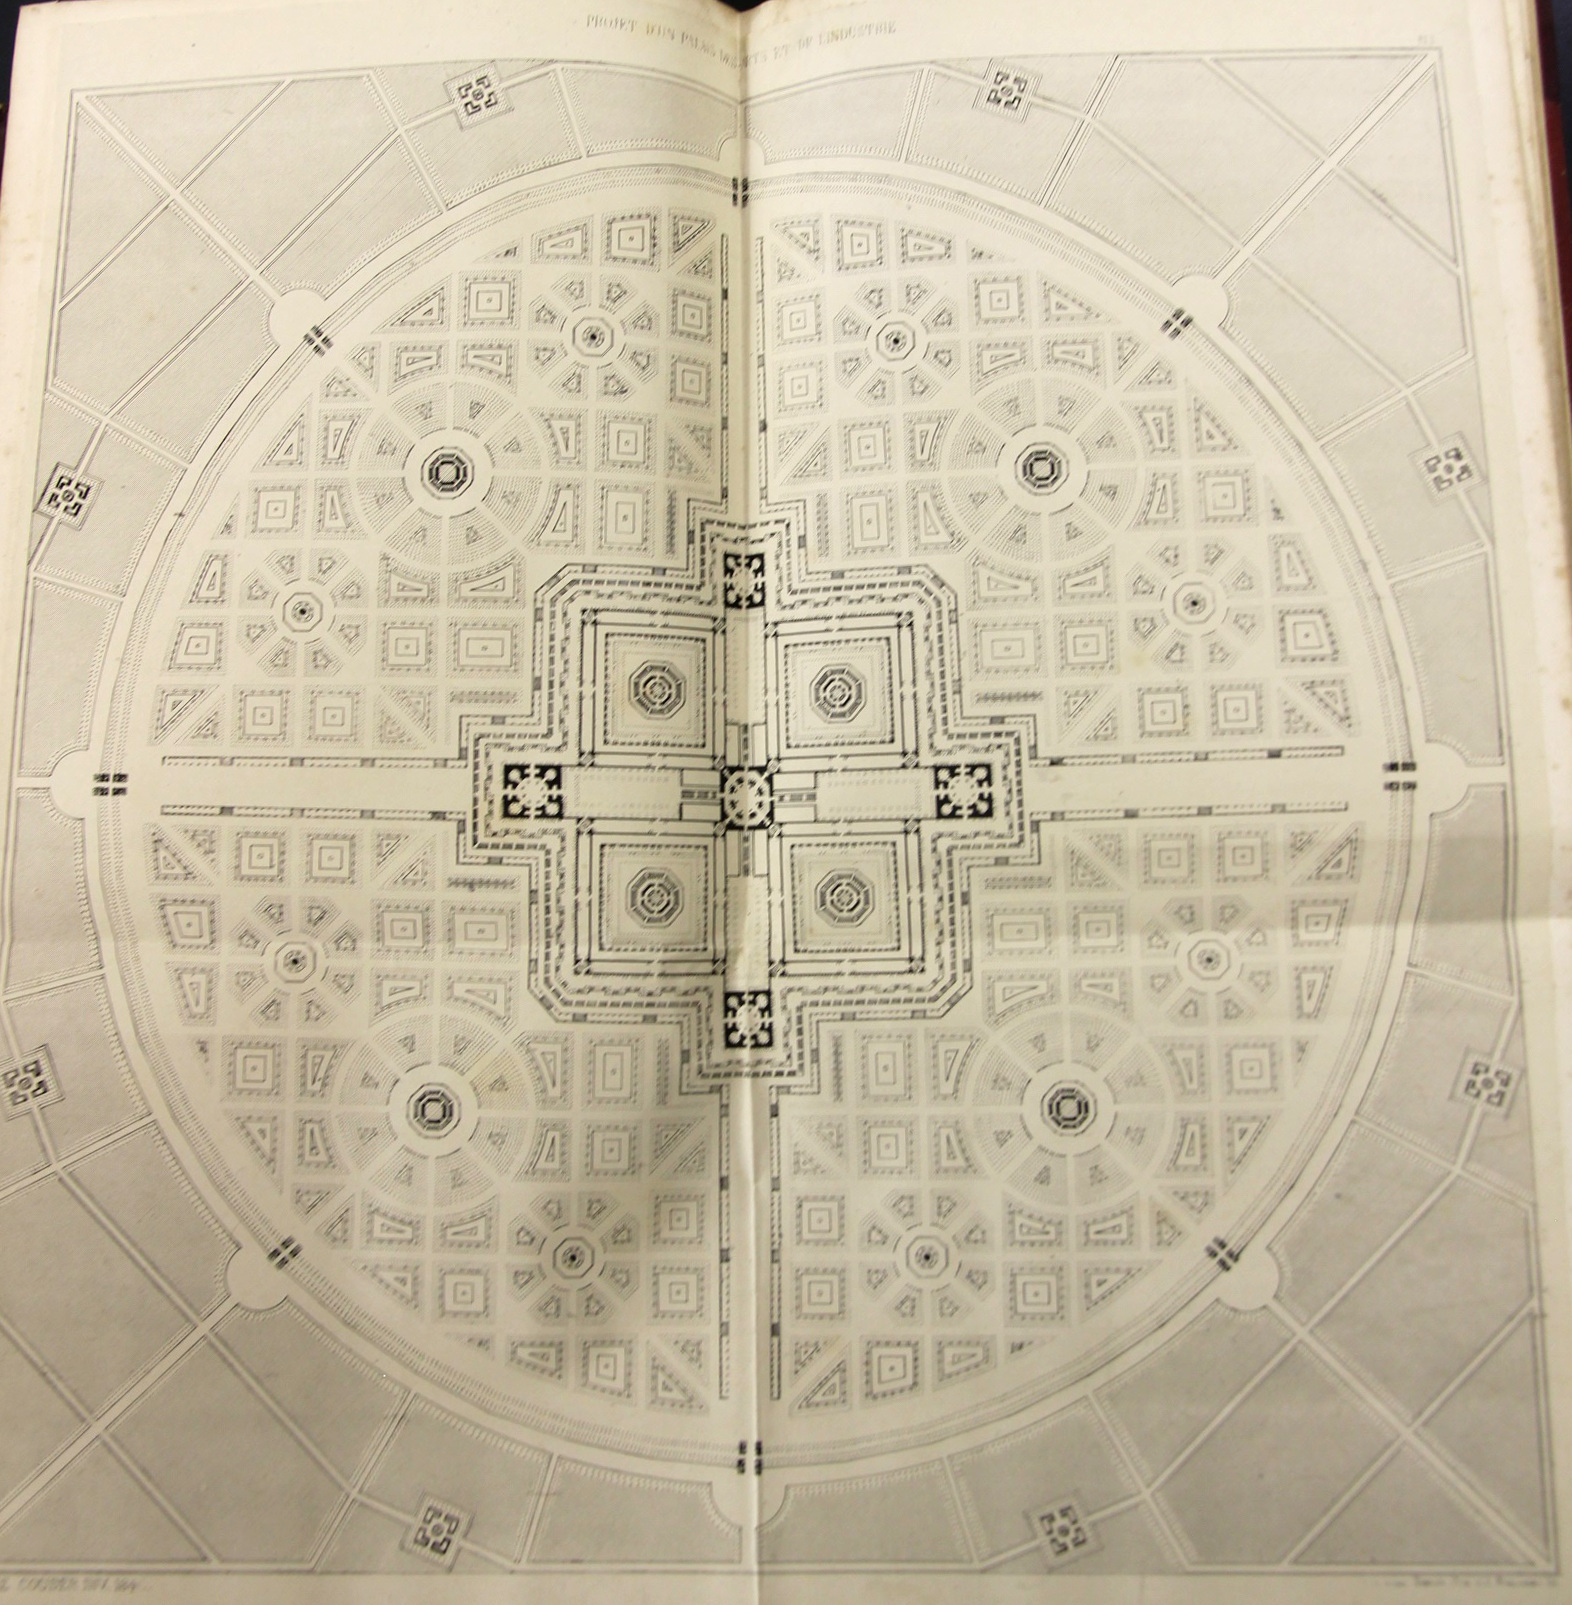
    (Jean Baptiste) Amedee Couder wrote L’Architecture et l’industrie comme moyen de perfection sociale, a fine work that was published in Paris (by Brockhaus et Avenarius) in 1842.  The work presents Couder’s rather stroing visionary plans for a perfect city of industrial and scientific harmony, laid out in suggestively-fractal harmony, with the suggestions of a Renaissance-laden snowflake design. Whatever it was, it was beautiful to look at, at least on paper, though I’m not so certain that I’d care to live in the canyonlands of stone and shadow on the other side of the garden wall of the perfect scientific-industrial conclave. 

    (Its actually a fairly scarce book, with only two copies found in the WorldCat directory, so I’ve reproduced the book’s larger folding plates)

    Couder 1

    Couder 2 detail

    • The original volume may be purchased via the blog’s bookstore, here.

    Couder 5

    Projet d’un palais des Arts et de l’industrie.  18×14 inches.

  • Massively Detailed “Hyper” Geometric Mosaics, San Marco, 1886

    JF Ptak Science Books   Post 2477

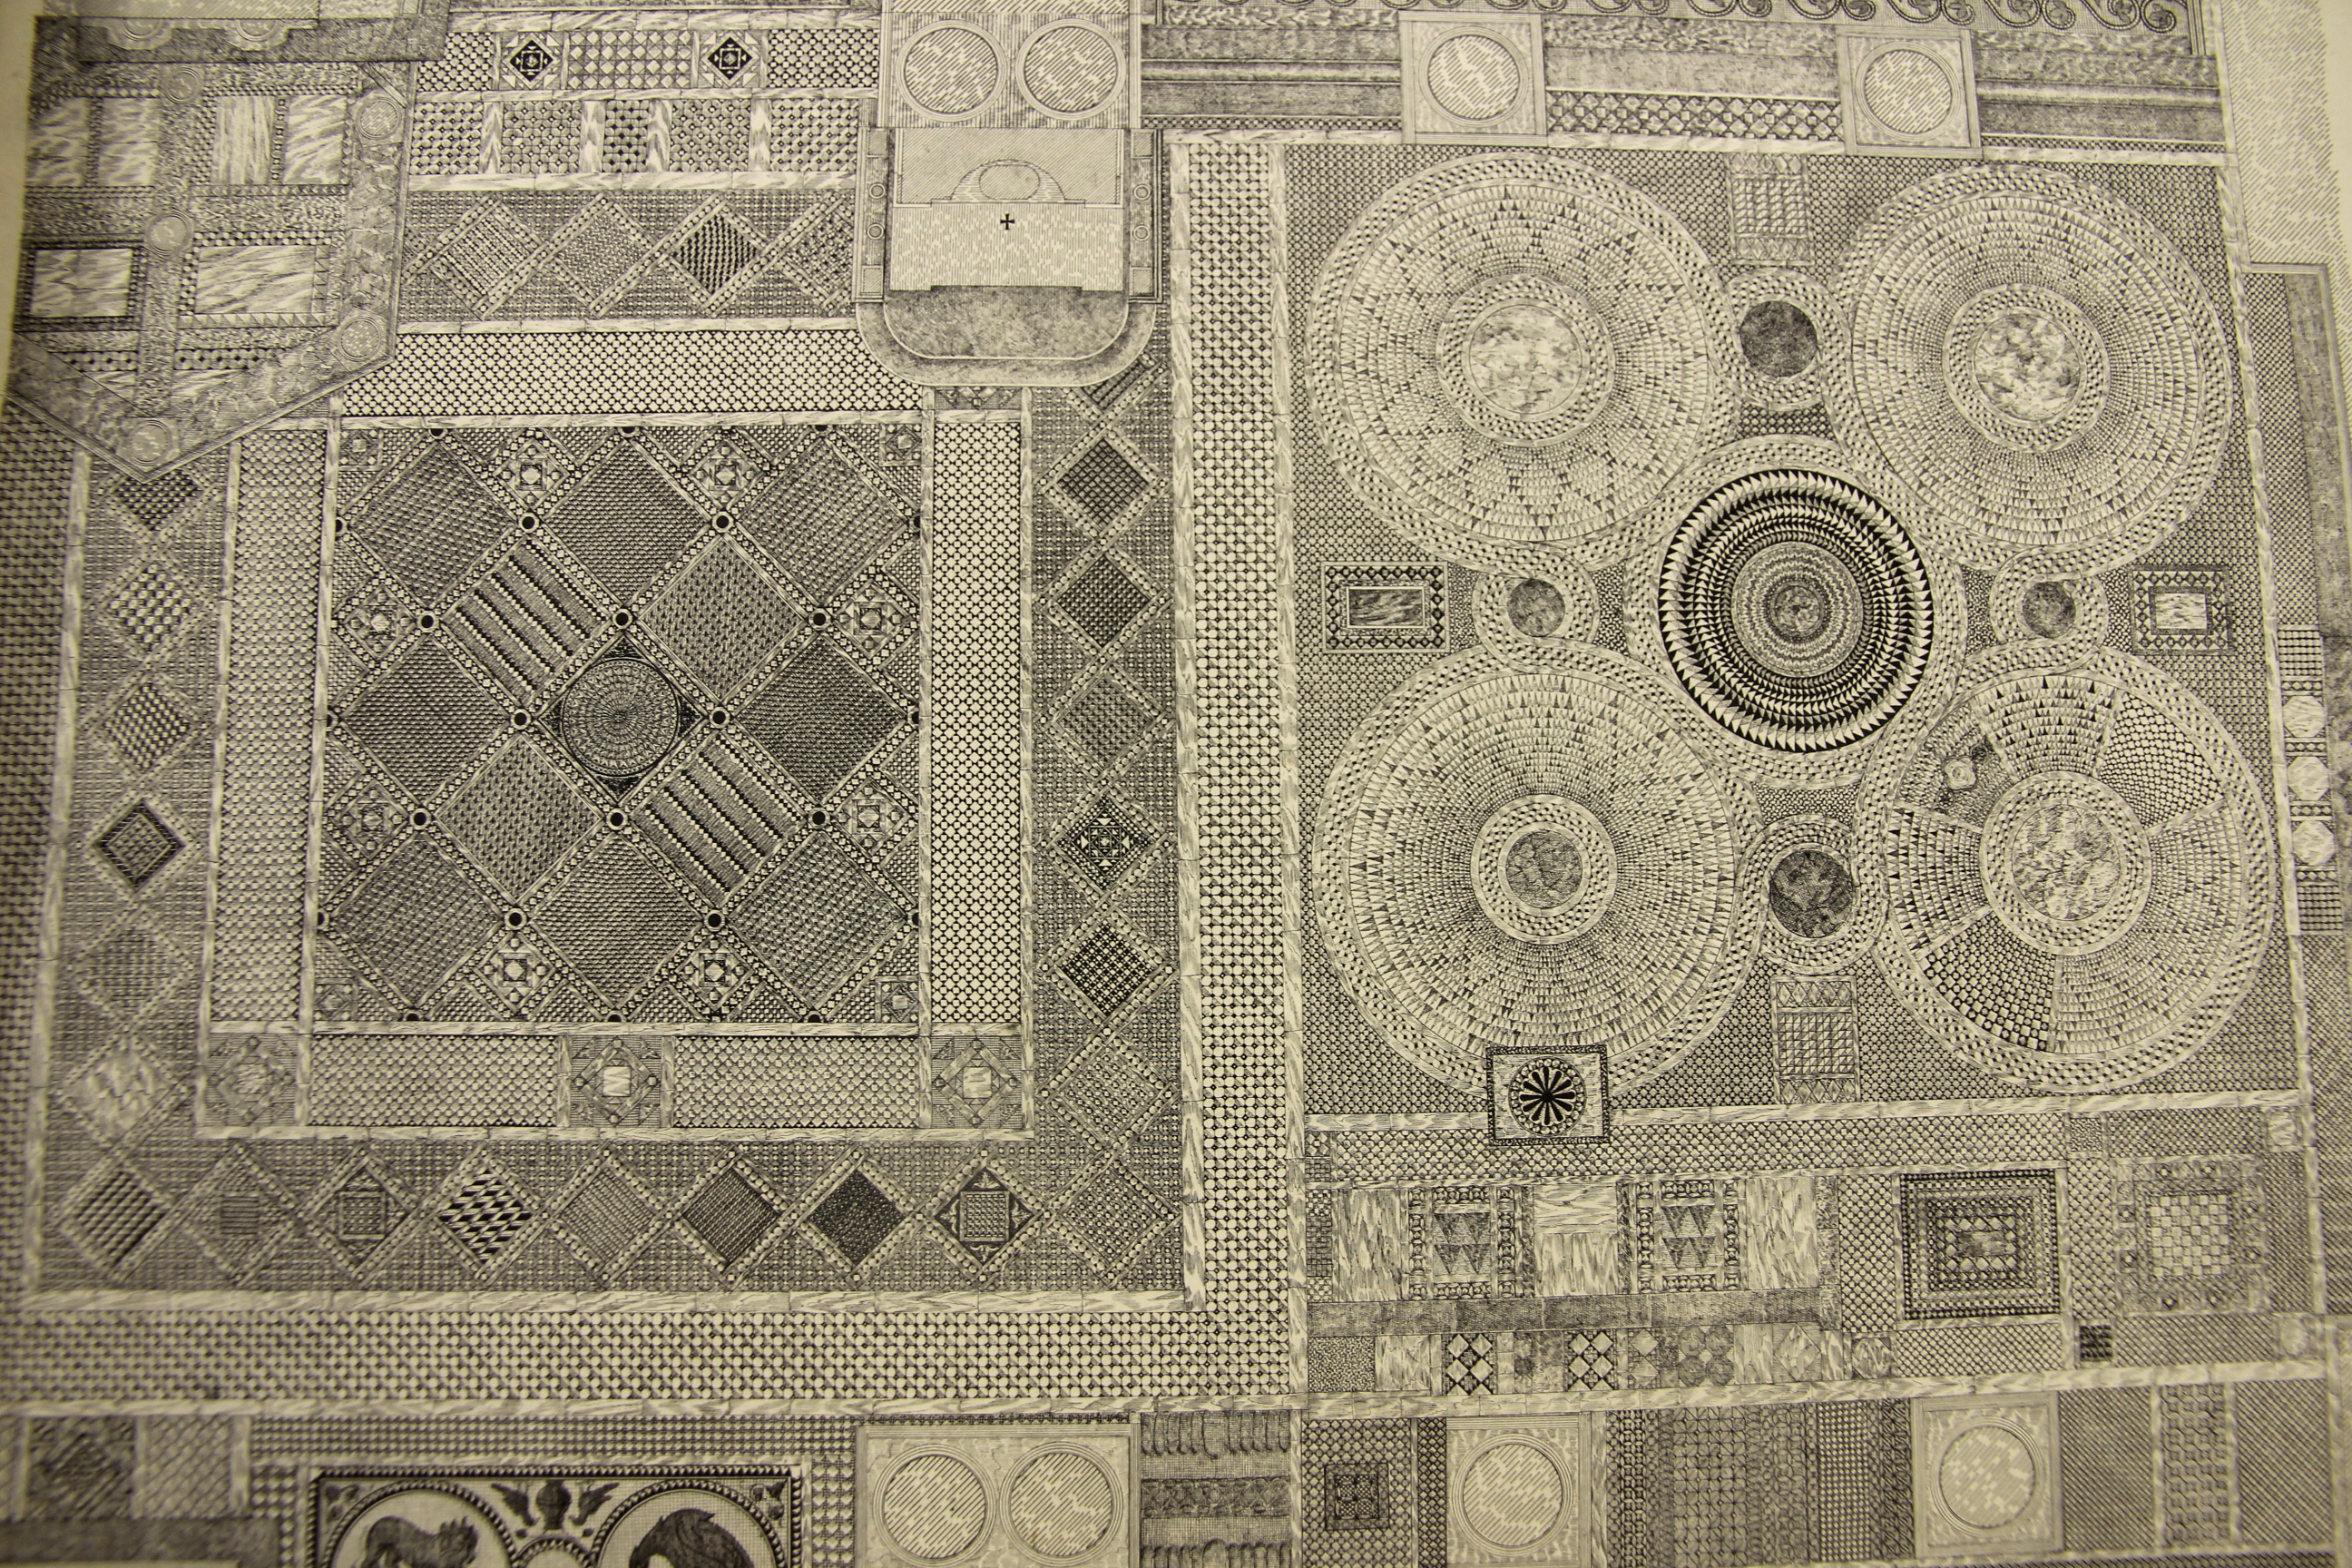
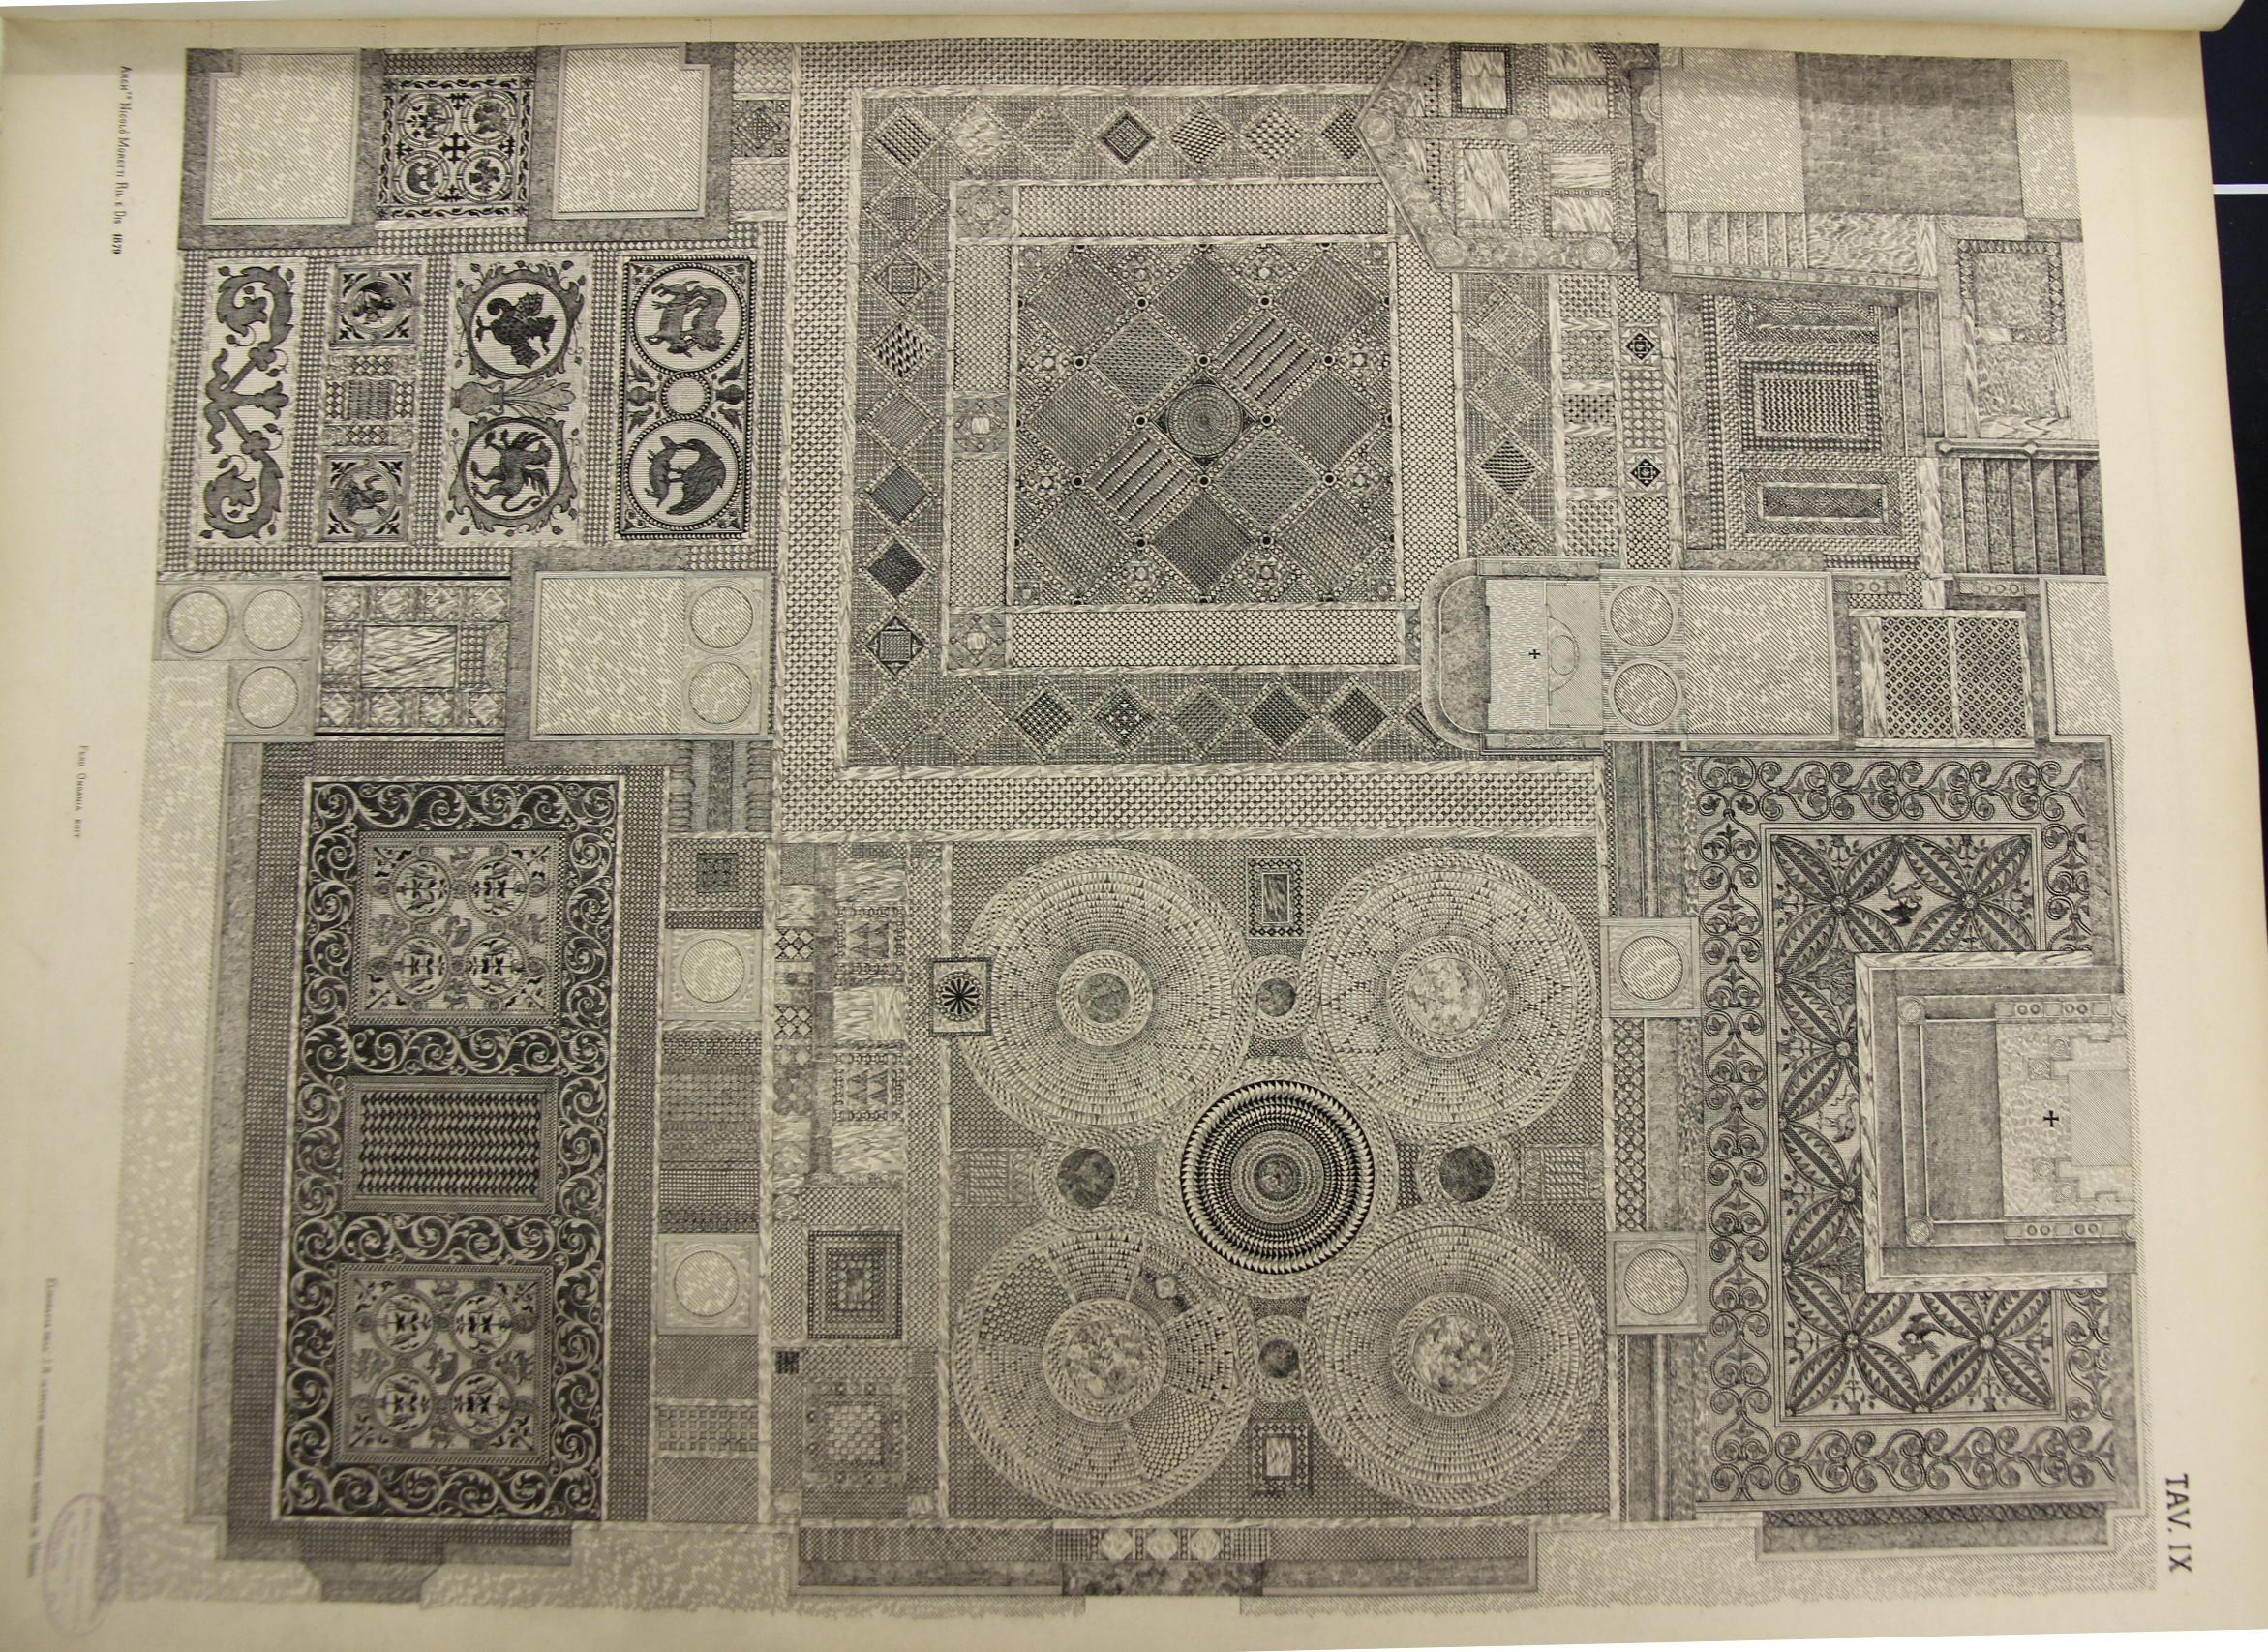
    The following four engravings appeared in the massive La Basilica di San Marino du Venezia, published by the prolific Ferdinand Ongania in 1886.  It is an exhaustive study of the iconic building, the publication being known chiefly I think for its very large and sumptuous chromolithographs of the building’s architecture, art, and endless detail. It forms two volumes of an overall monumental 12-volume epic, though these were complete in themselves.

    But then there are these engraving, in wonderful black-and-white, showing with fantastic detail and with a deft touch the mosaics of the basilica.  I believe that there were six overall but I sold two some time ago and hadn’t made a digital record of them.  Since I have these and another 22 images from that great work, and since I can’t seem to find them online, I thought to make at least rudimentary photographs of them and share.  (Making the pictures was a little problematic, as they are pretty large at 27×21″, so some of the lines are a little parabolic, though I think they’re good enough given limited time to spend on them–also each image is at least 2 meg, so they can stand some amount of enlarging.)

    • I’ll be selling all of them, with the mosaics being the first installment–so if you’d perhaps be interested in buying them, they can be found at the blog’s bookstore, here. 

    The engravings (again, they are large at 27×21″, 68x53cm, and are packed with detail).

    Each image is very expandable–click in to see the enormous detail:

    Ongania Mosaic 1


    Ongania Mosaic 2

    ·Posted by :

    ·in:

  • Sumptuous and Large Depiction of the Old Testament “Creation”, 1886

    JF Ptak Science Books   Post 2478

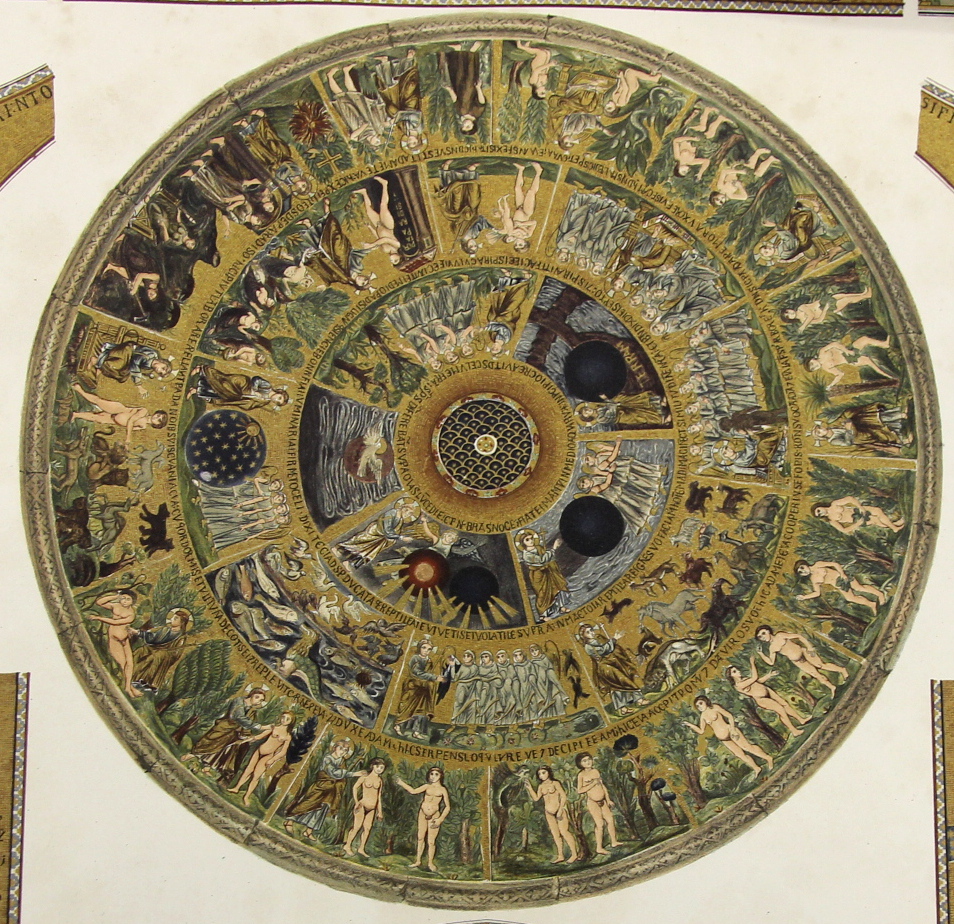
    I’m in the midst of making several posts relating to a group of large (27×21″) chromolithographs of the mosaics in San Marco (sumptuously published by Ferdinand Ongania in Venice in 1886.  The main part of this image is the story of creation, starting in the innermost circle of images, where we find the creation of light (and darkness),  and the rest, followed by the larger concentric circle showing the starry realms, the creation of the birds and fishes, then the land-based animals, and then (around “12 o’clock” on the second circle) comes the creation of life in Adam, where it all seems to go downhill.  In the outer ring we see the creation and presentation of Eve, the various temptations, the nakedness realizations and then the banishment–not all together a happy ending.  But the artwork is lovely, highlighted in gold. 

    Ongania 16 creation detail

    • The original image is available for sale via he blog’s bookstore, here.

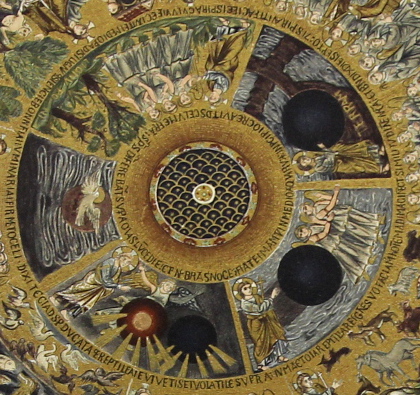
    Detail of the inner circle of images:

    Ongania 16 creation detail 2_

    ·Posted by :

    ·in:

  • A Great Map of the “Other” London Underground: the Sewer System, 1990

    JF Ptak Science Books   Quick Post

    In order ot have an Industrial Revolution, you need people, and the people (given the times) needed to live close to where they would work. Large number of people all living in close proximity to work means that they need to live close together; close together means that there needs to be essential services, like water. And of course with water you need a place for it all to “go”–and perhaps the “goingest” of water in the city would be for waste. So, if you can’t get rid of waste, then you have no Industrial Revolution. Or something along those lines.

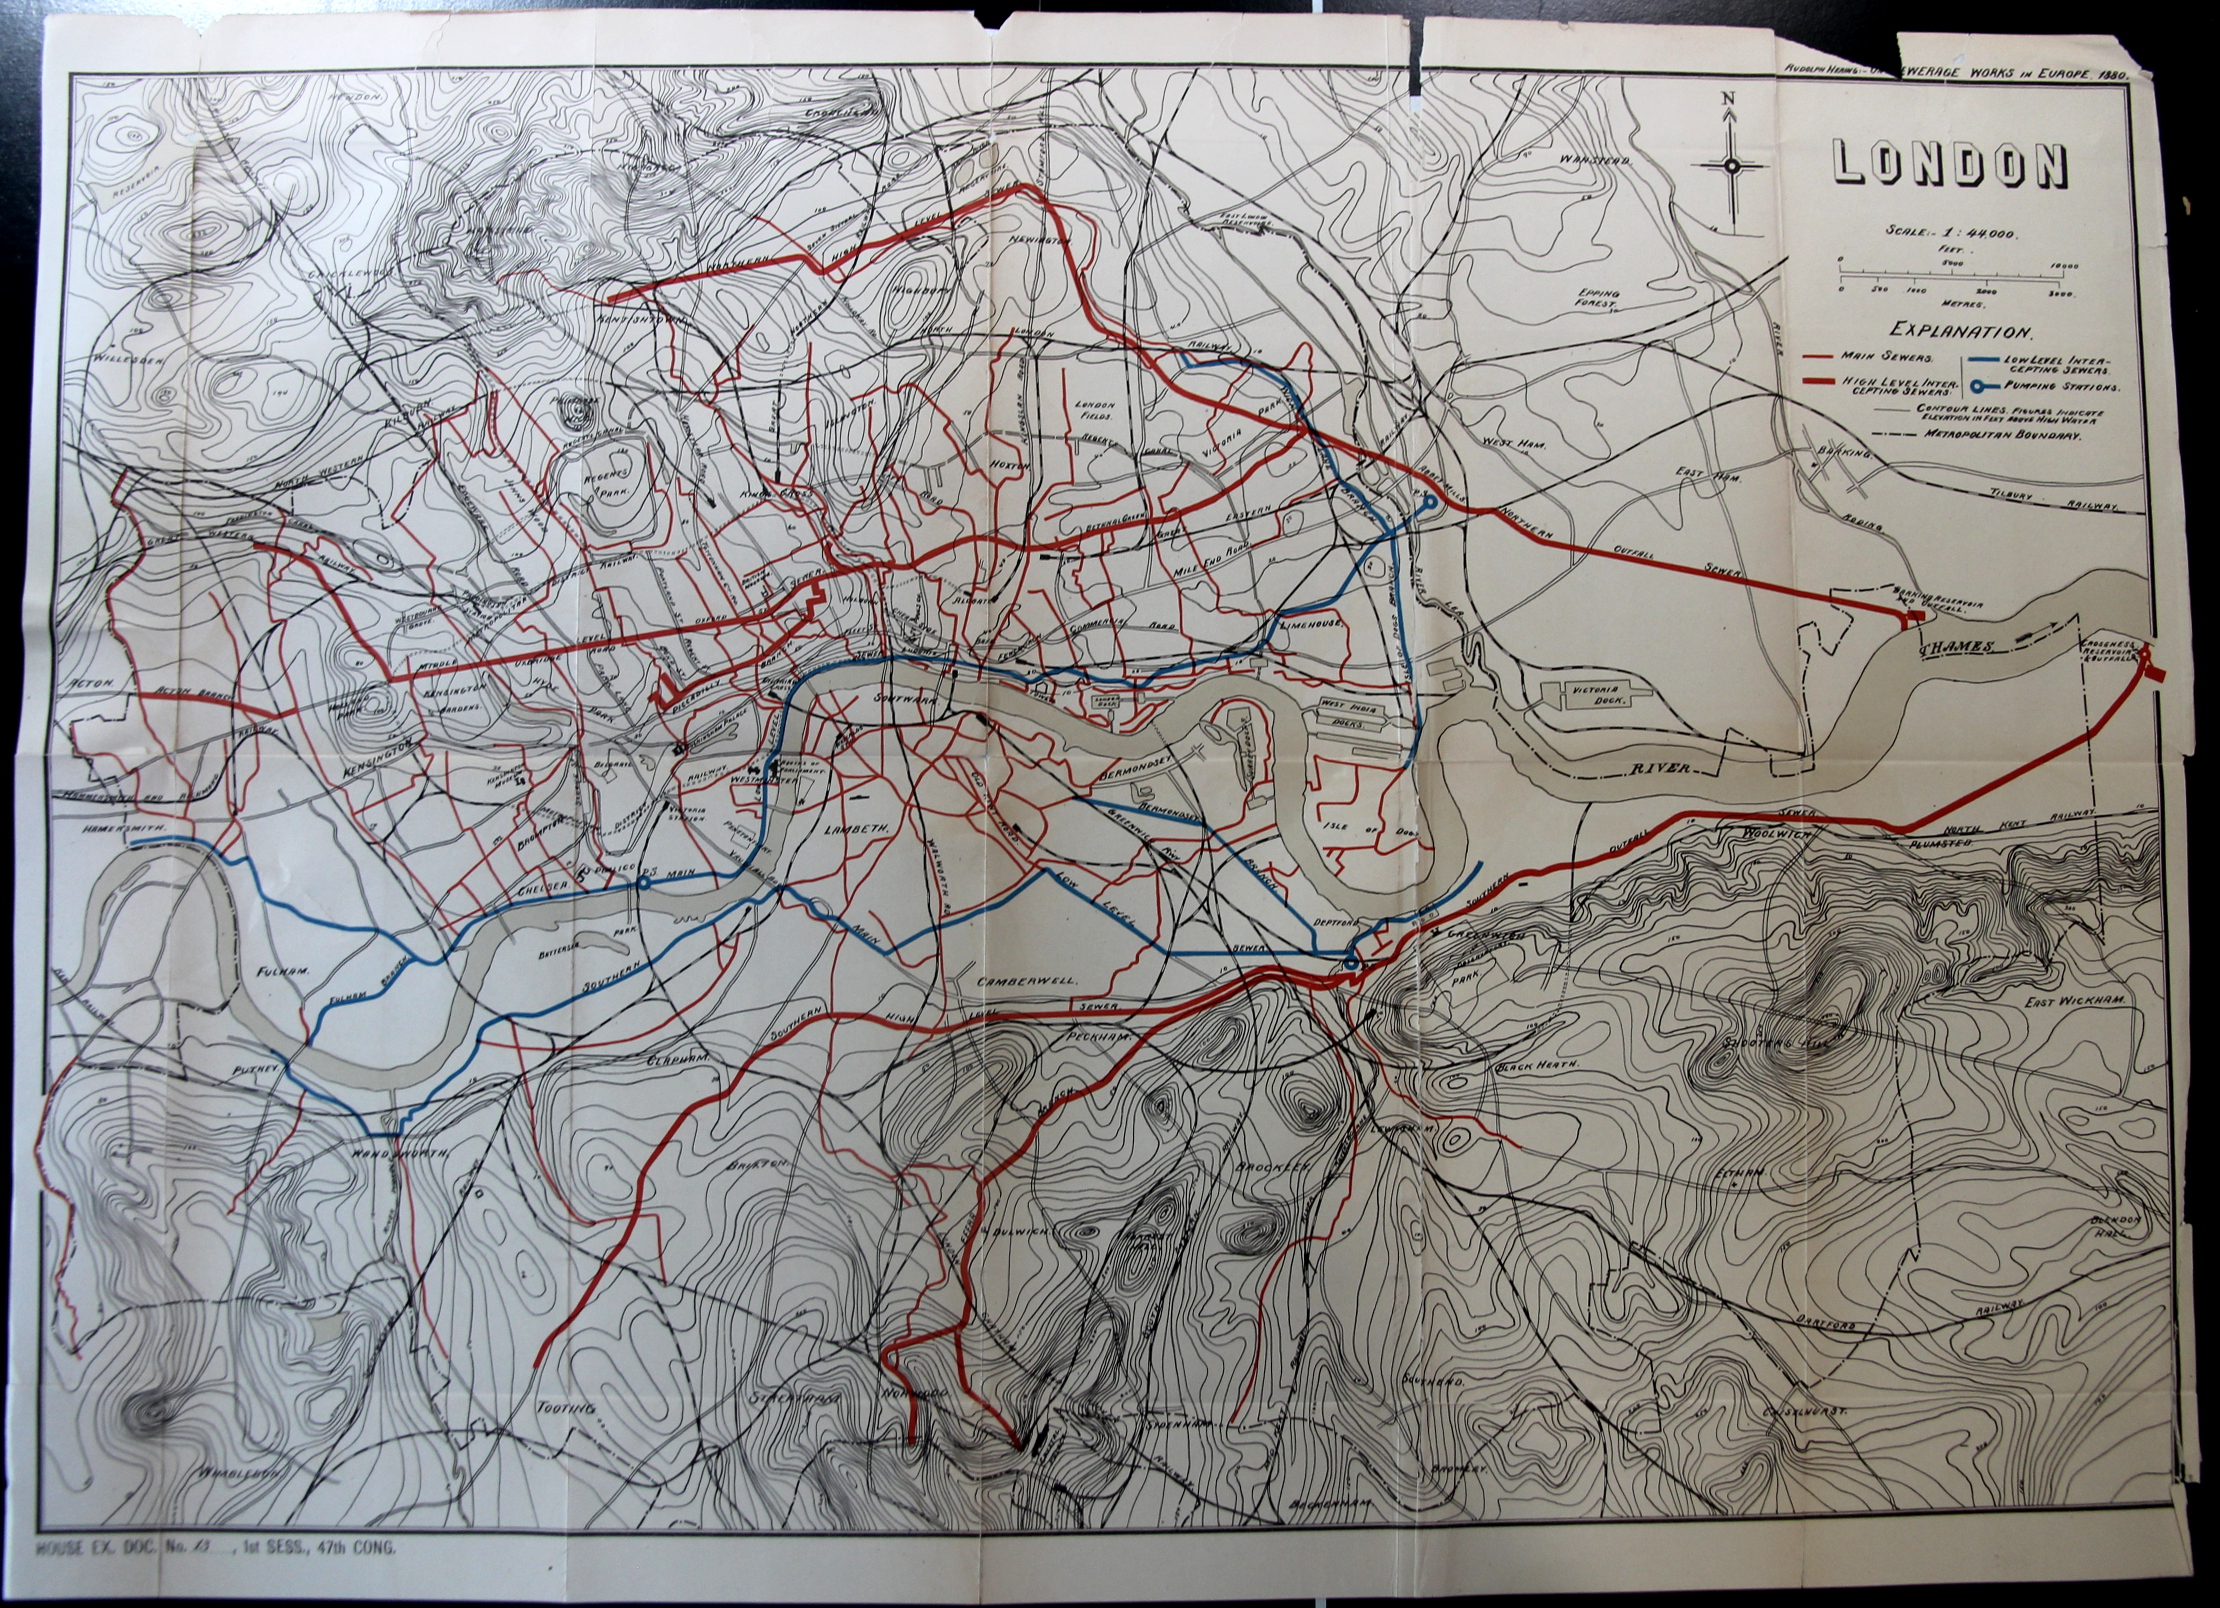
    In any event that leads me into this fantastic map of the “other” London underground, the sewer system, the alternative outflowing lifeblood of the great city.

    London Map Sewer

    The map appears in the Report of the Results of an Examination Made in 1880 of Several Sewerage Works in Europe, by Rudolph Hering, in the Annual Report of the National Board of Health 1881 (Washington: Government Printing Office, 1882), pp. 99-223.

    • The original version of this map is offered for sale at the blog bookstore, here. 

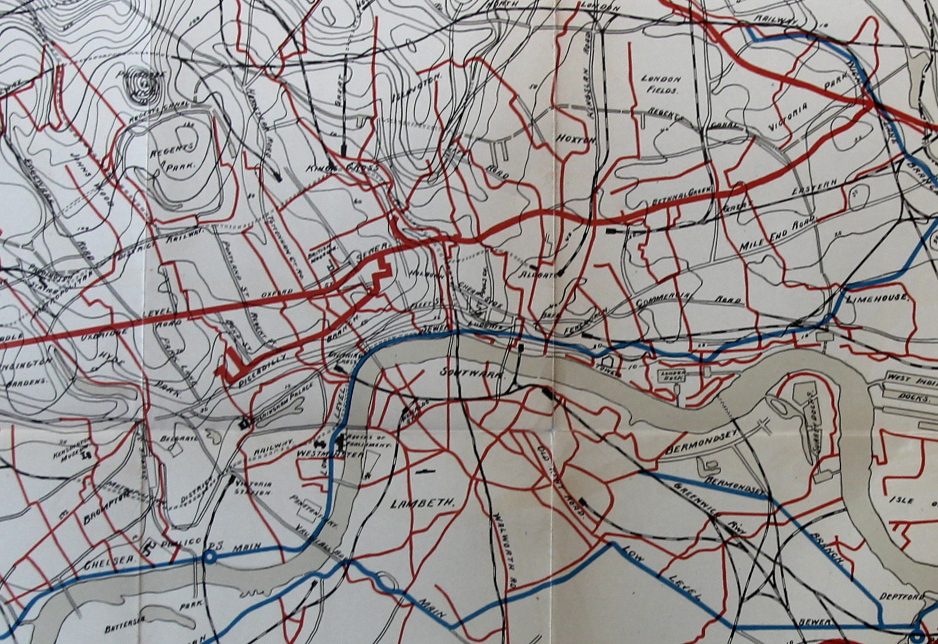
    And a detail:

    London Map Sewer detail

  • The Long and Short and Low and High of Rivers and Mountains, 1862

    JF Ptak Science Books   Quick Post

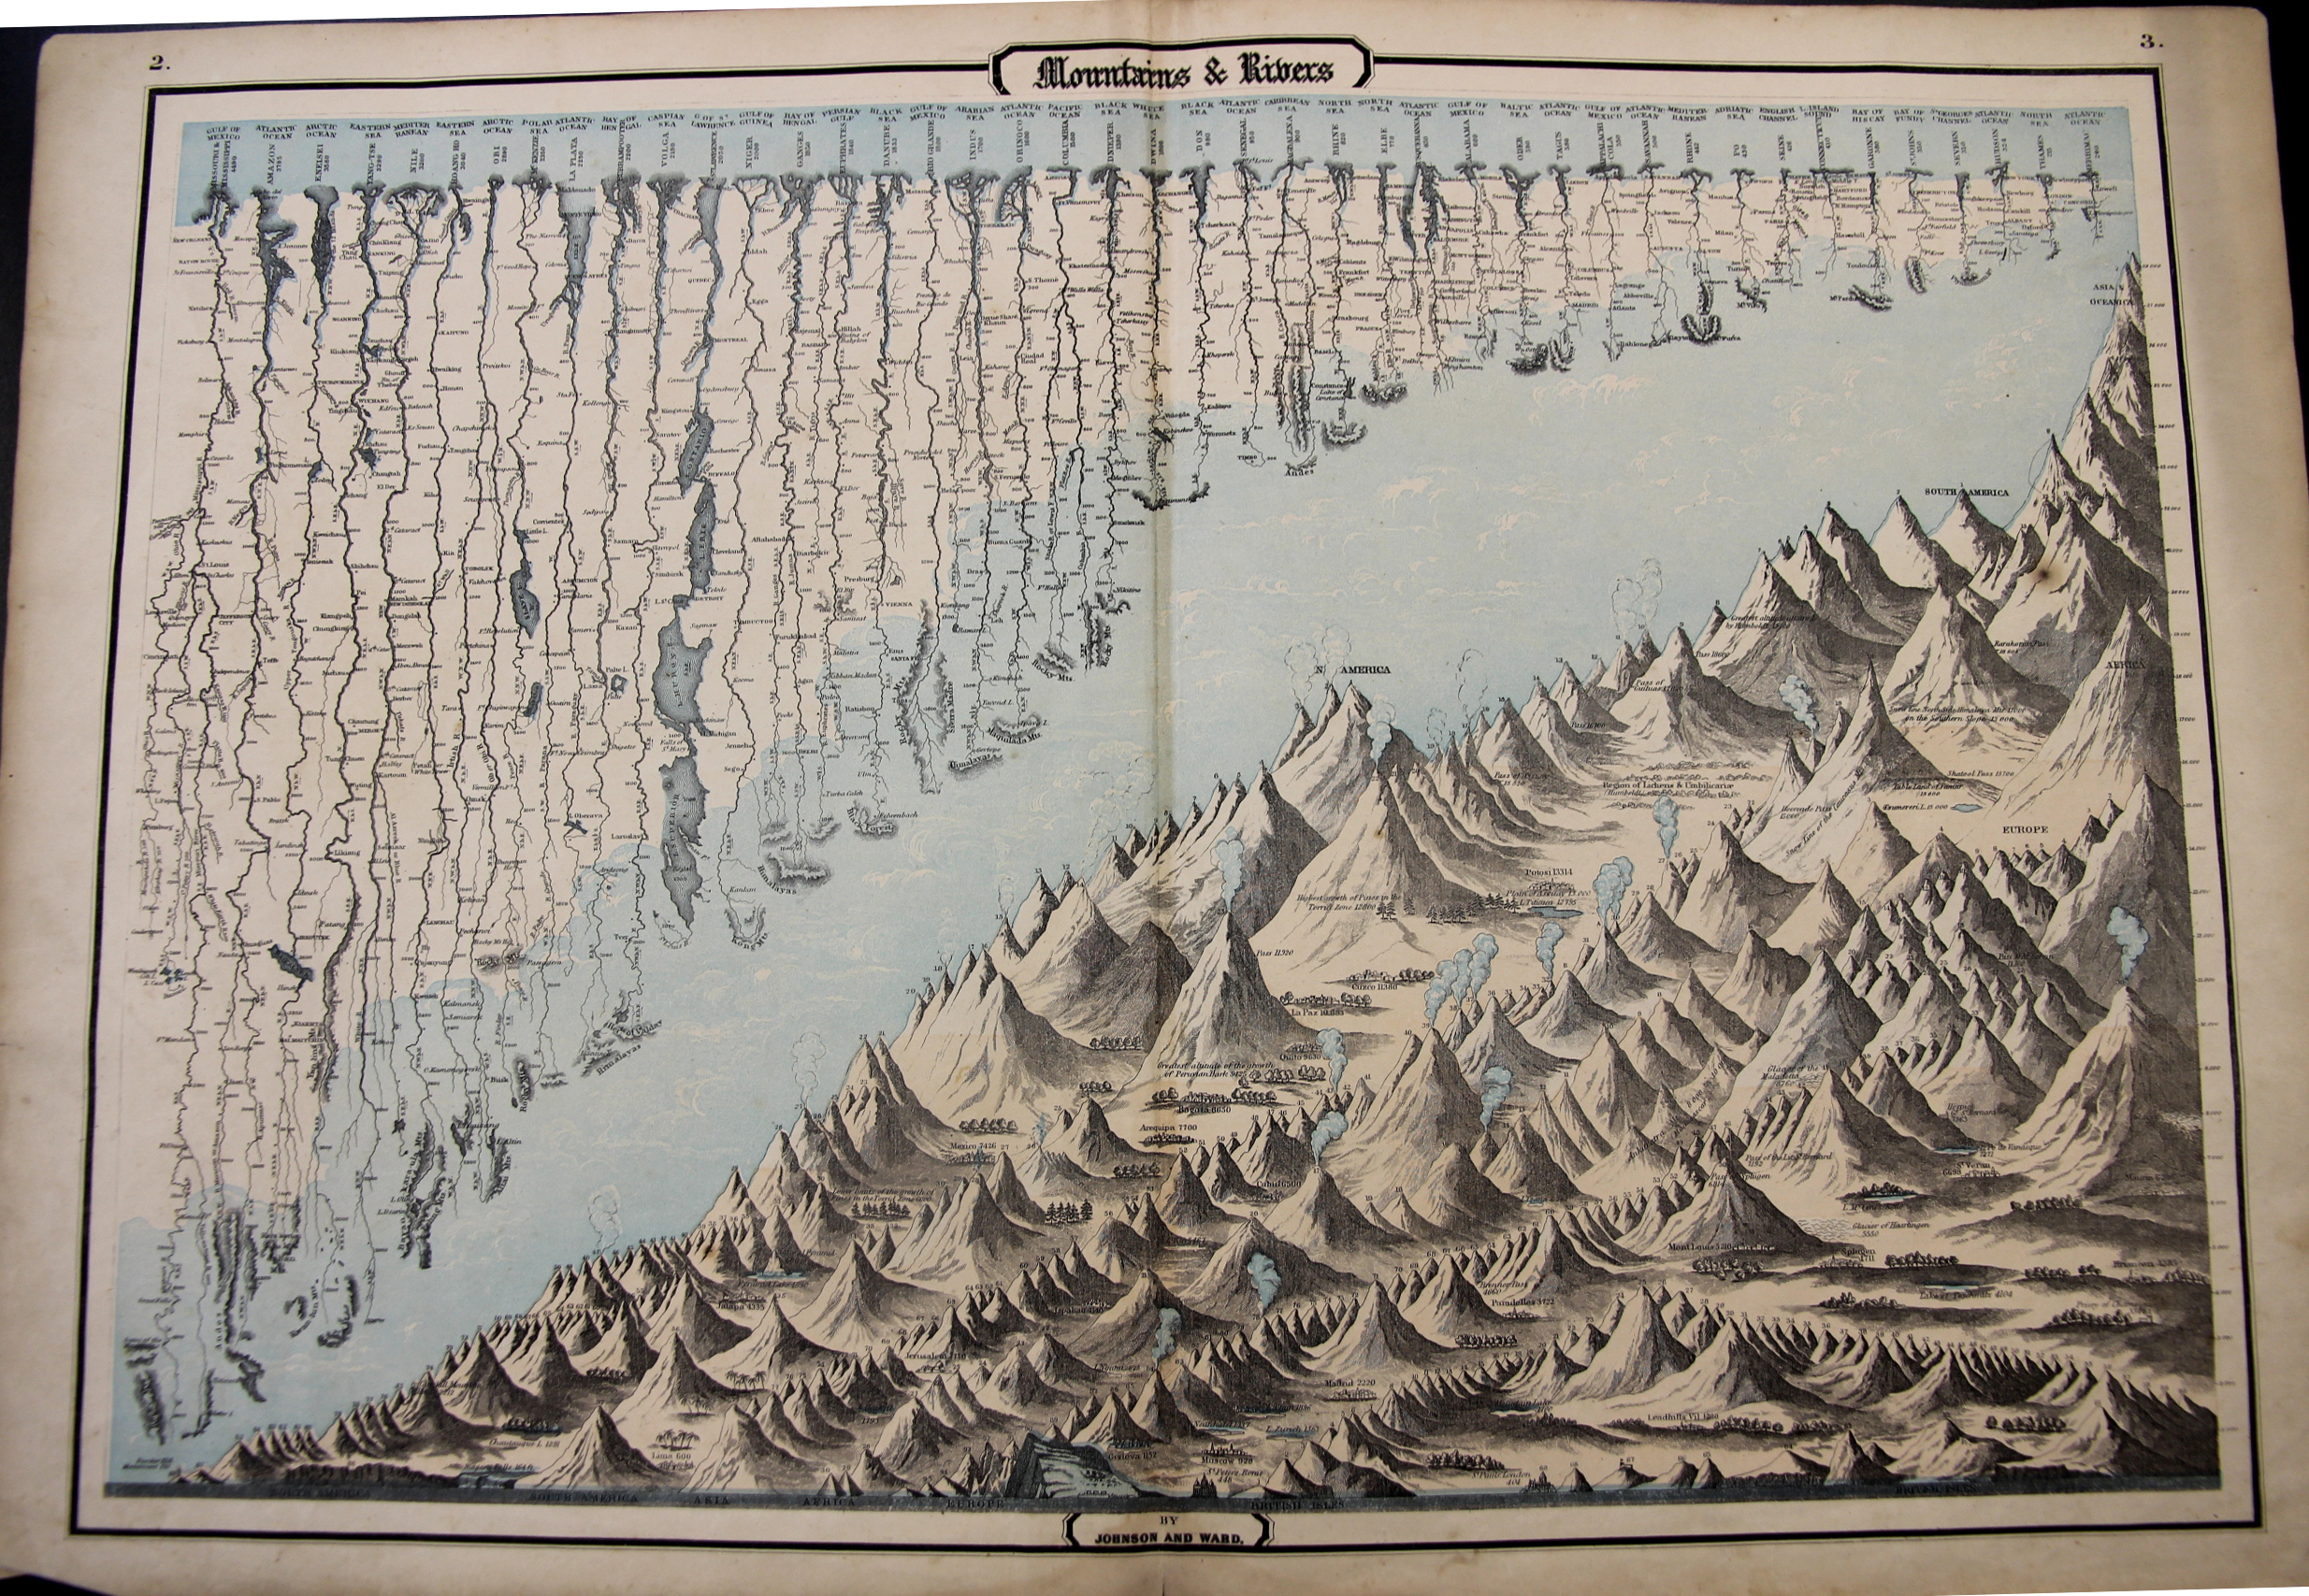
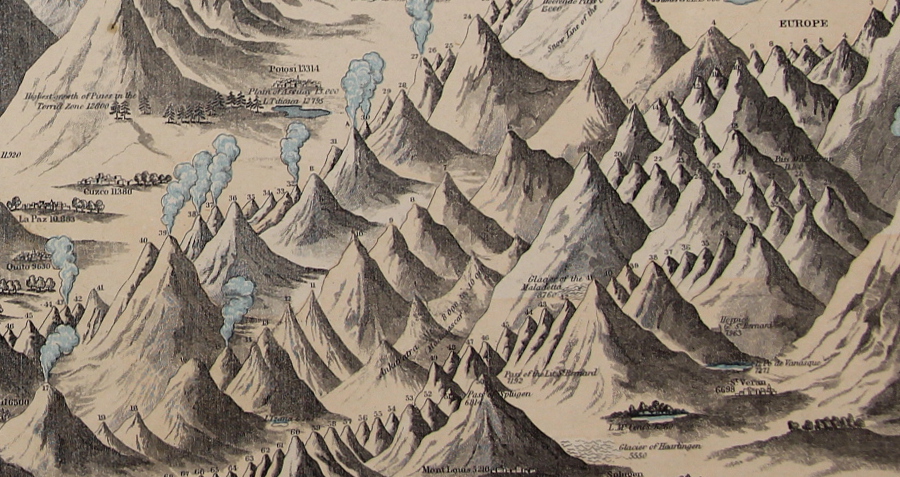
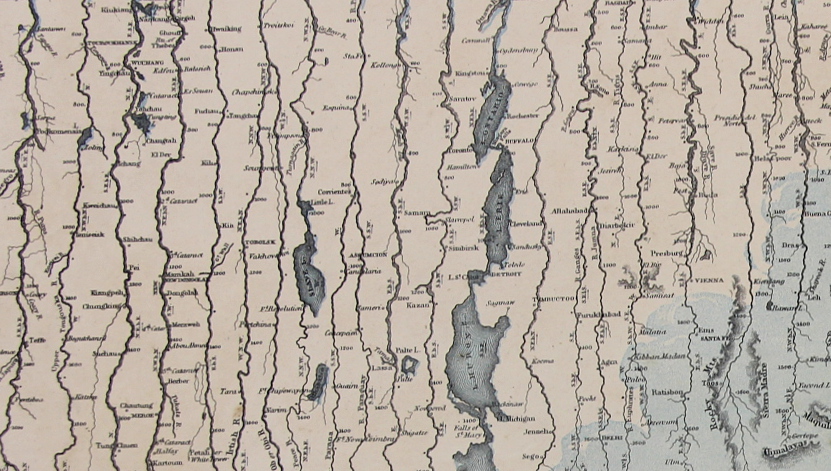
    This map may be simply named (“Mountains & Rivers”) but the information it displays is hardly so. As a matter of fact there are probably a thousand data points in this flowing, pleasingly-design comparative display of information–and the closer you look, the more there is. 

    Mountains and Rivers 1862

    In the mountains section there are hundreds of pieces of data locating the elevations at which cities and towns are found, and the altitudes of the extent of different types of trees, and of course the comparative heights of enumerated mountains set off by the continents.  Above the mountains floats the fantastic display of the lengths of rivers, listing 43 in all, showing cities at the various stages of each river’s progress. 

    It really is a glorious thing.

    Mountains and Rivers 1862 detail

    “Maps & Rivers” was printed and published by Johnson & Ward in 1862 and appeared in Johnson’s New Illustrated Family Atlas; there is at least one earlier version that appeared in 1856 with a different background and with ornate Celtic-inspired borders, though I prefer this version with the simple border and the full blue-sky-and-clouds background.  For my experience this is one of the richest of the genre published in the mid/late 19th century.

    • The original map is available for sale at the blog’s bookstore, here. 
    • Mountains and Rivers 1862 detail rivers
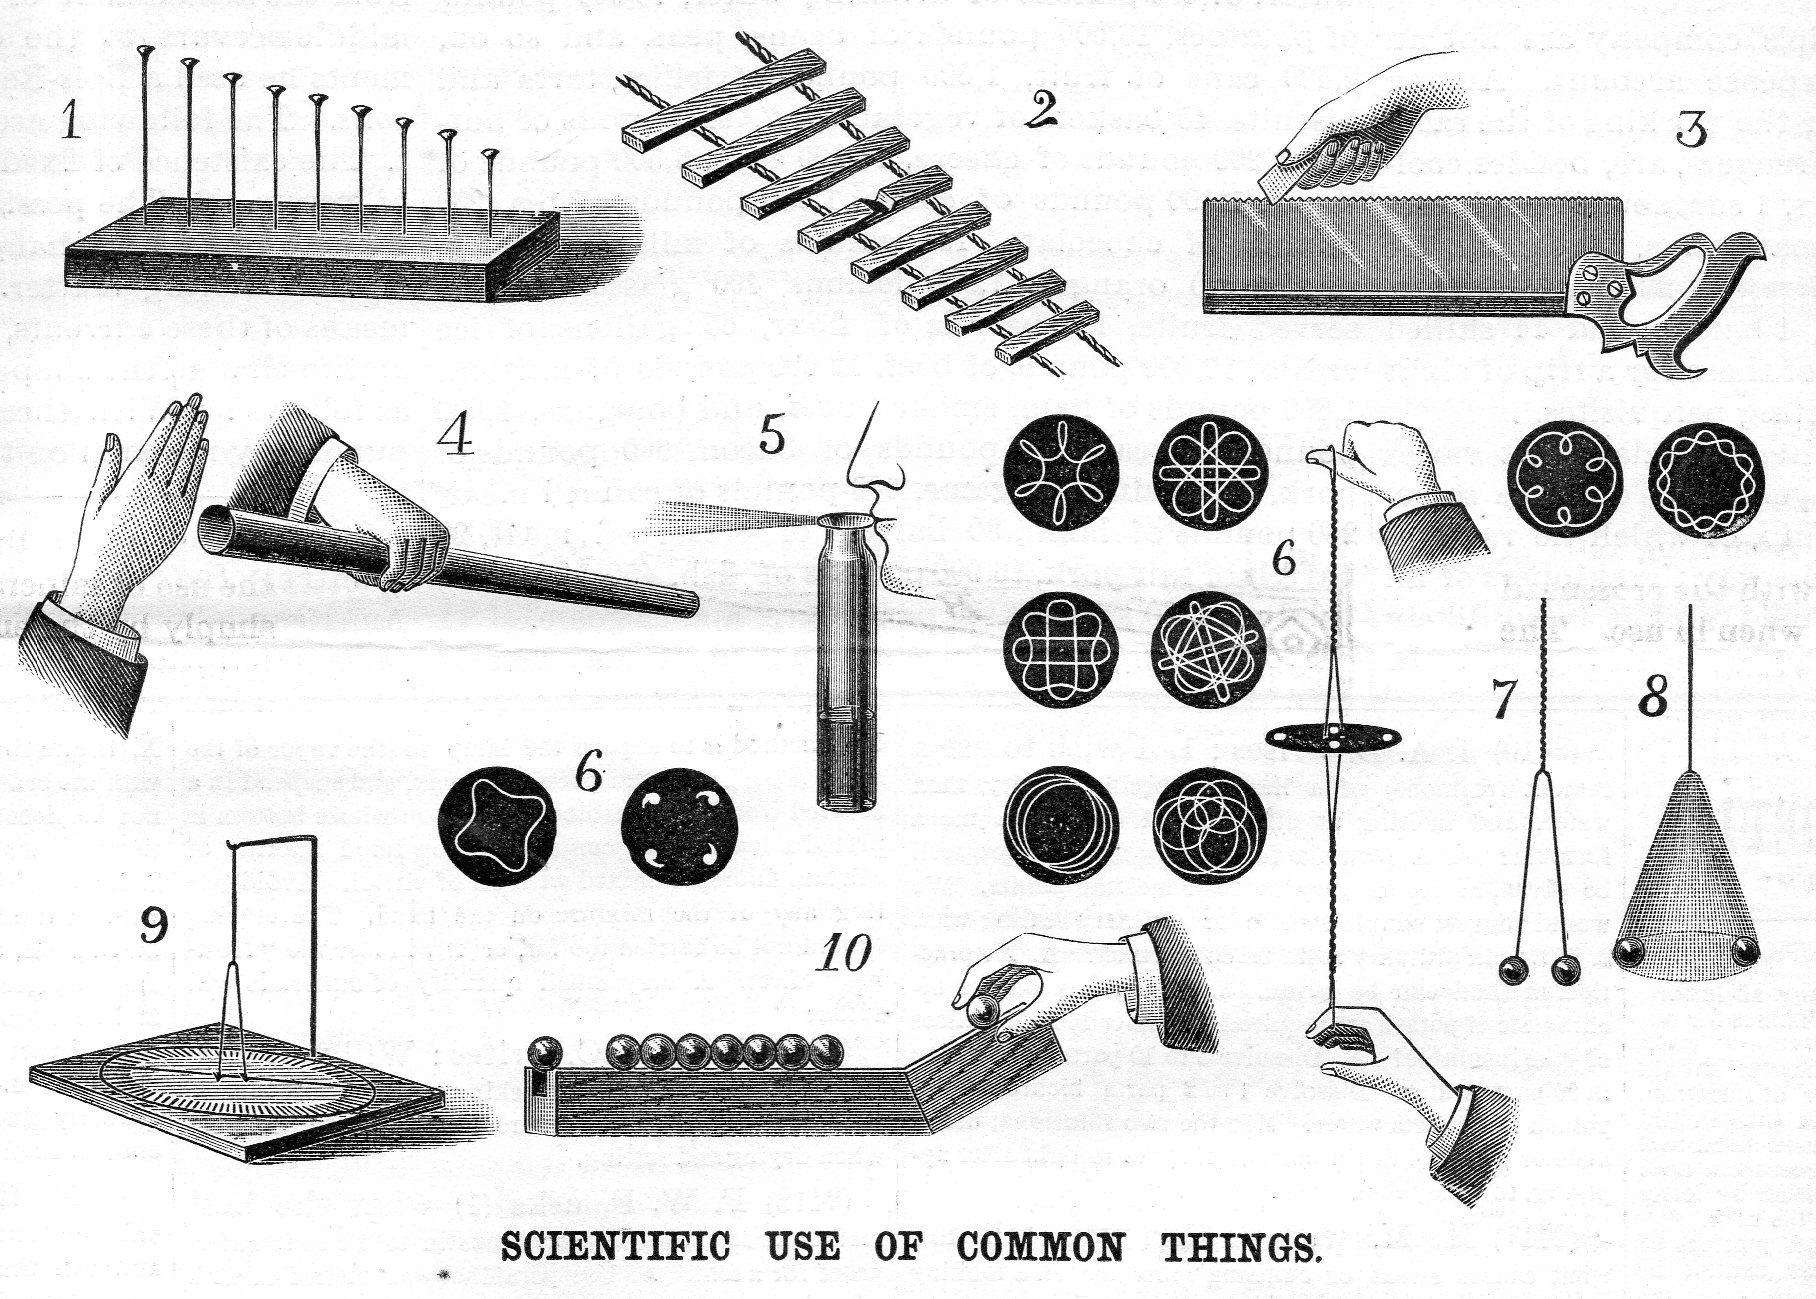
  • The Dept. of Great Titles: “The Scientific Use of Common Things”

    JF Ptak Science Books    Quick Post

    This title, drawn from the identifier of an illustration from Scientific American (for September 13, 1890), I think would be a great way of teaching sci/tech principles, using stuff from your desk or hallway etc to illustrate the scientific method and to see how “science” can be found in  Real Life.   Of course this was from an era in which books like Ganot’s Physics would instruct not only on the principles of a pump but how to fix it as well–and also how to make the hardware like the nuts and bolts that you needed for the fix-up, and so on.  In general Scientific American was great for this sort of thing–these were the additional bits to the scientific news and drama of the week, the recipes on how to make the blackest ink and other such potentially useful recipes.  

    I’ve included this illustration because of the <sigh> requirements necessary to see what has been lost in scientific education at the elementary levels, and also due to its high/found artistic qualities.  It also looks like a puzzle, but isn’t. 

    Sci american use of common things086

    ·Posted by :

    ·in:

  • Bloomsday: Davy Byrnes, Gorgonzola Cheese, and So On.

    JF Ptak Science Books 

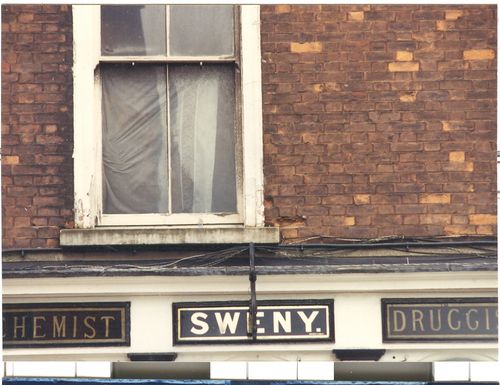
    I just came across these image that I made on a trip to Dublin some years ago.  Carrying the bags for my wife, Patti Digh, who was actually working there, I described my own work by going on a Ulysses tour. It was Sweny’s and Davy Byrnes (seems like two e’s are missing there, no?)  that I liked the most–particularly so for the chemists, because it looked as though nothing major had happened in there in  years, or at least that was the sense of the smallish creaking shop.  I wanted some lemon soap.

    See here for the rest: 

    [I am very happy to report that since this post was written in 2009 our daughter Emma Digh Ptak retrieved new lemon soaps for me from Sweny’s.]

      Sweny_1_

    ·Posted by :

    ·in:

  • Big Paper History: 1806 Chronology of the Years 14-1800

    JF Ptak Science Books Post 2478

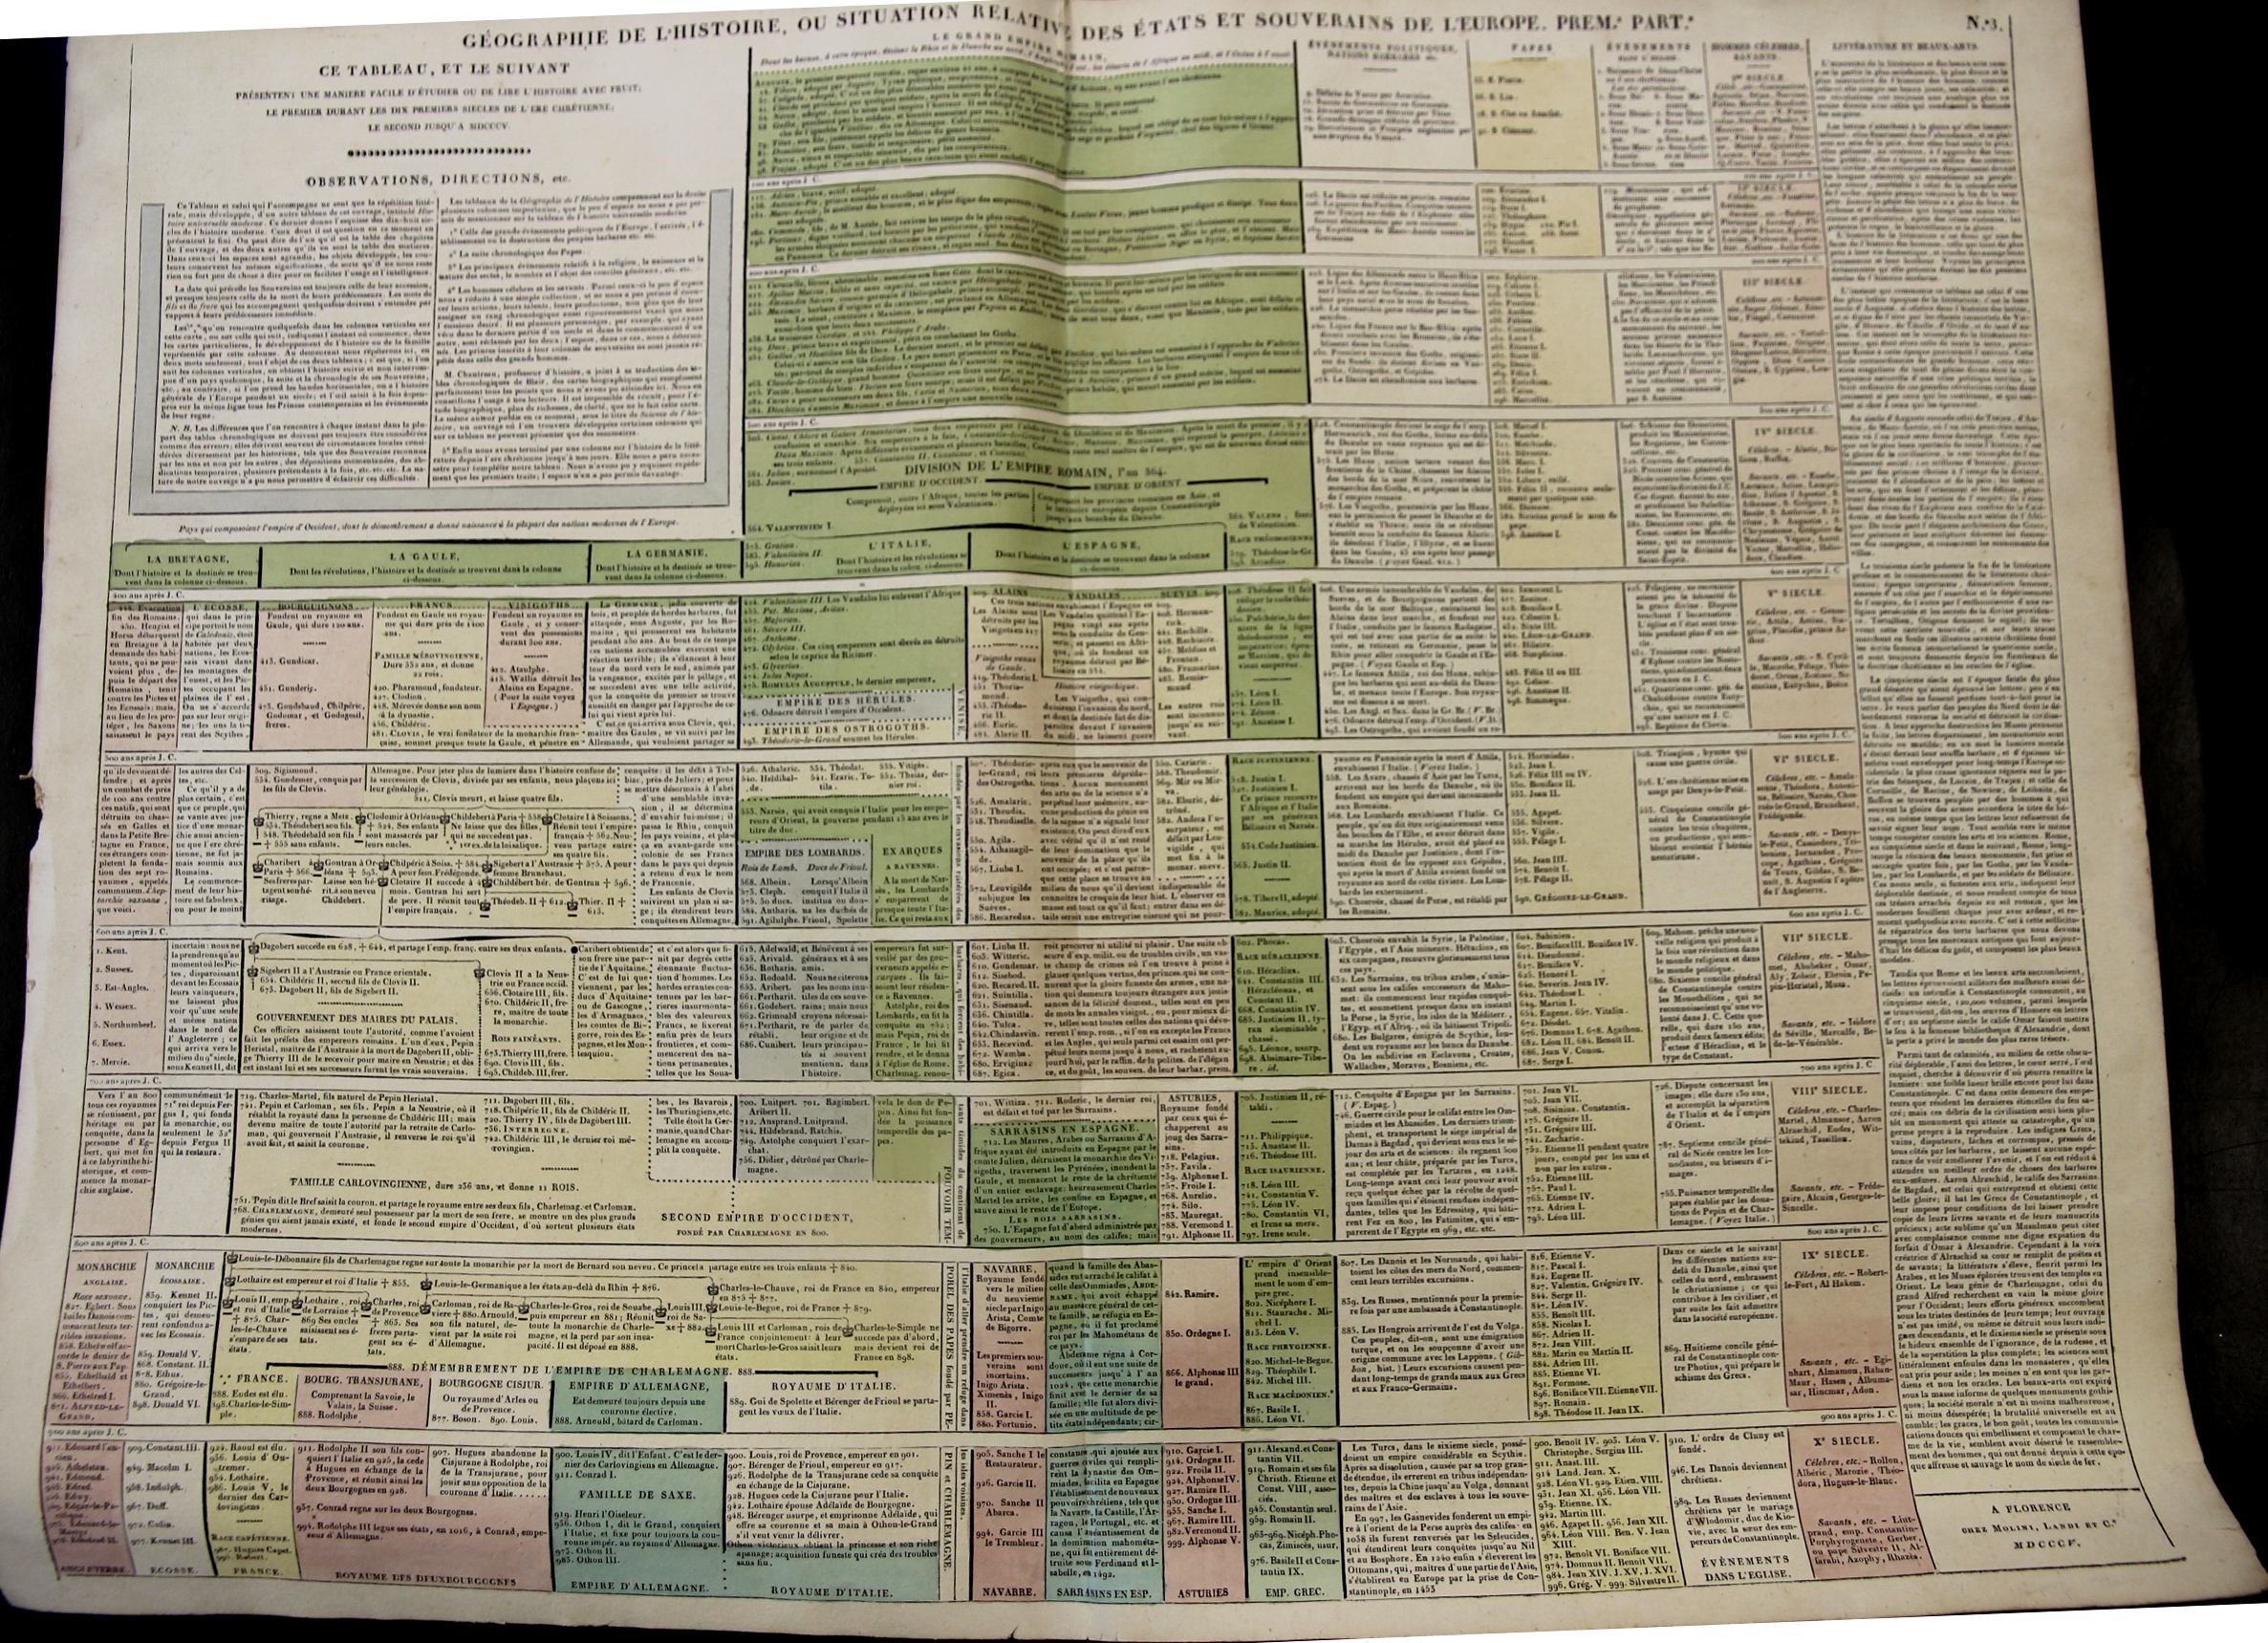
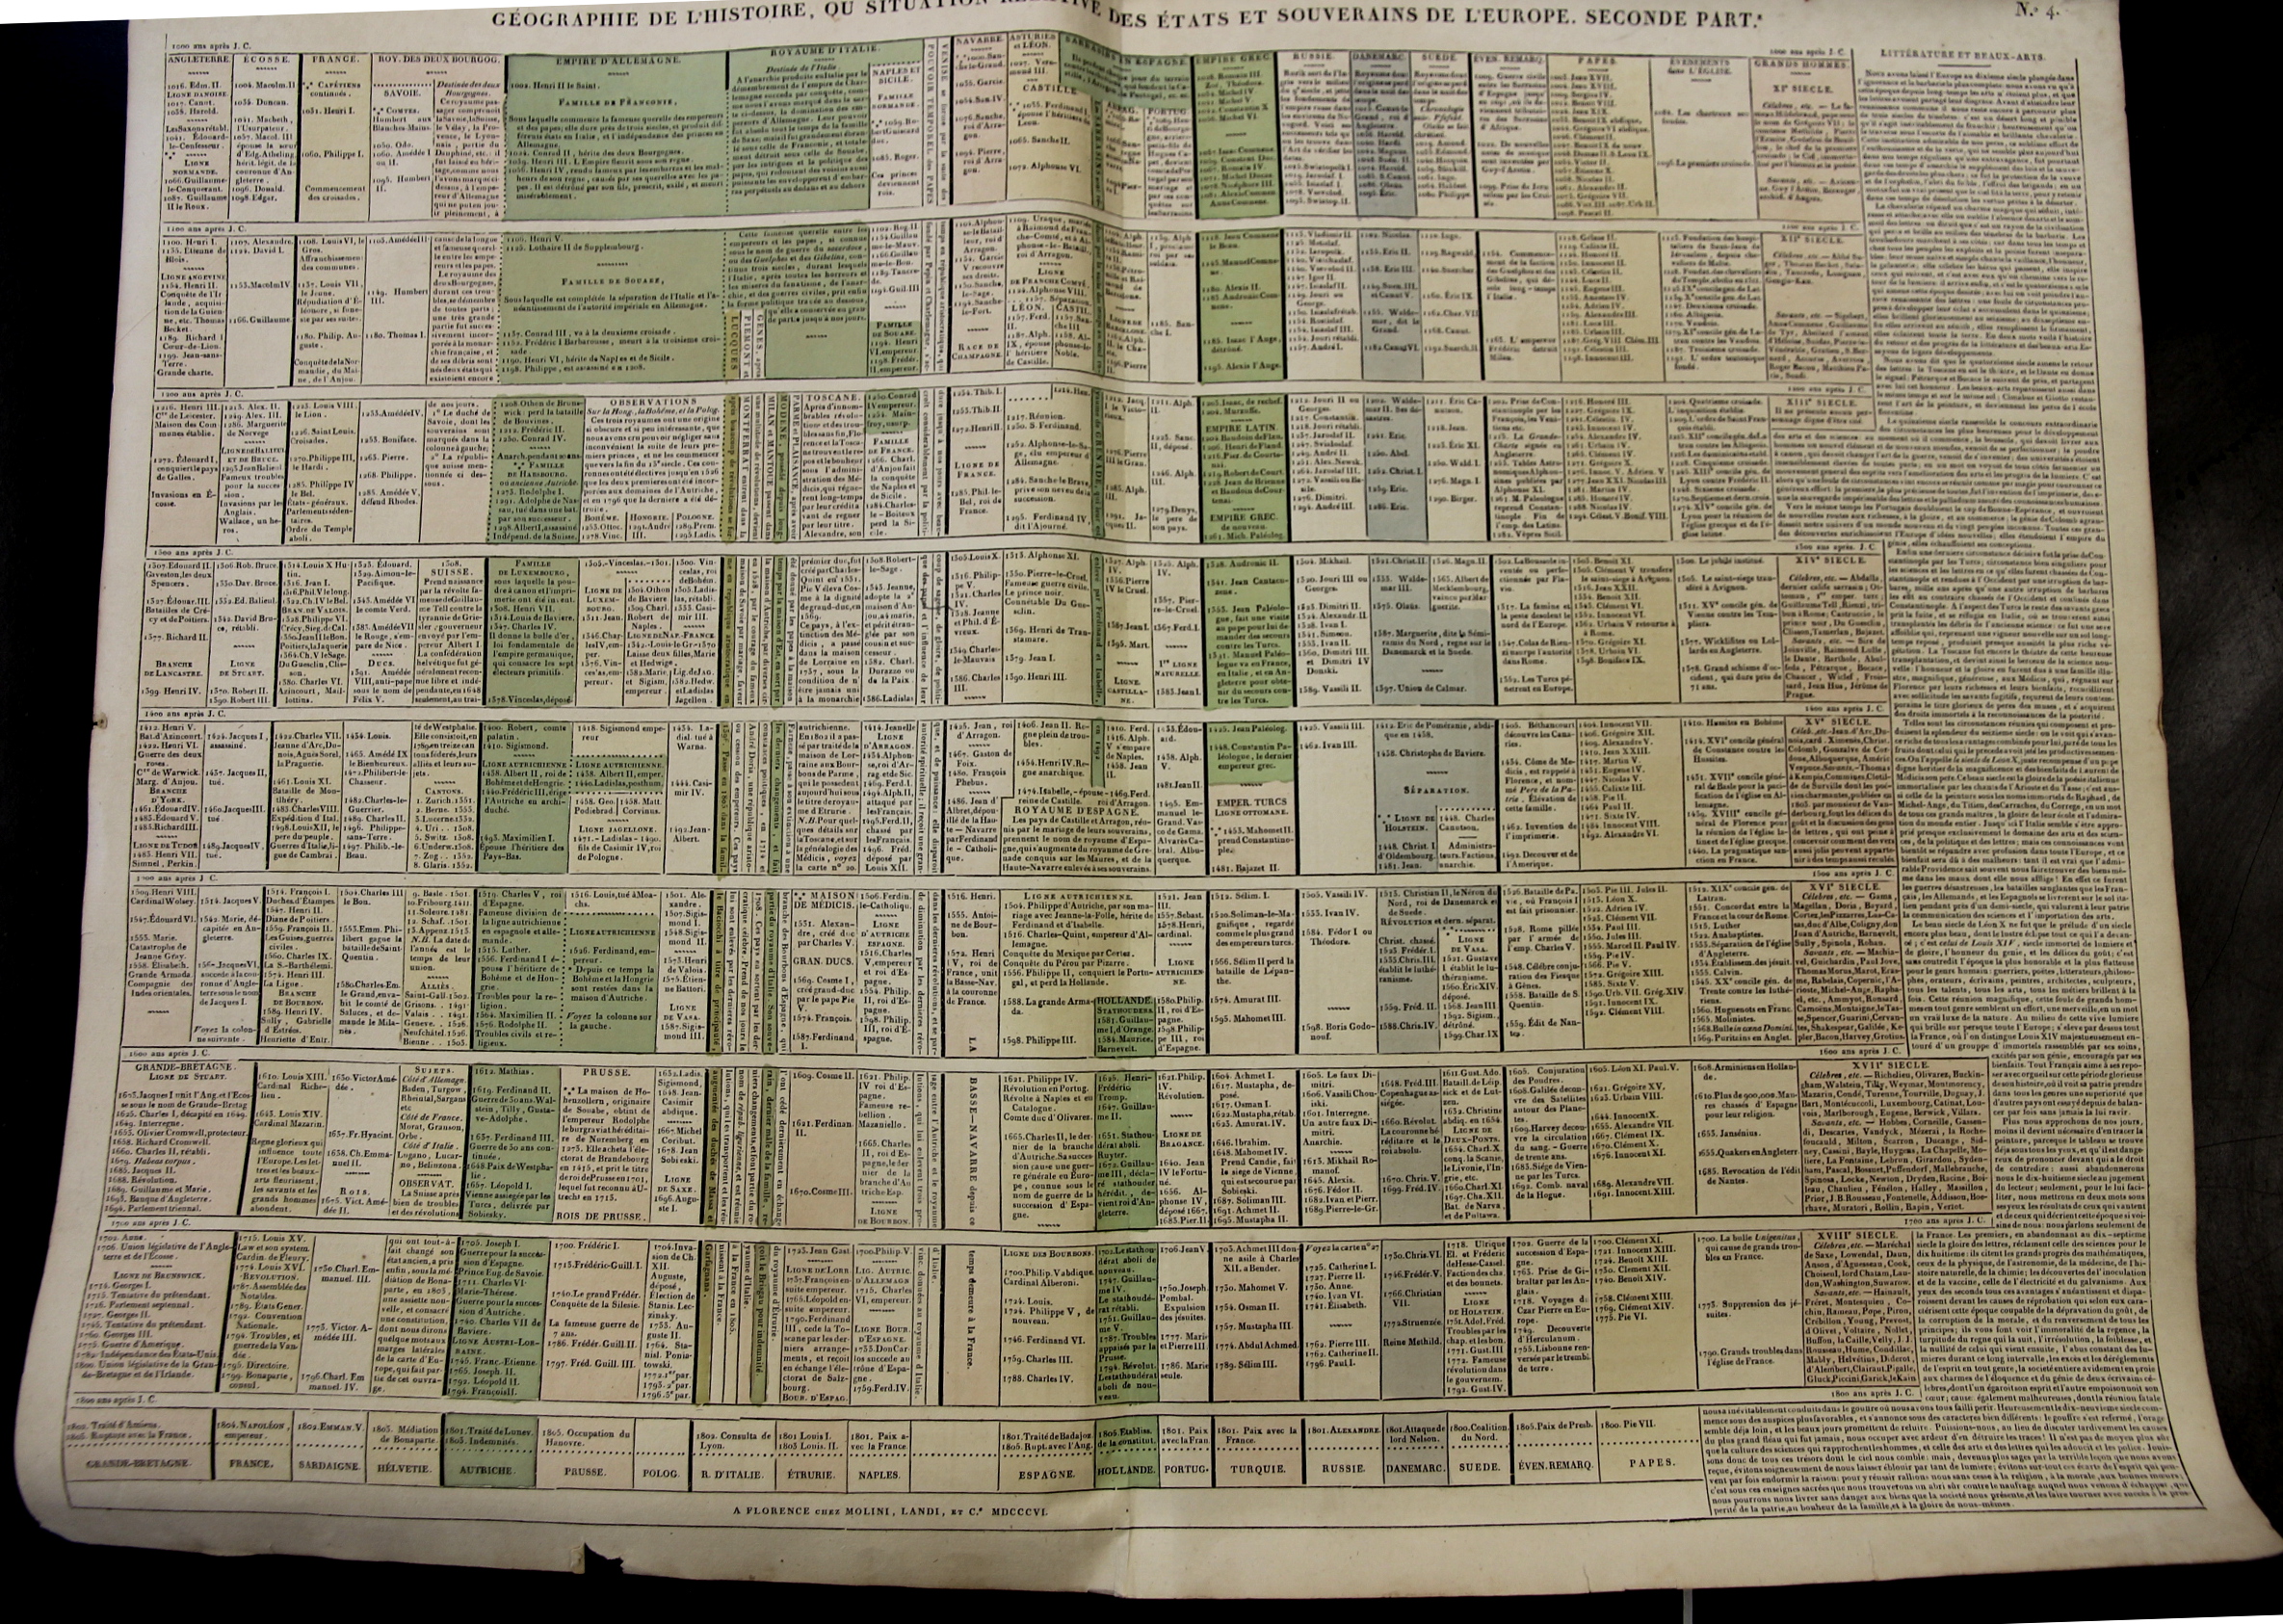
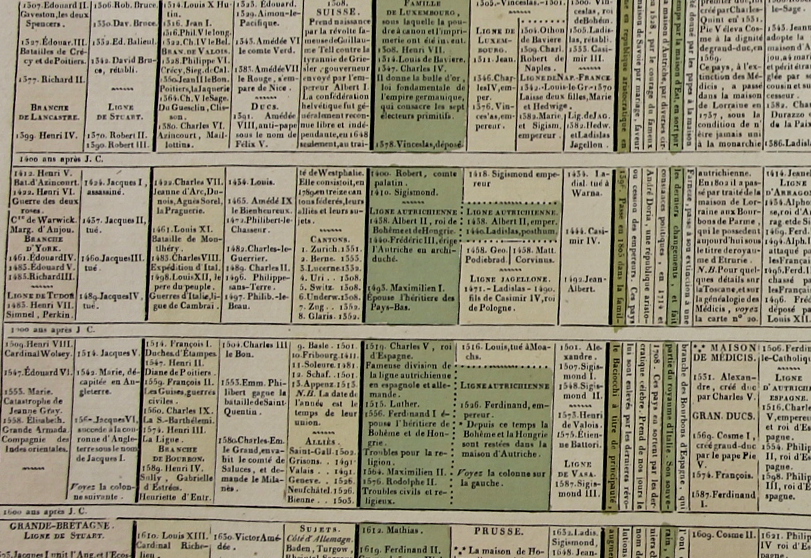
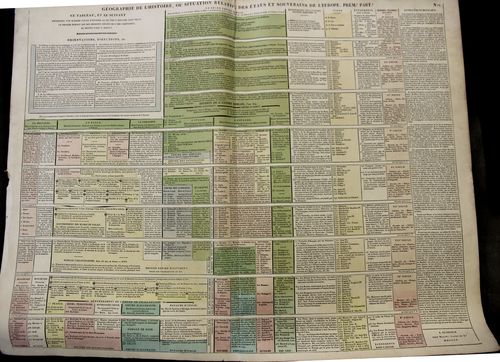
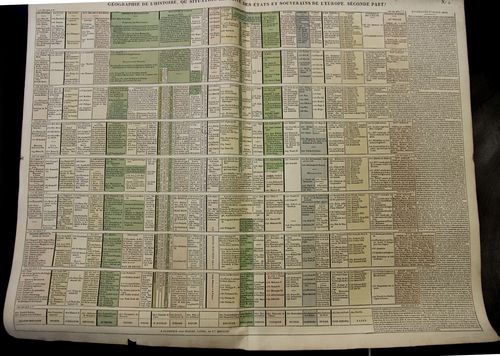
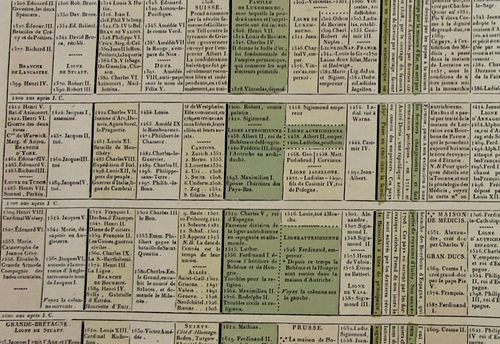
    Starting at the year 14 (ACE) with the reign of Augustus Caesar this large two-sheet chronology organizes the rulers of the Western world so far as it was known into the early 19th century. (“Geographie de l’Histoire. ou Situation Relative des Etats et Souverains de l’Europe (in two parts), published by Molini and Landi, in Florence, in 1806.) There are 15 major divisions from the year 400-1800, with a short bit at the top of the first chart covering the previous 386 years or so.  The columns show the rulers of reach century for Britain, France, Germany, Italy, Spain  (then subdividing as necessary). There is one column for the “nations barbares” that covers everyone else in about 2″ per century; there is another column for the chronology of Popes; one column for a general history of the Christian church, one column for celebrated and famous people, and then a final column for literature and the arts. 
    Maps_Chronology_LeSage_1_

    • You can own these!  Check them out on the blog’s bookstore, here. 

    At the very least the chart helps you keep your rulers straight, so to speak–it is also the sort of engaging display of data that if it was hanging up and accessible that people would read it all the time in passing. 

    The sheets are large (27×21″ or 68x53cm, and combined (as I have done in the past) they make a very imposing display 42×27″ (106x68cm).  The coloring (except for the odd darkish green) is fairly subtle but evident and useful in distinguishing the blocks of data at an easy glance. 
    Maps_Chronology_LeSage_2

    I’ a big fan of this sort of arrangement and display of data, trying as I used to in graduate school (and still do now) to fit the appropriate memory triggers on any given subject onto one sheet of 8.5×11″ paper.  It is a highly useful memory exercise, creating your own memory palace. 
    Maps_Chronology_LeSage_3

    These charts appear in A. Le Sage (Comte de La-Casas) Atlas historique chronologique et géographique ou Tableau général de l histoire universelle présentant un moyen sûr et facile de classer avec fruit tout ce qui s est passé depuis la création jusqu à Jésus Christ espace de 4004 ans….

  • WHen the Barbarians Were Big

    JF Ptak Science Books 

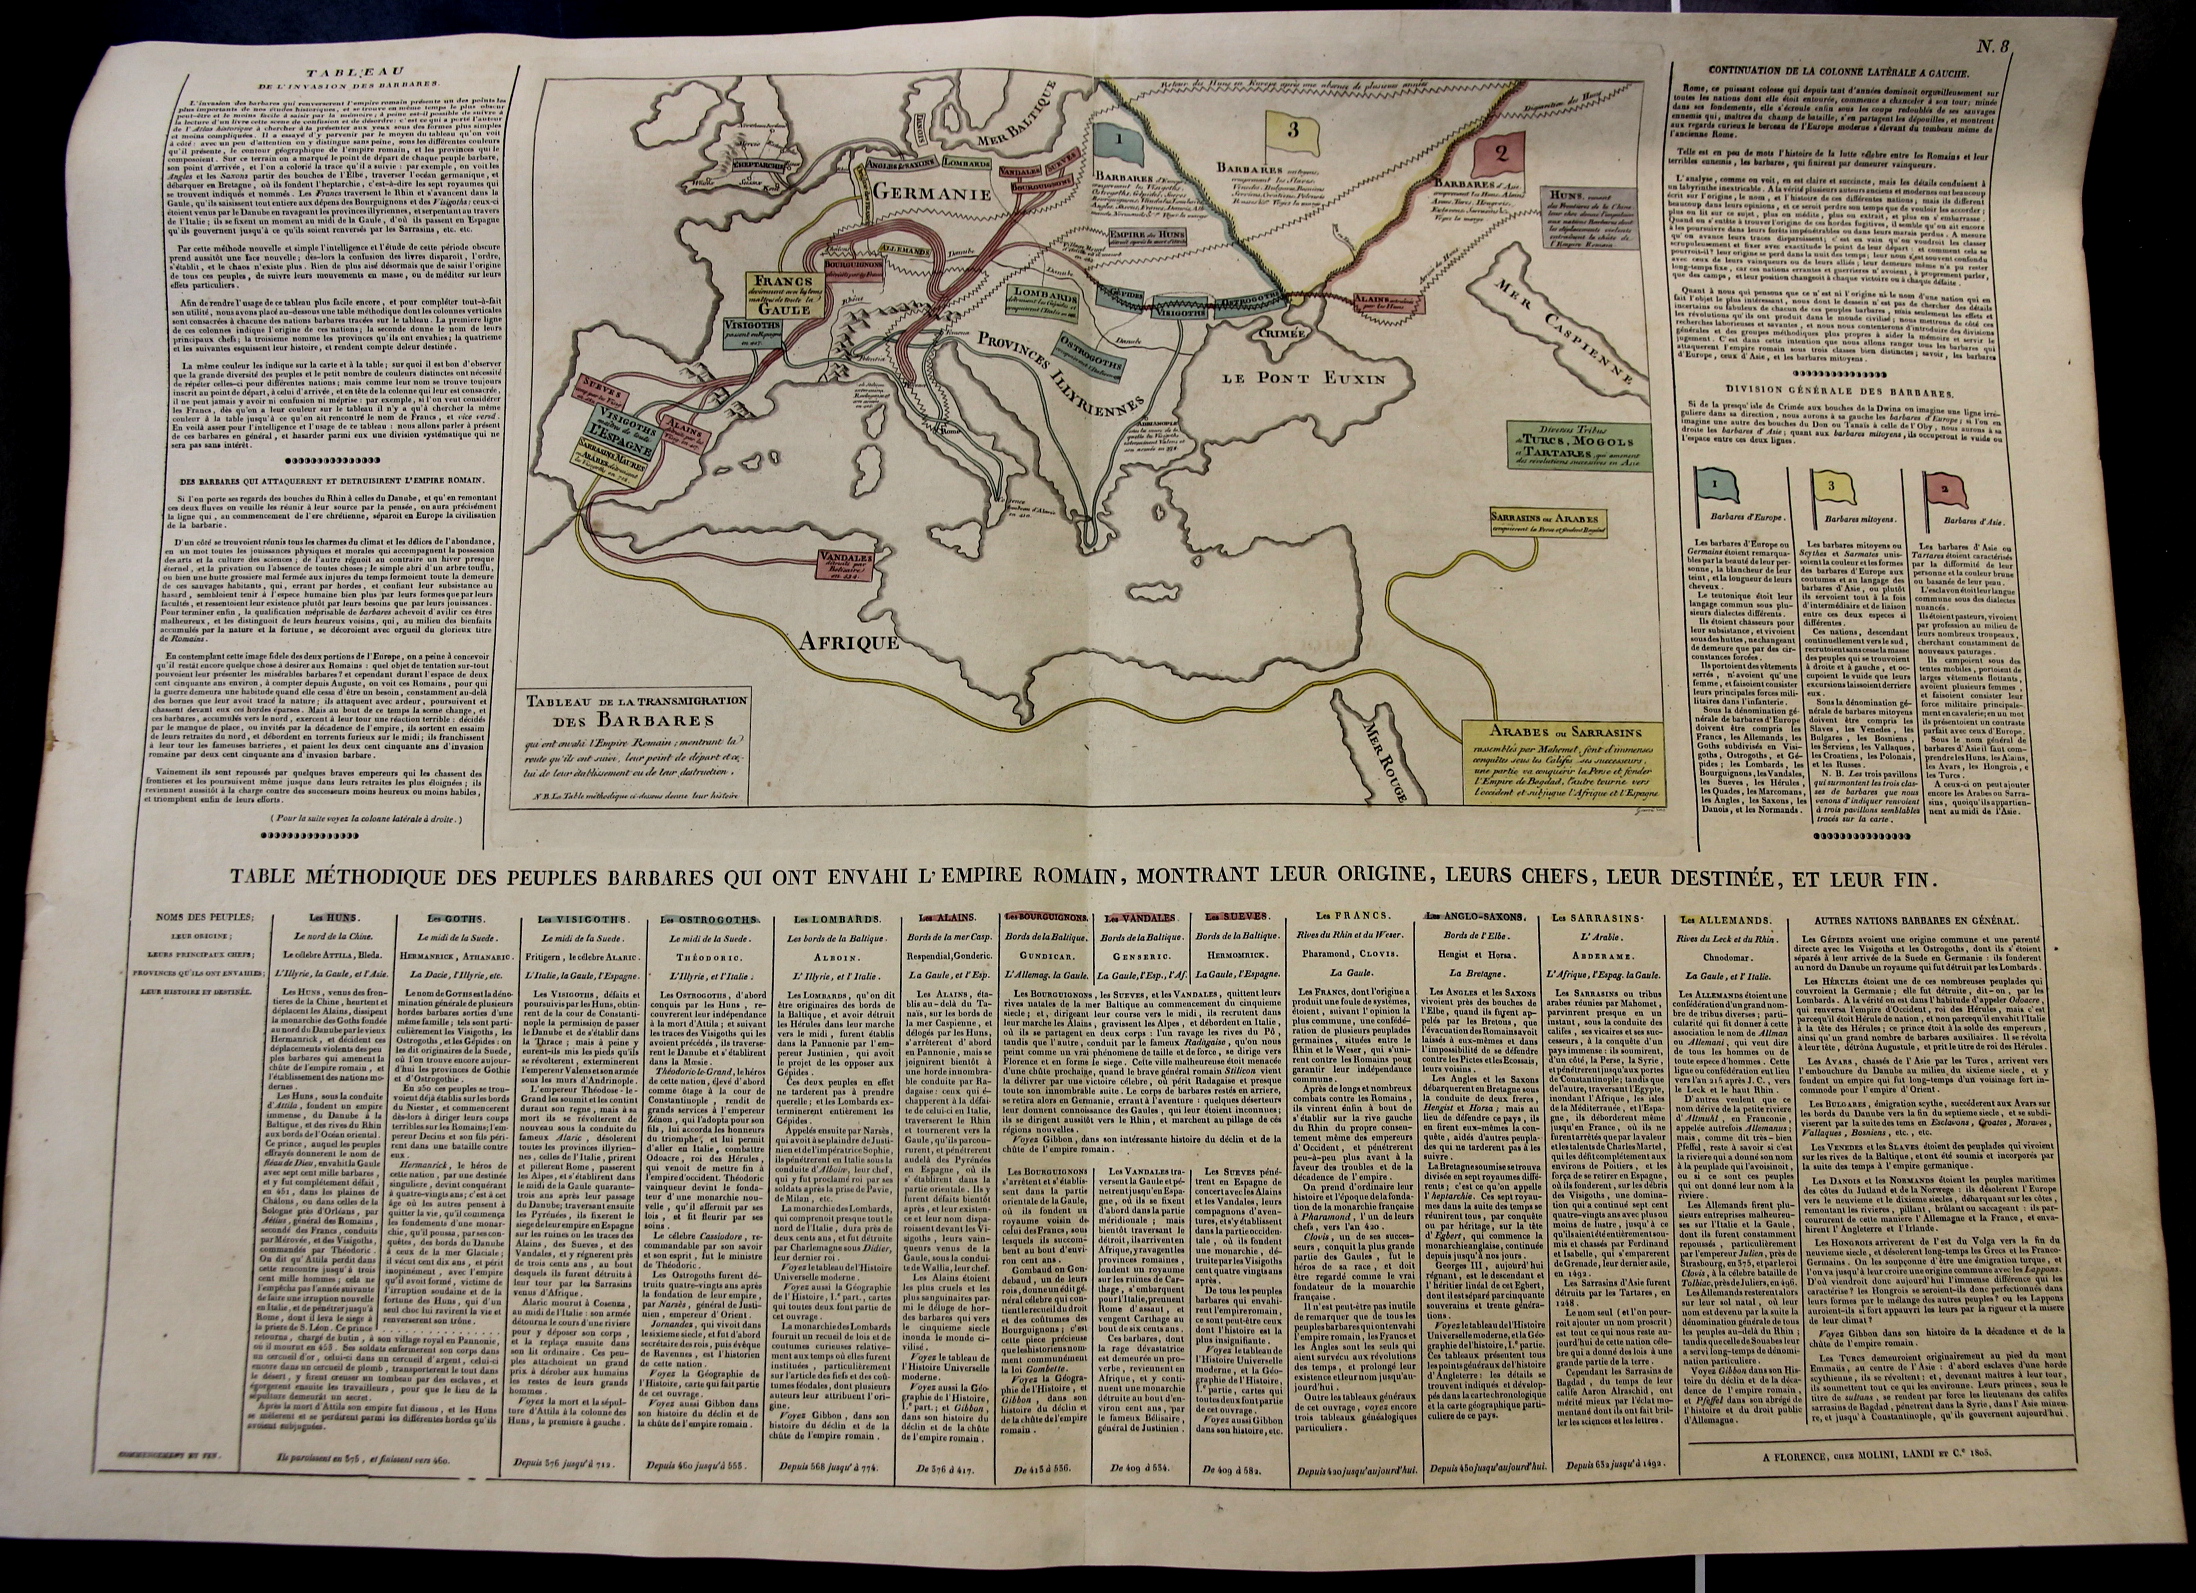
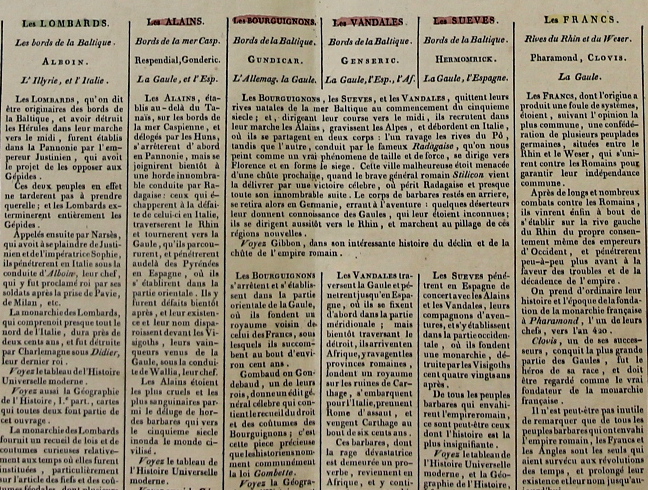
    It is interesting to look at the Roman Empire from “The Other Side”, seeing the world (extending from Ireland to the Caspian) of the surrounding and numerous Barbarians. This map was printed in 1808 and identifies the peoples at all points of the compass outside of the Empire:  Huns, Goths, Visigoths, Ostrogoths, Lombards, Vandals, Swedes, French, Anglo-Saxons, Sarrasins, Germans, Avars, Bulgarians, Danish, Hungarians, and others, all outlined in 14 columns beneath the central map.  This is a finely-designed, accurate, and attractive way of displaying a lot of data in a relatively small (27×21″) space. 

    [Note: the image below is very expandable and readable when enlarged.]

    • Also: the original may be purchased via the blog’s bookstore, here. 

    Maps_lesage_barbarian

    And a detail:

    Maps_lesage_barbarian_b_

    ·Posted by :

    ·in:

  • Small, Compact, Unusual Comparative Heights of Mountains Map

    JF Ptak Science Books   Quick Post–revisited and expanded

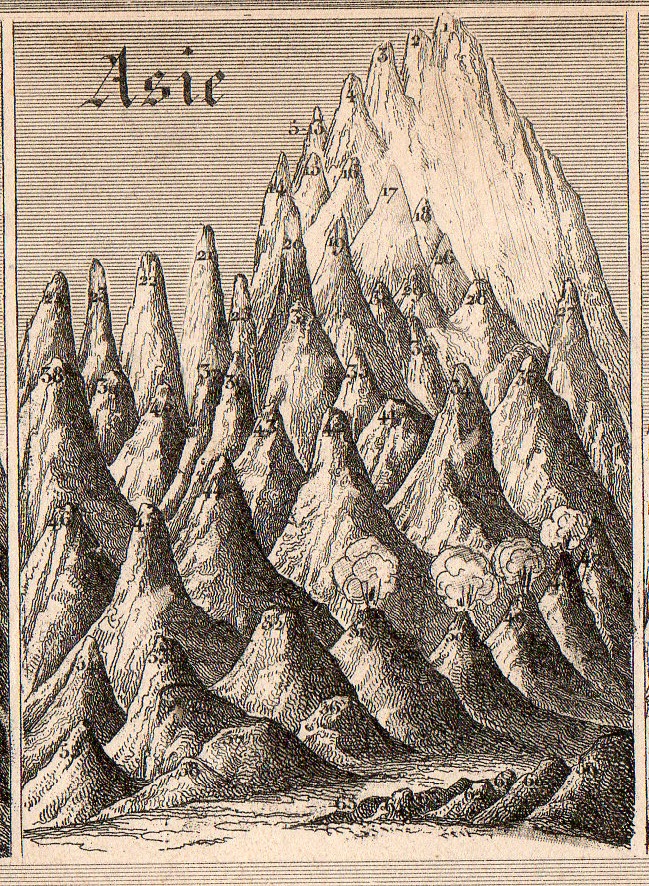
    Mountains small compact114[Small detail from the quantitative display, below; measures 2×2 3/4″.]

    • I wrote about this earlier on this blog but went back to it today to expand it a little and add to the illustrations–and to also place it in the for sale section of the blog. 

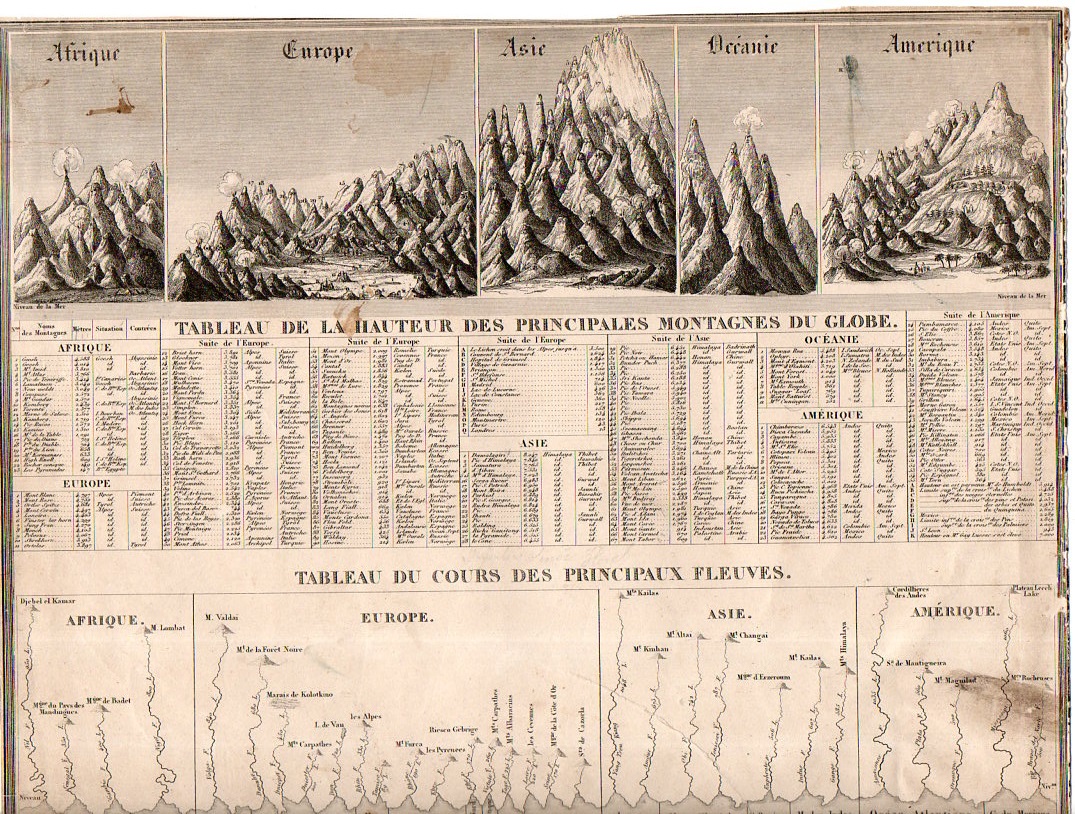
    Generally the dozens of maps/charts showing the comparative heights of mountains and lengths of rivers maps that have come through the store part of this blog have been somewhat large–or at least larger than the present example, which may be about the smallest (at about 11×8″) detailed representative of this genre that I have seen. 

    Mountains small compact113

    “Tableu de la Hauteur des Pricnipales Montagenes du Globe” was published in Guillemin’s Atlas universel de Geographie Ancienne et Moderne, and published by Langlume in 1845.  It is also at the beginning of the more-modern heyday for publishing maps and charts such as these.  (The practice began modestly at the end of the 18th century, came into a high tide in the 1850’s/1860’s or so, and then pretty much disappeared by the 1880’s.) 

     There’s a lot of comparatively-displayed information presented on 88 square inches, including the lengths of 30 rivers and the heights of about 500 mountain peaks distributed over Africa, Europe, Asia, Oceania, and the Americas.  And for as much imagery and data there is on this sheet, the whole is very nicely designed, a real success in the display of quantitative data.  

  • Paper Love–Moveable Paper Prints: the Protos Automobile, 1925

    JF Ptak Science Books  Quick Post

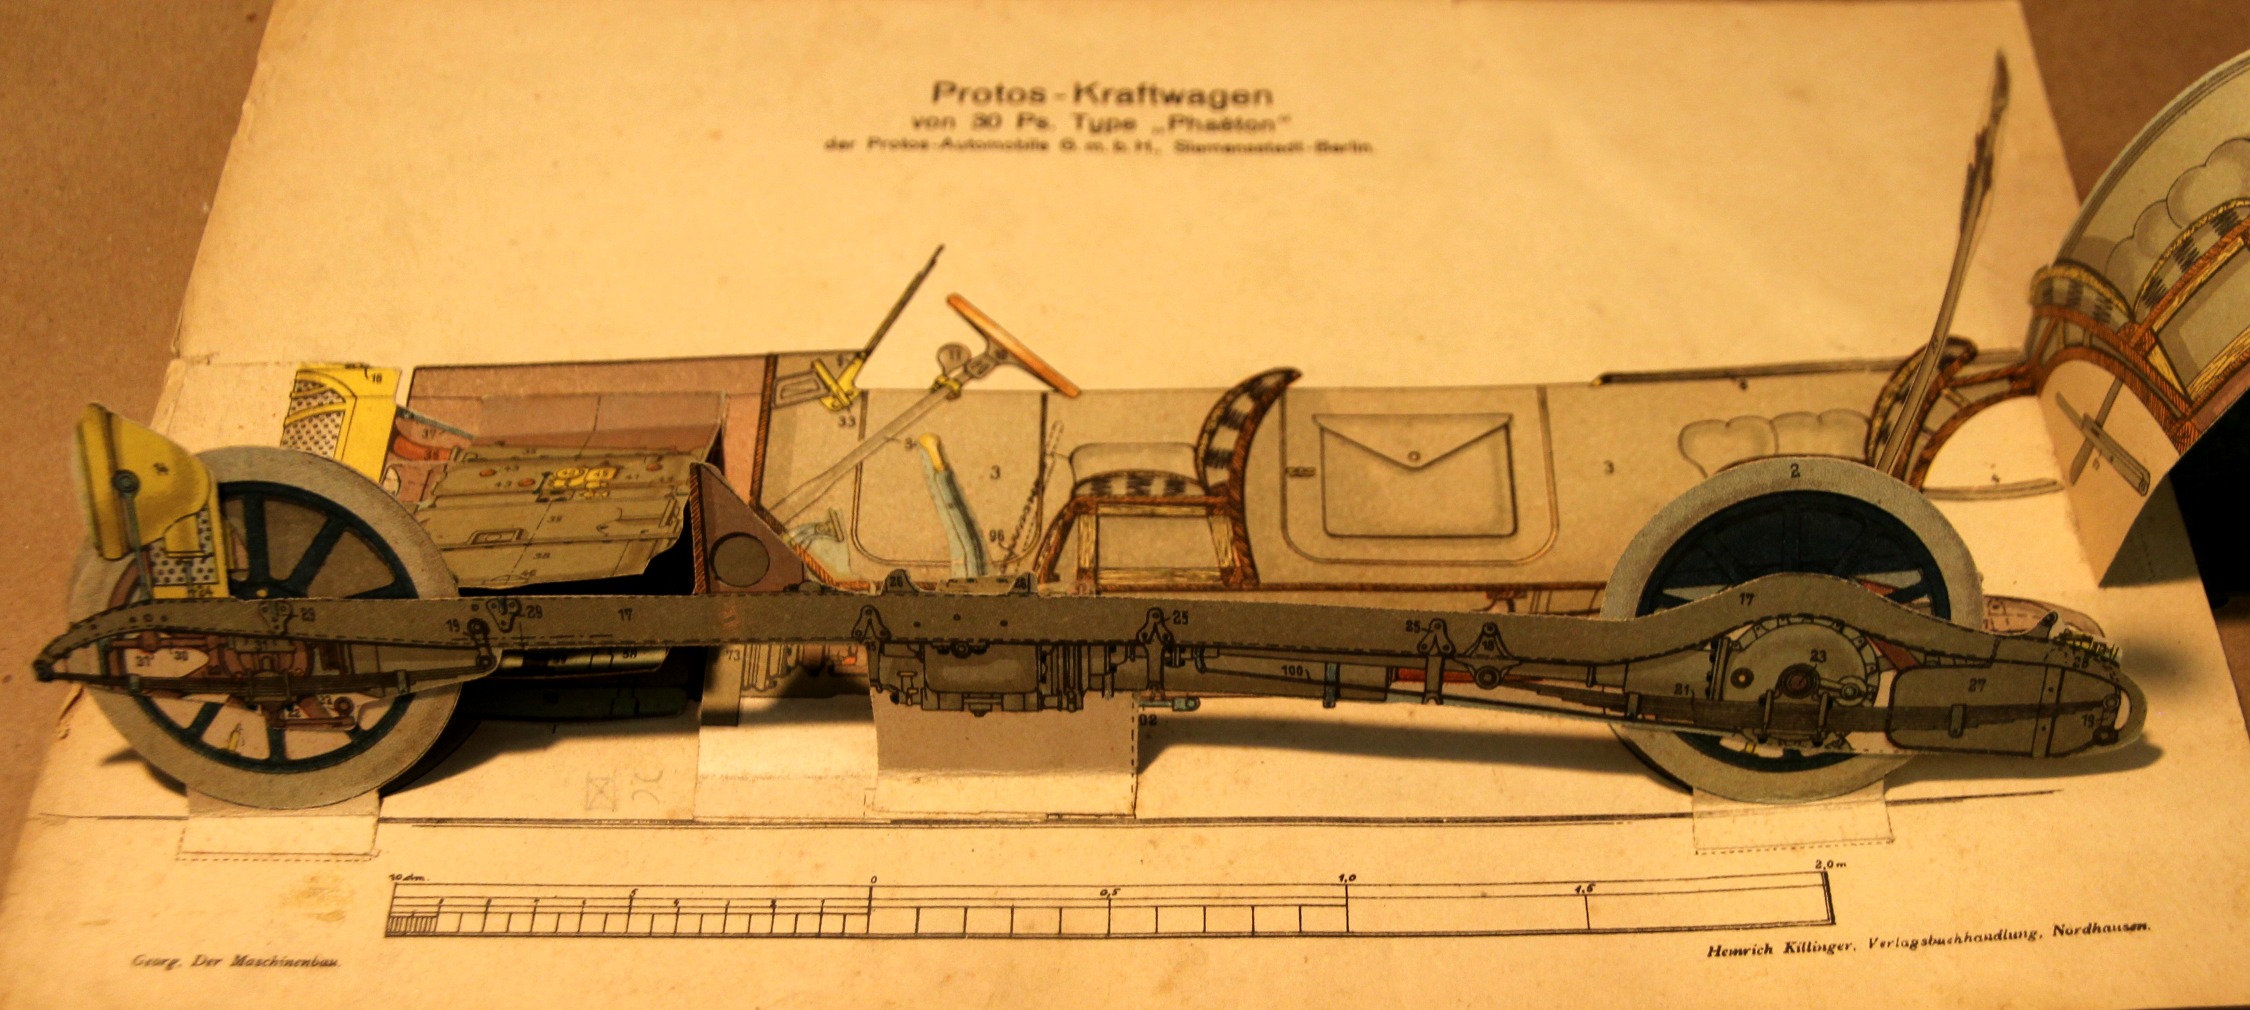
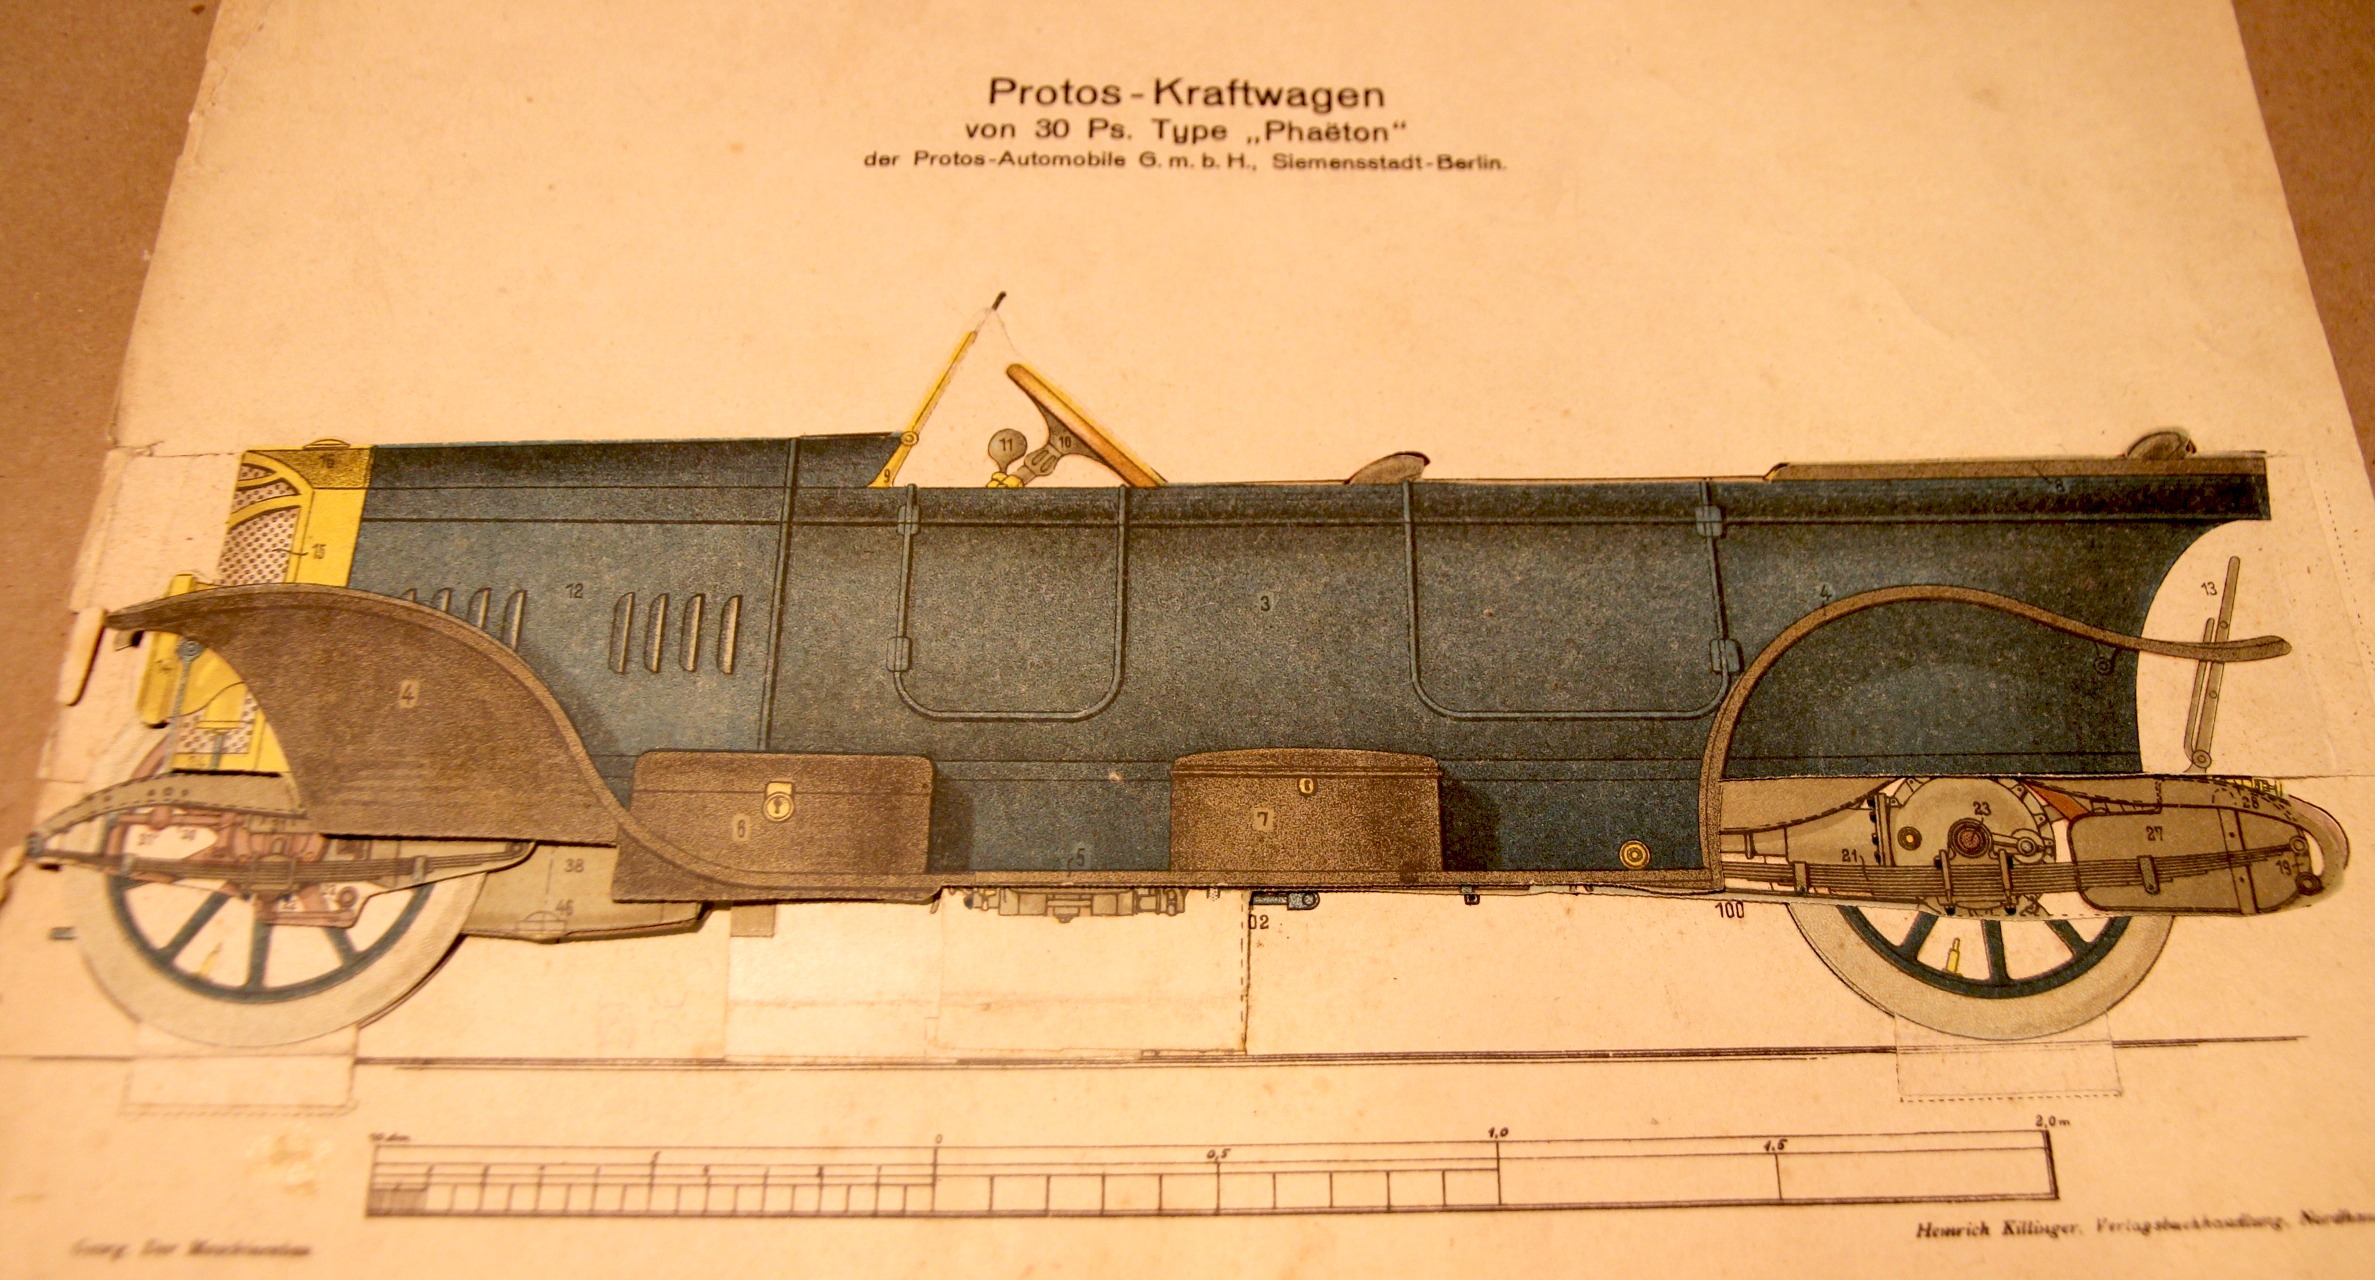
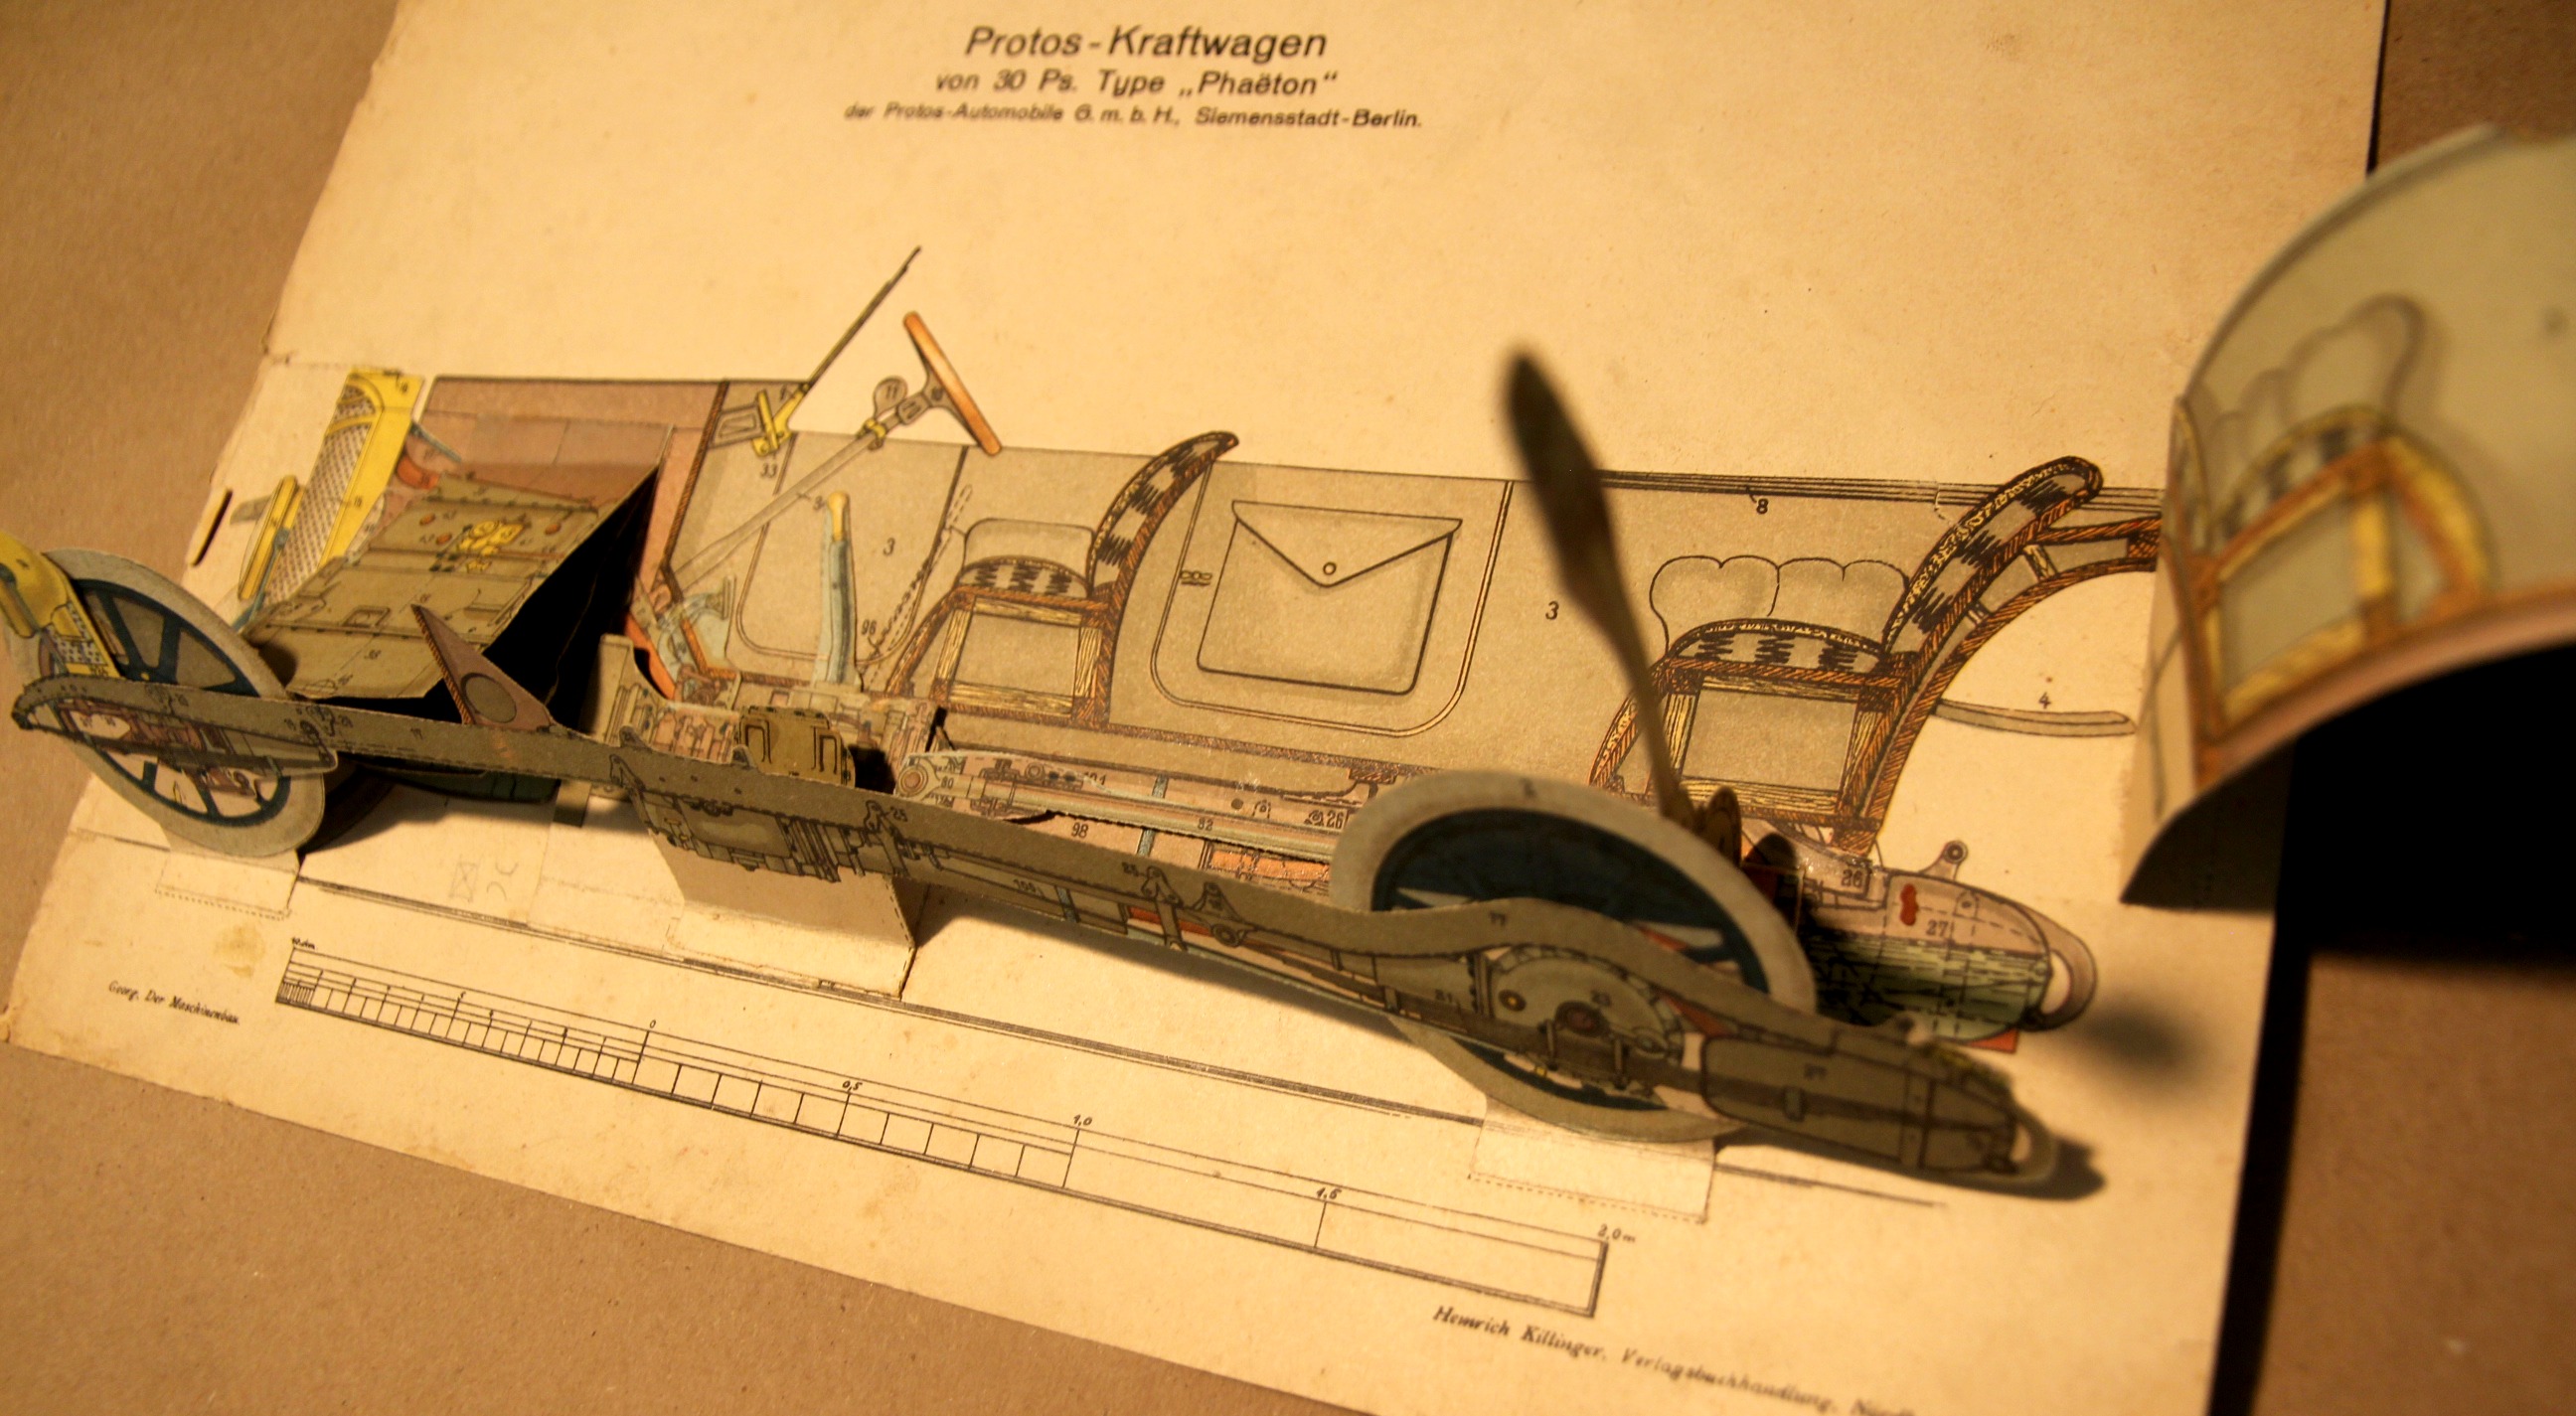
    The moveable book (flapbook) has long been interesting to me–unfortunate though that in my own fields they weren’t used very often. There are some very notable exceptions–early geometries would occasionally be published with many of the geometric illustrations made to pull out a little with the tug of a string to show you the construction in 3-D. Then of course there are the paper dissection manikins, where you can find nearly-life-sized paper anatomies with hundreds of movable/liftable flaps, and smaller examples of the body and specific organs that can be simple or not simple whatsoever.  These were time-intensive efforts, and in their own way they provided a sort of pre-MRI MRI by revealing the various layers of 3-D objects with 2-D tools–and they’re beautiful and captivating objects.

    (And this example is for sale at the blog bookstore, here.)

    Moveable_car_3

    This plate appears in Der Maschinenbau. Modelle.Zeichenerklärungen zu den Modellen des Werkes, by R. Georg, printed by Heinrich Killinger in Nordhausen in 1925.  The major detraction here is an old 5-inch tear that has been repaired verso with aacid-free tape, otherwise in nice condition. 

    The full image, “unmoved”:

    Moveable_car

    Moveable_car_2_

Recent Posts

Archives

Categories