A Daily History of Holes, Dots, Lines, Science, History, Math, Physics, Art, the Unintentional Absurd, Architecture, Maps, Data Visualization, Blank and Missing Things, and so on. |1.6 million words, 7500 images, 4.9 million hits| Press & appearances in The Times, Le Figaro, Mensa, The Economist, The Guardian, Discovery News, Slate, Le Monde, Sci American Blogs, Le Pont, and many other places… 5000+ total posts since 2008.

Category: Economics

  • History of Lines Department: Supply and Demand (1870)

    JF Ptak Science Books   Quick Post

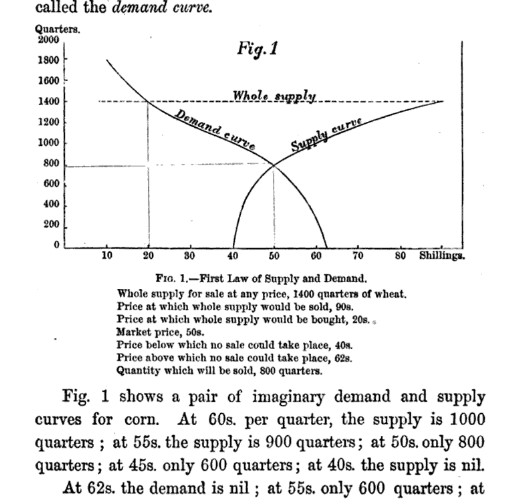
    The idea/phrase “supply and demand” goes back a very long way, and gets treated in a more-modern aspect by Locke (1767) and Adam Smith (1776) and David Ricardo (1813) and Thomas Malthus (1803)–however, the  first time that the idea was presented graphically came with (the beautifully-named) Fleeming Jenkin in 1870. The famous graph appeared in  “Graphic Representation of the Laws of Supply and Demand, their Application to Labour, Part I”, published in Recess Studies, edited by Sir Alexander Grant and published in Edinburgh.  And here it is, in brilliant simplicity:

    Supply and demand

    He writes in this paper by way of introduction:

    “Supply at a price denotes the quantity which at a given price holders would be then and there willing to sell. Supply at a price is also mensurable Demand at a price denotes the quantity which then and there buyers would purchase at that price. The supply at a price and the demand at a price in any given market will probably vary with the price they may be said to be functions of the price.”

    “Let a curve be drawn the abscissae of which represent prices and the ordinates the supplies at each price. This curve will be called the supply curve. A similar curve constructed with the demand at each price as ordinates will be called the demand curve.”

    A few notes in support of the Jenkin diagram:


  • Octopusiana: the Failure of the Bank of the United States (the White House copy) 1931

    JF Ptak Science Books  Quick Post

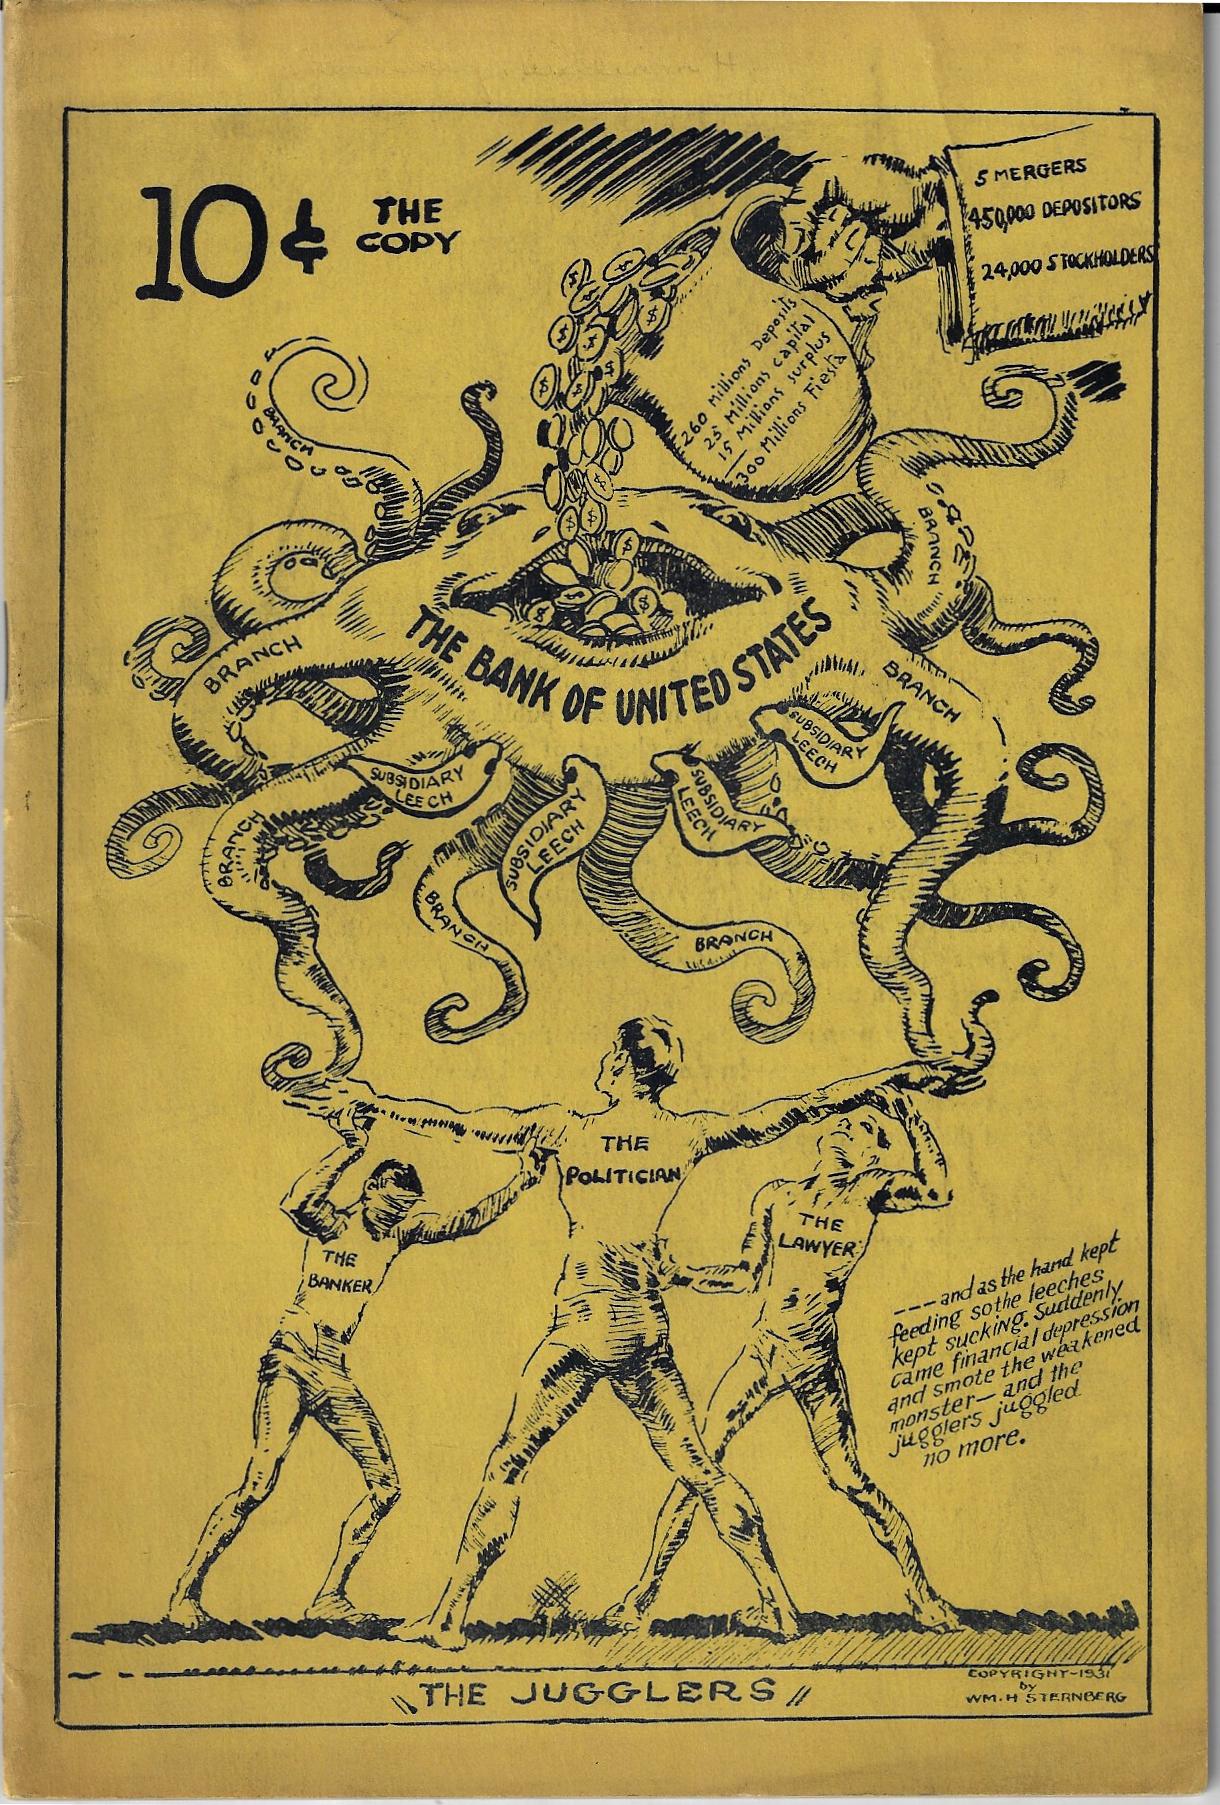
    Book cover octopus bankWilliam Sternberg.  Finis. The Bank of the United States, 1913-1930.  No publisher or place of publication listed, though copyrighted by William H. Sternberg, 1931, and “distributed ” by National Distributors. 23×15.5cm, 40pp. Highly decorated cover. Original wrappers.  Provenance:  the White House, and then the Library of Congress (stamped “by transfer/The White House, Jul 29 1931”. Very Good copy, with the LC surplus/duplicate stamp on rear cover, and a 6mm perforated “LC” stamp at the very bottom of the title page.  

    I was about to say that not many books have started their lives with the word “Finis” starting the title–a quick check in WorldCat has proved this wrong, as there at least hundreds of books with this word in the title. 

    The cover art–perhaps by Sternberg?–is very striking, and as with lots of political art, could be understood without having to read it, a glancing view being pretty much enough to tell the story.  The image features the Bank of the United States as a sort of 16-legged octopus, being fed money food from a merger/depositor pitcher, underneath which and perhaps keeping the whole thing afloat are a banker, lawyer, and politician. Sternberg evidently didn’t think much of the BOUS’ many acquisitions/mergers since it went into business in 1913, being particularly upset with the late 1920’s movements. Anyway this is a pretty screedy diatribe, though it also seems to be an informed one. 

    A Series of Unfortunate Events led to an infamous run on the BOUS’ Bronx branch, with 25,000 people showing up and wanting their deposits, all of which fed into the making of the Great Depression. The bank did not do well after the run.  

    ·Posted by :

    ·in:

    —

  • Window Shopping for Food and Haircuts with Berenice Abbott, 1935

    JF Ptak Science Books  Blog Bookstore

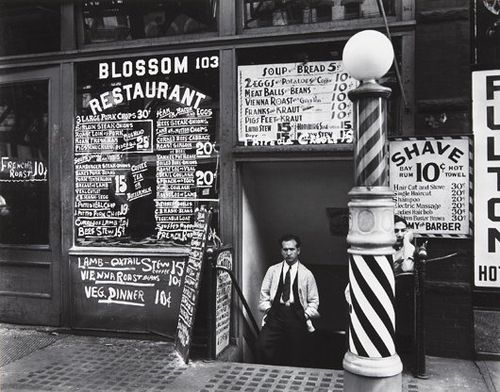
    I enjoy antiquarian window shopping, browsing photos or engravings that depict goods for sale– especially if the prices are posted. I came back to this deep-in-the-Depression-fantastic photo made in 1935 by Berenice Abbott (Springfield, Ohio, 1898-1991). Blossom Restaurant, NYC was part of Abbott’s effort funded by the WPA, this time as a part of her Changing New York Project, and captures the restaurant and neighboring barber shop at 103 Bowery.  The two businesses actually occupied the first floors and basement (respectively) of the Boston Hotel, a standard flop house in a tough and distressed part of the city that rented beds by the day, with 249 small door-less cubicles offering a decent place to spend the night for 30 cents1. 
    Abbott[Image source: New York Public Library, http://digitalcollections.nypl.org/items/510d47d9-4f80-a3d9-e040-e00a18064a99   Also a nice description of the photo and process can be found at the National Museum of American History, http://americanhistory.si.edu/collections/search/object/nmah_1321971]
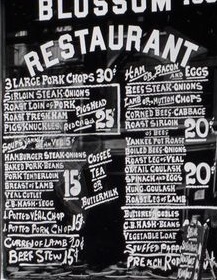
    Abbott Blossom restaurant menu detail

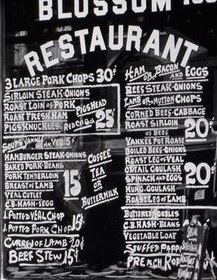
    30 cents seems to be the going rate for a bunch of things going on in this  picture—30 cents for a night in the hotel, 30 cents for the better offers of Morris Gordon’s restaurant. 30 cents for a haircut and shave, 30 cents for a “women’s hair bob”2 and so on.  Which seems about right—a fancy haircut and a decent better-than-average dinner for two will probably cost about the same, today. 

    If you were really on a tight budget, 30 cents would buy you three vegetarian dinners, or 6 offerings of bread and soup, or three visits to the table of meatballs and bans, or pigs feet and kraut. 

    The price of a stick-to-your-ribs meal of sirloin and potatoes and a pot of coffee also cost about the same as a gallon and a half of gasoline (which cost about 20 cents).  The same amount of gas today would get you a serving at McDonalds, or something on that order, and perhaps even a happy take-away for the kids. Perhaps the two even out. 

    30 cents might get you a loaf of bread, and wouldn’t quite get you a dozen eggs.  Now this is remarkable, because if you adjust all of this according to modest CPI measures, the average cost of a dozen eggs in 1935 was 37 cents, or (according to the US Census website generating 1935 to 2009 prices adjusting to CPI) $5.84.  The bread would cost $4.74 in 2009 dollars, which means that the staples today—milk, bread, butter, eggs, were more expensive in 1935 than today.  Ditto gasoline, which cost 19 cents a gallon, or $3 today—actually this would be much more expensive in 1935 as the mileage the cars were getting then (and the octane) was much lower, so the cost of running an automobile was considerably higher.   The cost of the car itself, though, still favors the ‘thirties for modest transportation, which came in at about 600 dollars, or just over $9000 in 2009 dollars3. 

    The 3-cent first class postage stamp of 1935 was more expensive than first class postage in 2009:  47 cents versus 44.  When you look at the increases and bitty spikes of the cost of a first class stamp over time the whole thing looks pretty flat. 

    The average salary for a family of four in 1935 was about 1500/year, which oddly enough is about the same for the poverty guideline level for 2009 established by the Department of Health and Human Services (about $23,000).  Minimum wage legislation didn’t begin until 1938, but if you take a look at one of my earlier posts here on the history of this idea you’ll see that the recent history of legislating  a meaningful level of acceptance for a base living wage is mainly disgraceful, with relatively little accomplished (in adjusted economic terms) for half a century.  (The new minimum wage brings us to about a mid-way point as the highest minimum wages paid in the 76-year history of the program.)

    Notes

    1.A fantastic website and resource for changing aspects of NYC can be found here, at Frank Levere’s Changing New York site. http://www.newyorkchanging.com/

    2. I wrote a little bit about the appearance of women-only hair salons in my post “The Staggering Beauty of Barber Shops” https://historyofideasblog.com/thesciencebookstore/2009/02/the-staggering-beauty-of-barber-shops-naive-surreal-department-22.htm

    3. Other bits of what stuff cost in 1935:

    • Flour (5 lbs)     25.3 cents
    • Bread (lb)         8.3
    • Round steak (lb)  36.0
    • Bacon (lb)        41.3
    • Butter (lb)       36.0
    • Eggs (doz.) 37.6
    • Milk (1/2 gal.)   23.4
    • Oranges (doz.)    22.0
    • Potatoes (10 lbs) 19.1
    • Coffee (lb)       25.7
    • Sugar (5 lbs)     28.2
    • Car: $580
    • Gasoline: 19 cents/gal
    • House: $6,300
    • Bread: 8 cents/loaf
    • Milk: 47 cents/gal
    • Postage Stamp: 3 cents


    And 103 Bowery, today (via Google Earth):

    103 Bowery


  • The Somerset Coal Strike, 1922/3

    JF Ptak Science Books   Quick Post     History of Lines series: Strike Lines

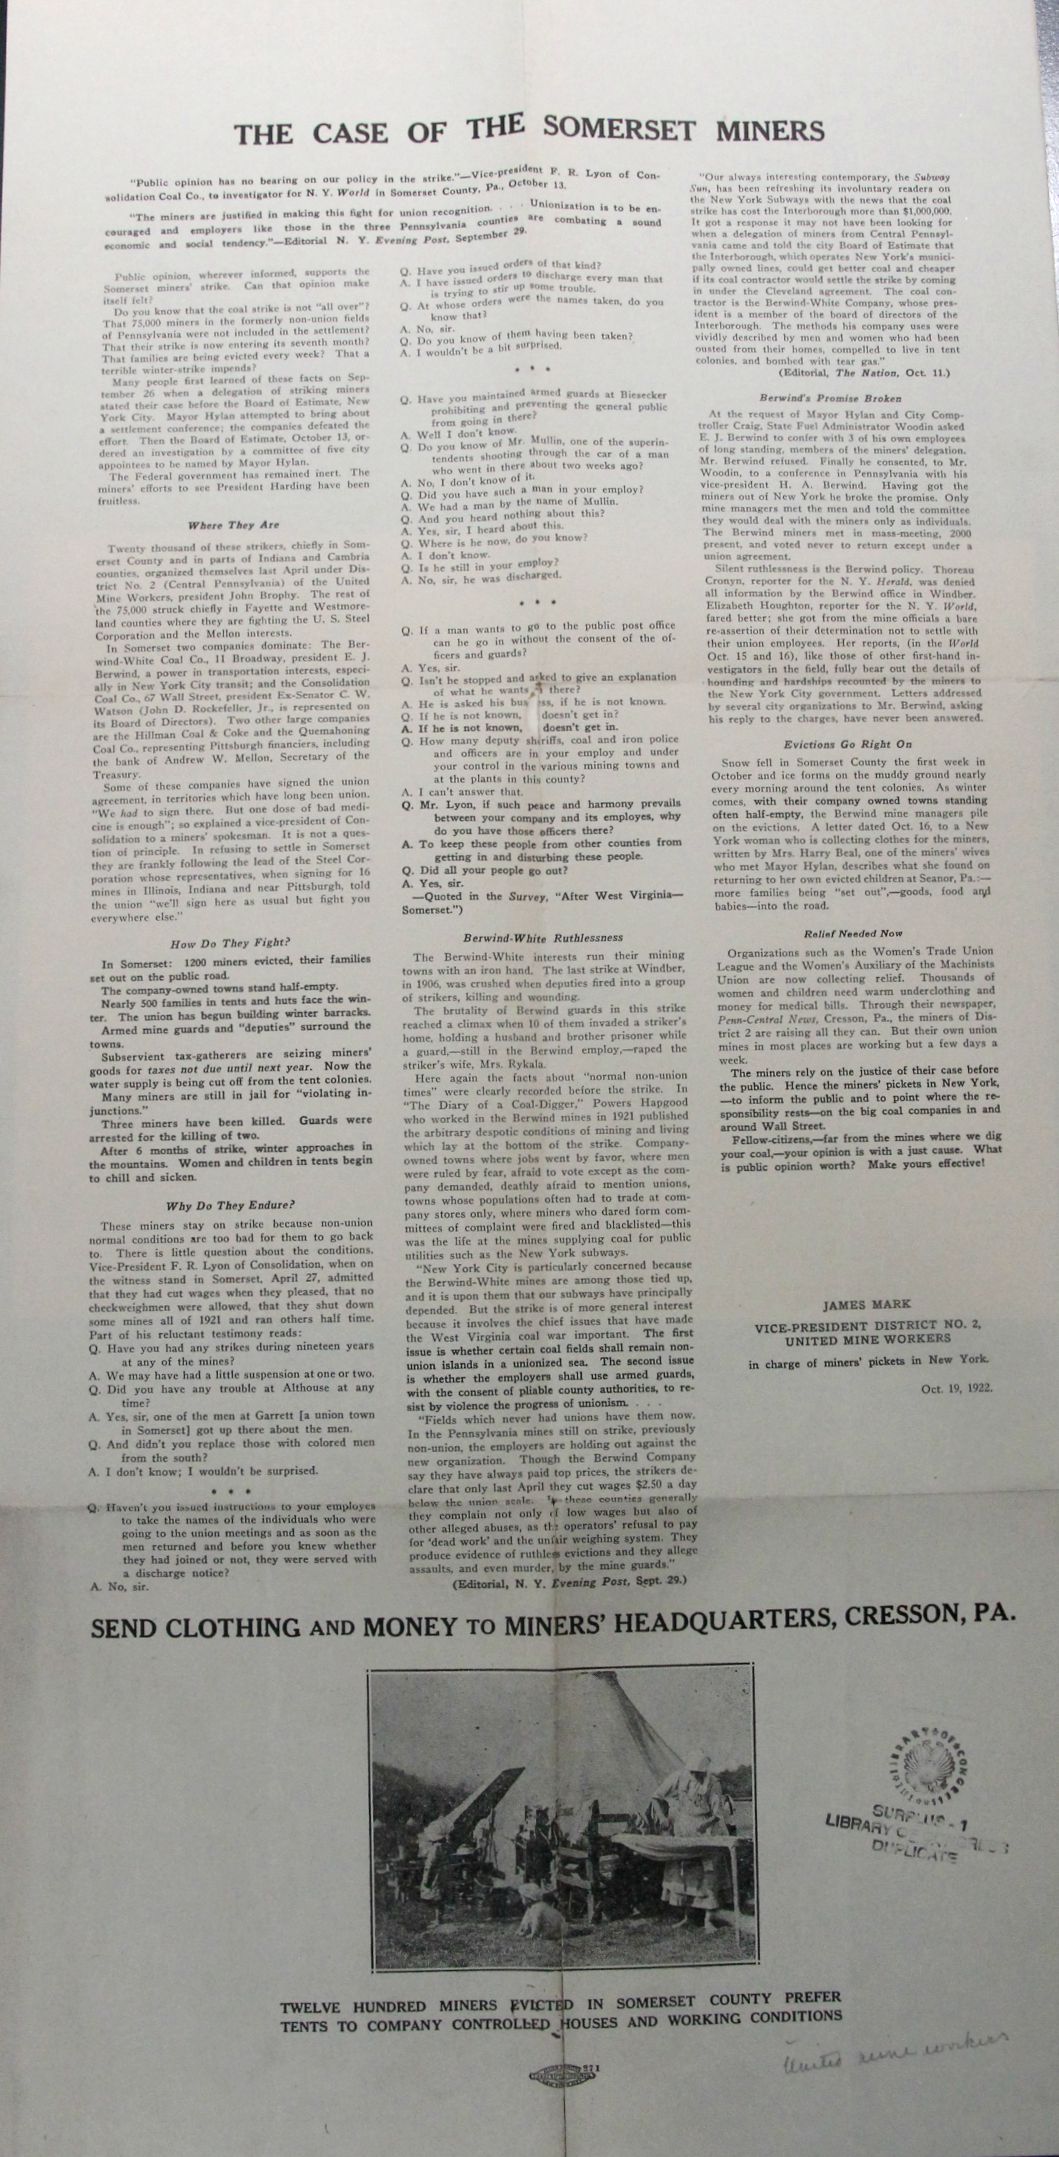
    This is a rare broadside (about 24″ tall) seeking household items and money for the relief of the striking workers of the hard/tough/brutal Somerset Mine strike of 1922-3.  The miners struck for union representation from the United Mine Workers against the Berwind-White Company, which ran a very tight ship, evidently. The miners for Somerset lived in a classical company-town existence, with their pay being mostly entirely absorbed by the company via rent for company-owned houses, stores, food, water, and so on, all aspects of life controlled by the employer who/which retrieved the salary of its underpaid workers by controlling all aspects of the workers’ lives. So the miners struck for representation from the union for more money and management resisted, especially since it would cost them profit during a year that saw coal production falling by a third.  So the strike began and lasted from 1922 to 1923, during which Berwind-White employed scabs and security and thugs to intimidate and control their workers, evicting 1200, sending hundreds of families into a Pennsylvania tent life for the winter, stopping the flow of water, and general thuggery.  The strike ended unsuccessfully in 1923, though the union came in by 1933. 

    Reading this summation and plea is a heartbreaker, and will no doubt make a person appreciate the idea of unions, especially in the U.S.A. of the 1920’s/1930’s.  


    Coal strike somerset

    ·Posted by :

    ·in:

    —

  • “Sabotage”, the Wobblies, and the Illusion of Property (1913)

    JF Ptak Science Books  Post 2392

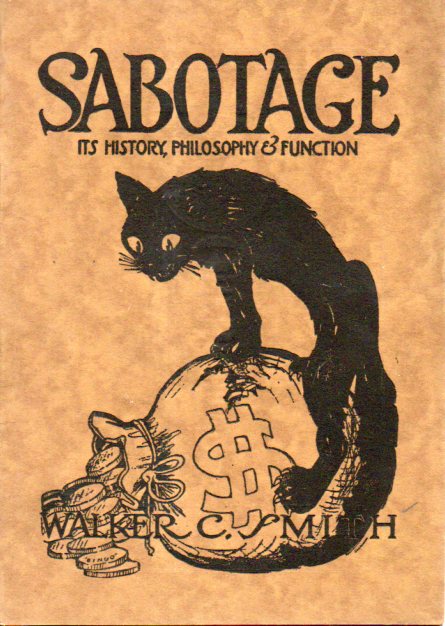
    “The object of this work is to awaken the producers  to a consciousness of their industrial power. It is dedicated, not to those who advocate but to those who use sabotage.”–Walker C. Smith, in the second of his miniature two-paragraph foreword in Sabotage (1917 edition)

    Sabotage608

    [The original pamphlet is available from this blog’s bookstore, here.]

    Walker Conger Smith (born 1885 on the same day that Babe Ruth and Elvis Pressley died in later years) was a hard line political seer, a magical agitator and writer for the Wobblies, officially known as the Industrial Workers of the World (and the I.W.W.)  He lived a busy 41 years, and in his time raised a lot of attention to the IWW’s Socialist vehemently pro-Union organizing, during a time (1910-1927 or so) when big business would respond with their won police/strikebreakers/armies to disrupt and dispel (and trounce) strikers and strikes. 

    One of Walker’s best known works was Sabotage, its History, Philosophy & Function. First published in 1913 and then widely reprinted, it made the case for poor pay for poor work, and that in the long run the wealth produced by the workers belonged to them, and so work slowdowns and then destruction of the means of production was well within the rights of the wronger worker. 

    The pamphlet certainly found a readers–on both sides of the issue. It was regularly used in legal actions against Unions as proof of their criminal syndicationism and of organized destruction of business/factory property.  

    The pamphlet ends with these very strong statements:

    “Its [Sabotage’s] advocacy and use help to destroy the property illusion”…

    “Is the machine more than its makers? Sabotage says “No!”

    “Is the product greater than the producers? Sabotage says “No!”

    “Sabotage places human life–and especially the life of the only useful class–higher than all else in the universe.”

    ….”For Sabotage or for slavery? Which?”

    The pamphlet ends with a salutation from Jack London:

    “Dear Comrade Smith:

    Just a line to tell you that I have finished reading your pamphlet SABOTAGE. I do not find a point in it on which I disagree with you. It strikes me as a straight-from-the-shoulder, clear, convincing, revolutionary statement of the meaning and significance of sabotage.

    Yours for the revolution,

    Jack London”


    Full text here.

    The IWW website identifies this printing as 1917.  http://www.iww.org/sr/history/library/WCSmith/sabotage


  • An American Exodus

    JF Ptak Science Books  Post 2244

    LAnge migrant detail

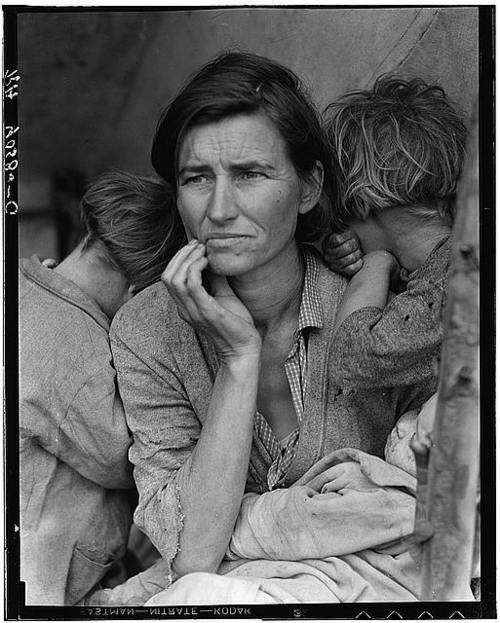
    Everyone knows this image: the Madonna of the American 1930’s, the Migrant Mother, a photograph made by Dorothea Lange, a photographer for the Federally-funded Farm Security Administration. Lange was still very new to the FSA project when she made this photograph in the spring of 1936. On the tail end of a month-long road trip she was nearing the end of her day when she spotted a hand-lettered sign “Pea-Pickers Camp” by the side of the road. Lange briefly considered stopping but went ahead, questioning her judgment continuously for the next 20 miles, when she finally turned around to find the turn-off for the camp. She drove down the dirt road and found a ramshackle assembly of tents, one of which contained “an exhausted mother sitting forlornly with her children”. Lange spent only 10 minutes with the woman, making five exposures. She learned that “the crops had frozen, and the woman and children were living on vegetables scavenged from the fields, and the few birds that the children managed to catch. The mother could not leave; she had sold the tires from her car”.  It was published almost immediately and quickly became one of the great iconic images of the Depression, as well as for the American century.  

    Lange migrant mother

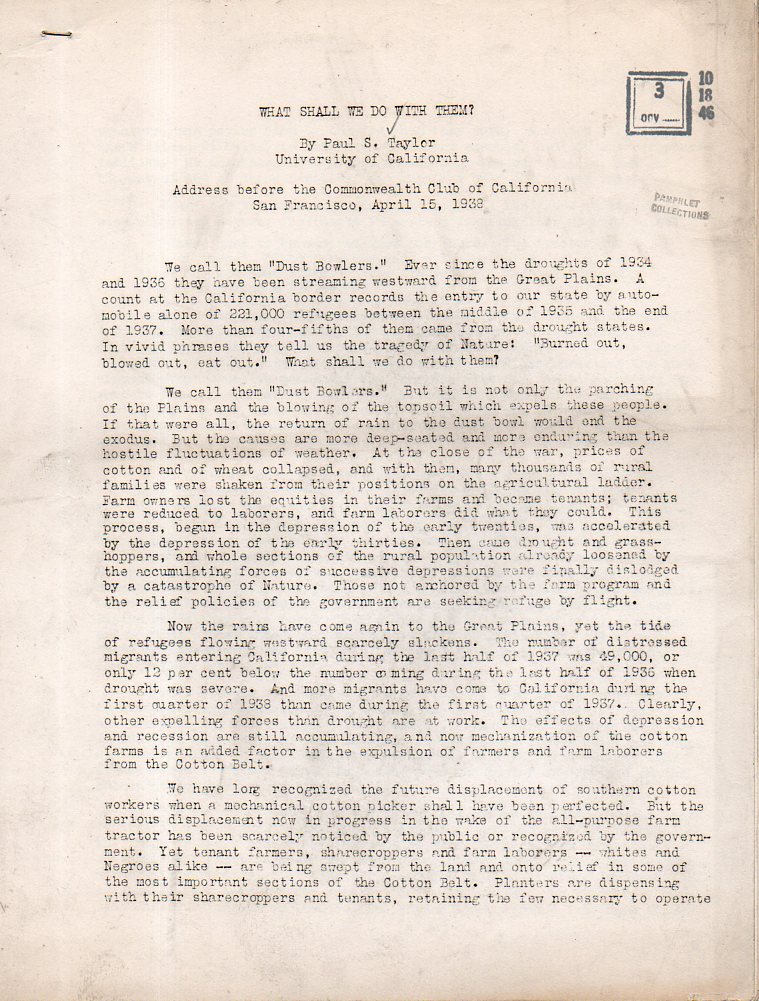
    I was thinking about this because of a typewritte, offset-printed pamphlet I bought written Paul S.Taylor, “What Shall We Do With Them” ( an address before the Commonwealth Club of California, San Francisco, April 15, 1938)–the “Them” being the dustbowler, the migrant workers, the disposed.  Paul Taylor was at this time three years into his marriage with Lange—he was a progressive thinker and a FSA operative who helped Lange land her job and was a part of an extraordinary team of very expansive ability that documented a pivotal period in American life. He was also co-creator with Lange of their great documentarian centerpiece of the 1930’s, An American Exodus, a Record of Human Erosion, which was published in 1939, the same year as the publication of The Grapes of Wrath and the release of the Wizard of Oz and Gone with the Wind. (Two years later–1941–James Agee (text) and Walker Evans (photographs saw their long-developing Let Us Now Praise Famous Men was published.)

    In this pamphlet Taylor gave testimony on migrant workers and nearly the height of the Depression—he was an expert, having traveled and lived among them and written academic papers on what he found. He outlined possible answers to the question, which had mainly to do with stability, which of course was the primary concern for the many of thousands of individuals and families who were once-stable but now very mobile, not having place to live or places to go. Taylor thought that opening dams and supplying irrigation and affordable government-owned houses would be the first of many steps to take to relieve the widespread suffering.  In all of the alphabet-soup programs uundertaken by the Roosevelt administration, none were nearly as “successful” in ending the national social erosion as the events that were to unfold less than a year later.

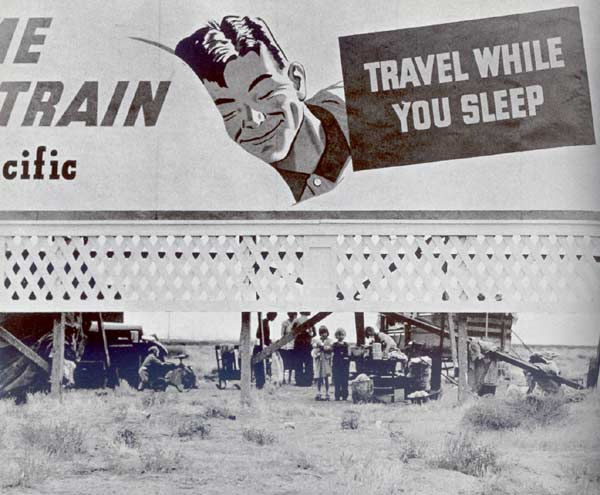
    Lange travel sleep

    Dorothea Lange “Three Families, 14 Children” US 99 San Joaquin Valley, California, November 1938. An American Exodus

    Taylor dustbowl092

    Notes:

    Lange describes her encounter with the Migrant Mother as follows:

    “I saw and approached the hungry and desperate mother, as if drawn by a magnet. I do not remember how I explained my presence or my camera to her, but I do remember she asked me no questions. I made five exposures, working closer and closer from the same direction. I did not ask her name or her history. She told me her age, that she was thirty-two. She said that they had been living on frozen vegetables from the surrounding fields, and birds that the children killed. She had just sold the tires from her car to buy food. There she sat in that lean- to tent with her children huddled around her, and seemed to know that my pictures might help her, and so she helped me. There was a sort of equality about it”. (From: Popular Photography, Feb. 1960).


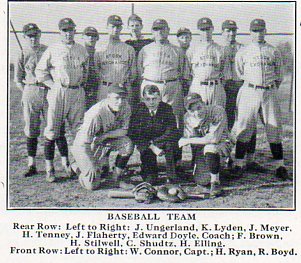
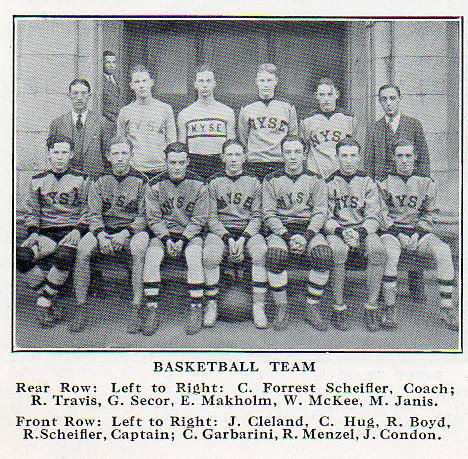
  • Baseball and the Rifle Team at the NYSE, 1927

    JF Ptak Science Books  Post 1377

    NYSE bb107

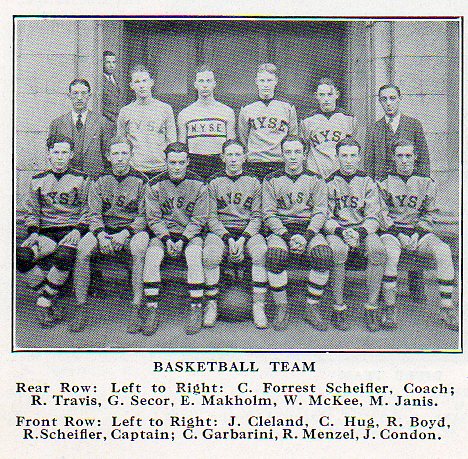
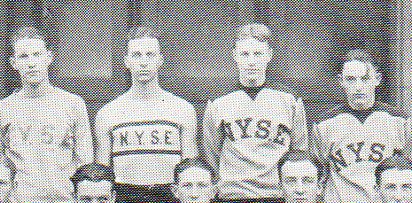
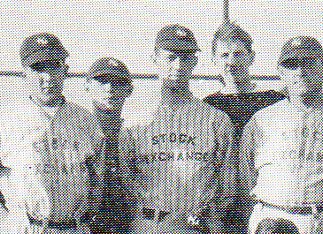
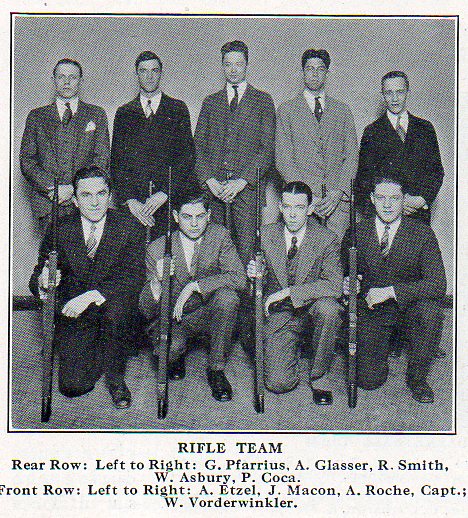
    Is there nothing else that shouts out $15 trillion market cap than this NYSE basketball team?  Well, probably.  These photos appear in a New York Stock Exchange personnel department publication for 1927, and as the HR -arm of the Exchange,  devoted itself to all things necessary to the average employee of the 1300-person entity.  The NYSE seemed to be fairly well involved with the health and free-time status of its workers, reporting on programs for self-betterment, general reading, health care, health insurance, savings and spending, training, “mental guidance”, retirement plan (singular), and so on.  These photos come from the “Employee and His Play” section, and discusses the achievements of the many sports teams hosted by the Exchange. 

    NYSE bb106

    NYSE bb105

    NYSE bb108
    NYSE bb104


  • 1 Inch=$370 Million: a Great Height of Graphical Representation of Quantitative Data

    JF Ptak Science Books  Post 1227

    0 ebay 13 graphs268[Click image to enlarge; both original images are available for purchase from our blog bookstore.]

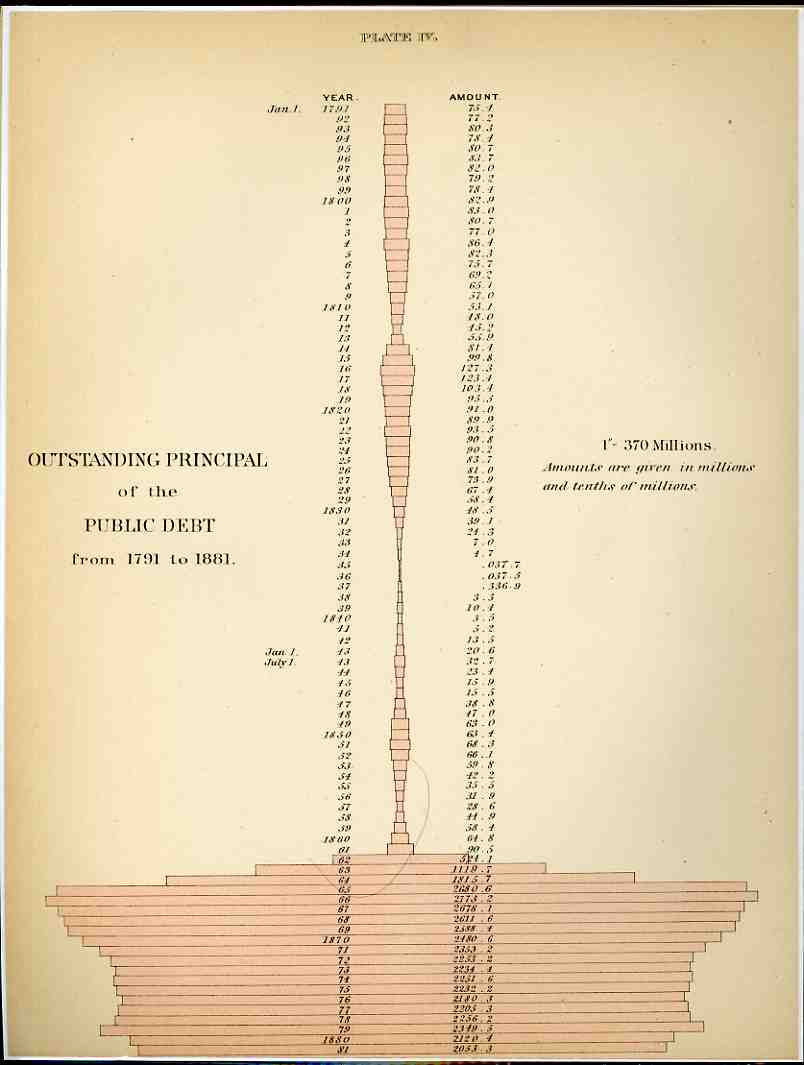
     It isn’t often that you see money represented by dry measure, but that’s what happened here in these two examples from the fantastic Walker Statistical Atlas ( Statistical Atlas of the United States based on the results of the tenth census 1880 with contributions from many eminent men of science and several departments of the government Comp. under the authority of Congress by Francis A. Walker, M. A., superintedent of the tenth census … and published in 1884).  What we see here is a history of American federal indebtedness from 1791 (when the public debt stood at 75.1 million dollars) to 1881 (about 2 billion).  Using the CPI (consumer price index) as a factor to translate that number in 2008 dollars (or so), the 2 bil grows to about $40 billion (a nickel then is about a dollar now). The interesting part of the legend–and what drew me to this graphic even before its somewhat unique shape–state “1”–370 millions”, that is one inch of pink horizontal bar stands for about $370,000,000, and the last bar on this graph is about 6 inches long, which, adjusted for inflation, would now be about 10 feet long. .That said, the really interesting part comes next–if we use this measure to graph a horizontal bar for the American debt as it stands in 2008, it would pink a pink bar that was about a HALF MILE long to express our 10(+) trillion dollars of debt.  OR, somehow, the old debt of 1881 would be about 1 story of a house, while the 2008 version would be up one side of the Empire State Building and down the other (and yes that includes the aerials).  I don’t know how to put this comparison in context, the differences are so staggering. 

    0 ebay 13 graphs269
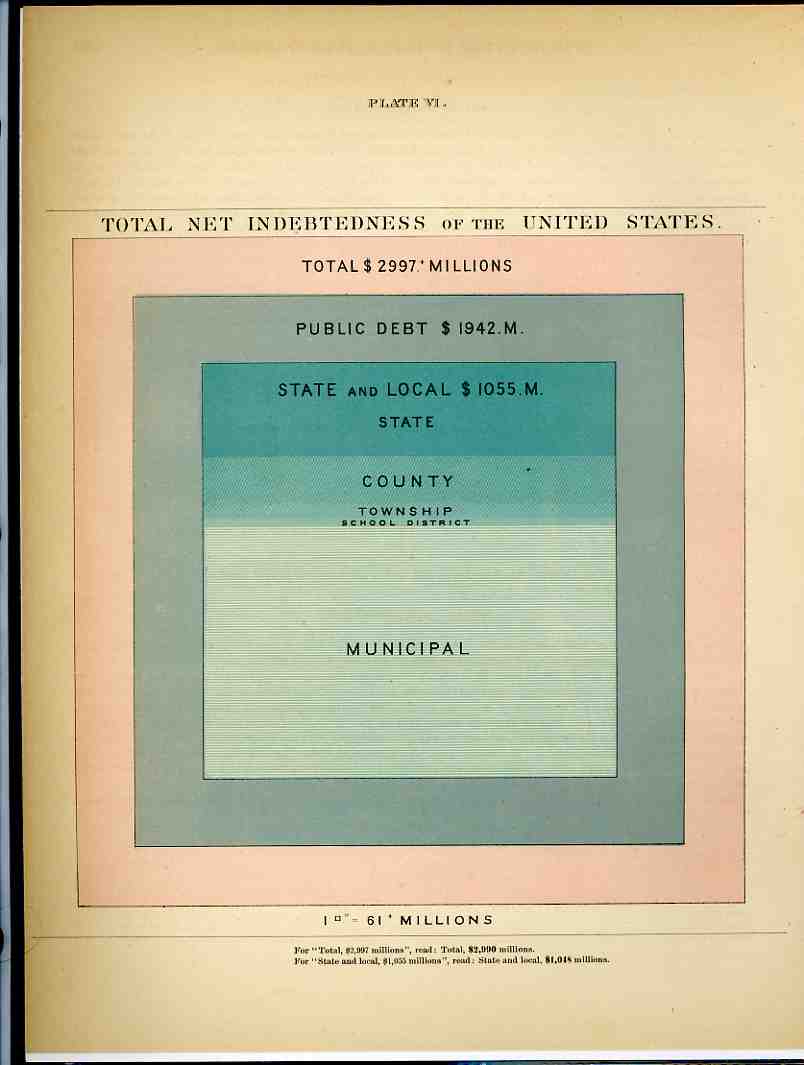
    After having popped a neuron or two trying to get my head around that one, we’ll further confuse the situation with the second chart, which shows the total net indebtedness of the U.S. in 1881 in terms of square inches; or, at the bottom of it all, a 7×7 inch square represented the entirety of the $3 billion owed out.  49 square inches. Working backwards this time, our $10 trillion (or $10,000,000,000,000.00 writ large) adjusted back to a CPI value in 1881 would have covered about 88 PAGES of the atlas or 9,000 square inches.  Again, the numbers are just almost too big to mean anything. 

    We, as a country, owe one hell of a lot of money.

    And yes there are many different ways of trying to figure out what one 1881 dollar “means” in terms of 2008, but the CPI is the most simple to use and least argumentative and at least gives a pretty good idea of scale.  It would be more useful to try and establish the degree of difficulty  of turning the corner on the debt in 1881 compared to doing that today, but this is just a late-night post at the end of the week, and I don’t have a good clue about how to try and measure that bit simply.