JF Ptak Science Books Quick Post
The idea/phrase “supply and demand” goes back a very long way, and gets treated in a more-modern aspect by Locke (1767) and Adam Smith (1776) and David Ricardo (1813) and Thomas Malthus (1803)–however, the first time that the idea was presented graphically came with (the beautifully-named) Fleeming Jenkin in 1870. The famous graph appeared in “Graphic Representation of the Laws of Supply and Demand, their Application to Labour, Part I”, published in Recess Studies, edited by Sir Alexander Grant and published in Edinburgh. And here it is, in brilliant simplicity:
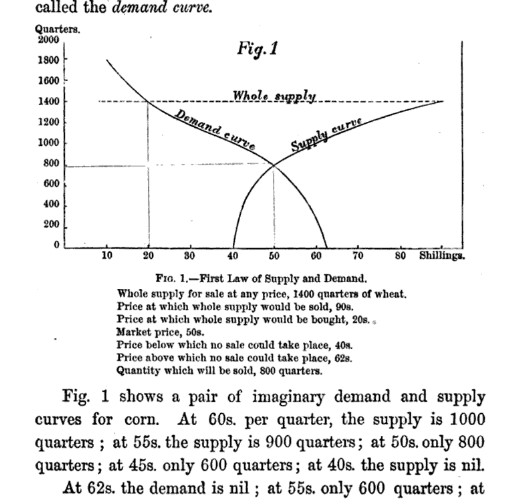
He writes in this paper by way of introduction:
“Supply at a price denotes the quantity which at a given price holders would be then and there willing to sell. Supply at a price is also mensurable Demand at a price denotes the quantity which then and there buyers would purchase at that price. The supply at a price and the demand at a price in any given market will probably vary with the price they may be said to be functions of the price.”
“Let a curve be drawn the abscissae of which represent prices and the ordinates the supplies at each price. This curve will be called the supply curve. A similar curve constructed with the demand at each price as ordinates will be called the demand curve.”
A few notes in support of the Jenkin diagram: