A Daily History of Holes, Dots, Lines, Science, History, Math, Physics, Art, the Unintentional Absurd, Architecture, Maps, Data Visualization, Blank and Missing Things, and so on. |1.6 million words, 7500 images, 4.9 million hits| Press & appearances in The Times, Le Figaro, Mensa, The Economist, The Guardian, Discovery News, Slate, Le Monde, Sci American Blogs, Le Pont, and many other places… 5000+ total posts since 2008.

Category: Statistics–Fossil, Found, Odd, Forgotten

  • Beer Vs. Wine, 1828

    JF Ptak Science Books  Quick Post

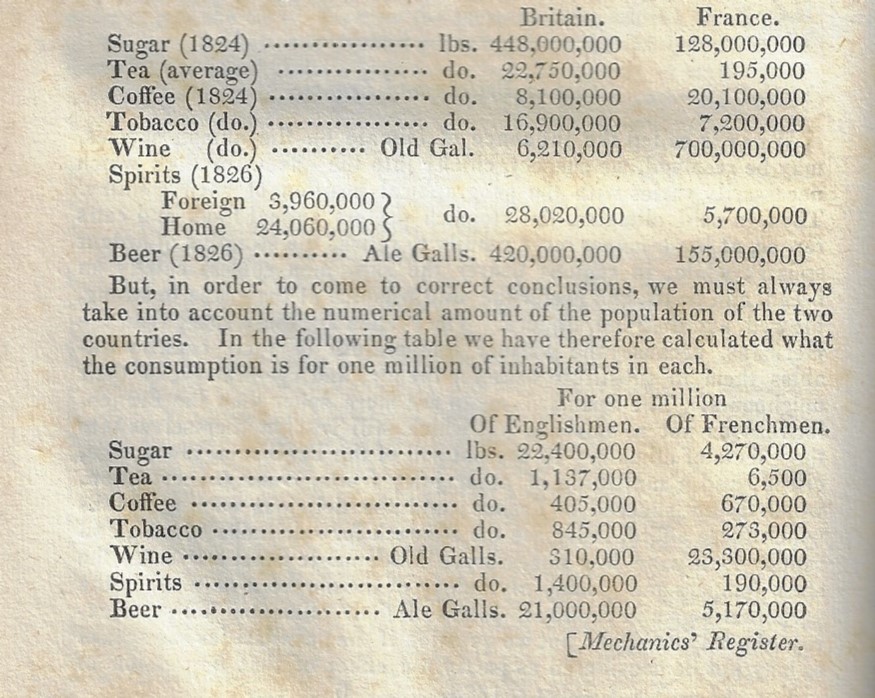
    Here we go: I found this fascinating little table in the article “Diet in England and France” in the Journal of the Franklin Institute for July, 1828. I think that the table displays what seems to be common knowledge about consumption in the two cultures, though it also provides some interesting numbers (“compiled from authentic documents”) to back everything up.  The first section displays gross numbers, while the second breaks it down to consumption in terms of per capita. The Brits drink far less wine than the French, though the French drink even less (by an order of magnitude) of tea than the Brits. 

     JFI 1828 Diet


  • Ngrams: A Surprise with Two Words Unexpectedly Coming Together: “Bible” and “Television”.

    JF Ptak Science Books   Quick Post 

    I’m having a little fun with the Google Ngram viewer–you can too!

    • (https://books.google.com/ngrams/graph?content=&year_start=2000&year_end=2012&corpus=15&smoothing=3&share=&direct_url=) which if you look for the most recent date will default to 2008 and has a limit of 12 variables.

    I’ll just let these graphs speak for themselves. In the first graph I tried to beat “Frankenstein” with something popular but had a hard time, not finding anything (though just over a short period of time) but being very happy overall with the results. In the next graph I was mainly interested to see the difference in the use of “World War II”, “Second World War”, and “World War Two”, and then threw in “Bible” and “television”, and found the surprising “singularity” (well, not really). 


  • A Single-Page DSM? (1886)

    JF Ptak Science Books  Quick Post

    Statistics of the insane _1_503


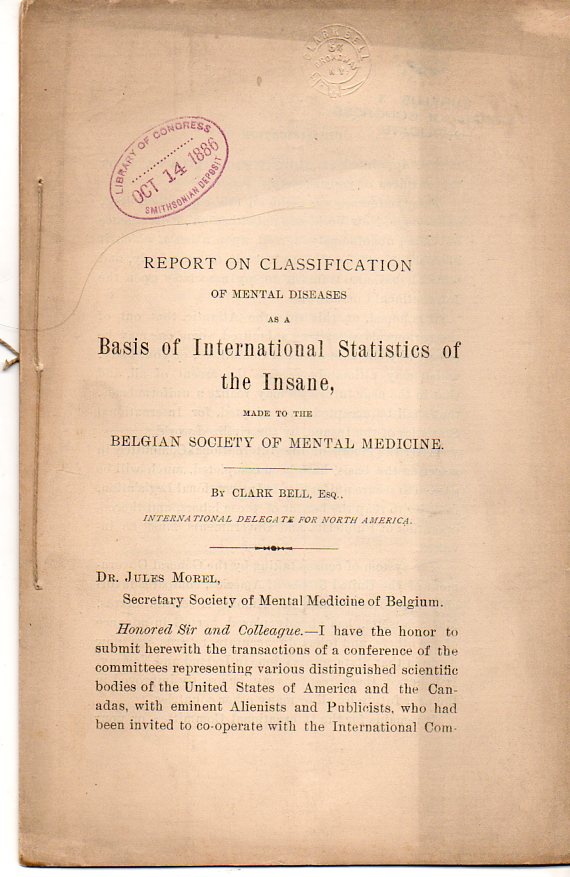
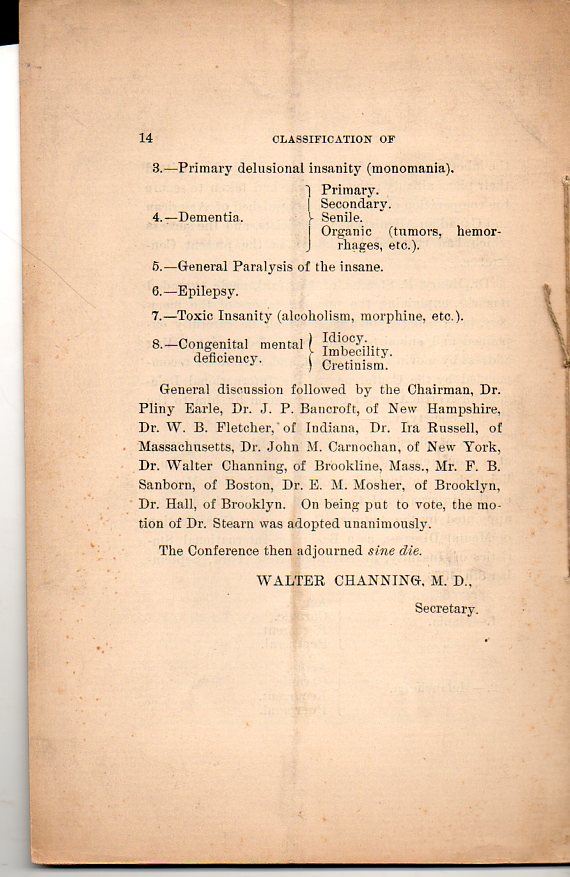
    At the end of the 19th century it was recognized that international data collected on mental illness would be highly useful. Unfortunately there was no real possibility of applying a series of great common denominators to the vast majority of  mental illnesses–the classification of mental diseases lacked general consensus and clarity for not understanding the pathology of the disease, therefore having to fall back on classification according to symptology, which is open to interpretation, and individual experience, and occasional faith, with the apparent mental conditions judged by exterior behavior and appearance. This pamphlet below is the sum of the efforts of international institutions to come up with a plan for this classification that might make disparate data more refined and so more useful to communities around the world.  It seems as though this was done with a simplicity that was also useful, as there was a common language to describe those conditions that are marked for classification.  

    Full text can be viewed of Yale’s copy, here:https://archive.org/details/39002086346195.med.yale.edu   

    Clark Bell. Report on Classification of Mental Diseases as a basis of international statistics of the insane, made to the Belgian Society of Mental Medicine. 23x15cm,  14pp. Wrappers. Provenance: Library of Congress Smithsonian Deposit (received in 1886) from Dr. Bell (with a tiny 1.5cm embossed stamp bearing his name and address at top-center front page).  I suspect that this is a separate printing of this article that appeared the Medico-Legal Journal, volume 4, 1886, as it has the same exact appearance–Bell was also the editor of that journal.  

    And the classifications, which appeared on the last two pages of the document:


    Insanity DSM


    Statistics of the insane _1_504


  • The Distance-to-Hospital Usage Law (1866)

    JF Ptak Science Books  Quick Post


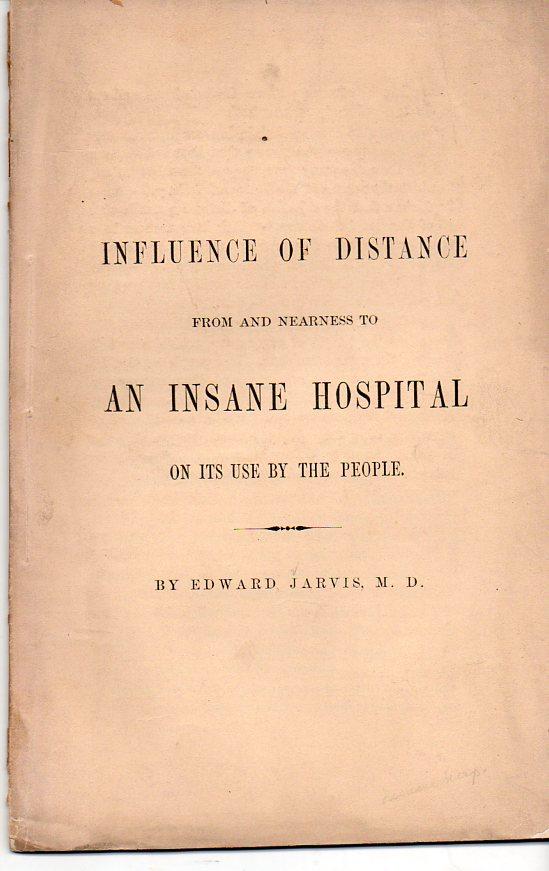
     Dr. Edward Jarvis (1803-1884) conducted a study1 in 1866 to determine how much a factor distance from an “insane hospital” was in regards to people using the facility. It sounds like an obvious-enough question with a probably-obvious answer, but these things are really never so until someone actually looks at the data and extracts an answer. And so Dr. Jarvis performed this function, answering the question once and for all that yes, indeed, the further away you are from a facility the less likely you are going to be to use it, and thus we have Jarvis’ Law.

    “Mental health researchers have long considered the importance of distance on psychiatric service use. Systemic analyses regarding the relationship between distance and the use of mental health care can be traced back to the mid nineteenth century, when Edward Jarvis identified inverse associations between home-to-hospital distance and the rates of admission to Oneida County Hospital of New York and the Kentucky Lunatic Asylum in Fayette County. He claimed that people living near psychiatric hospitals send more patients there for admission than do those living far away (Jarvis’s law).The study also revealed urban–rural differences in the prevalence of insanity, and high admission rates to psychiatric hospitals among people residing near the city center. Jarvis’s law has been identified in numerous studies since the mid-twentieth century.”–Kuon-Chiao Tseng, et al, “Travel Distance and the Use of Inpatient Care among Patients with Schizophrenia”, Adm Policy Ment Health. 2008 Sep; 35(5): 346–356, published online 2008 May 30

    Notes:

    1. Edward Jarvis, M.D.  “Influence of Distance from and Nearness to an Insane Hospital on its Use by the People.”  Published by Separately printed from the American Journal of Insanity, XXII, January 1866, pp 361-406. This publication paginated 1-46. (1866).  


  • The History of Being Horizontal–on Lying Down and Being Flat

    JF Ptak Science Books    (Expanding an earlier effort, Post 1870)

    • See also an earlier post to this blog relatign to this topic: Post-Renaissance People-in-Bed-in-Title-Pages,  https://historyofideasblog.com/thesciencebookstore/2012/08/post-renaissance-people-in-bed-in-title-pages.html

    0--blog---Nov 24--skinny114


    I don’t have much to comment on in these images, just that they are striking and came to me in short order, and that they are all pretty narrow things.  They could fall easily into aSkinny category, or perhaps better still, they might slide nicely into the prototype for a series of posts on The History of Lying Down.  Or perhaps a combination of the two, or one being a sub-category of the other.  Certainly a history of humans lying down would be fairly massive, but scaling it down to late 19th century images of skinny and lying down might narrow the field a bit. 

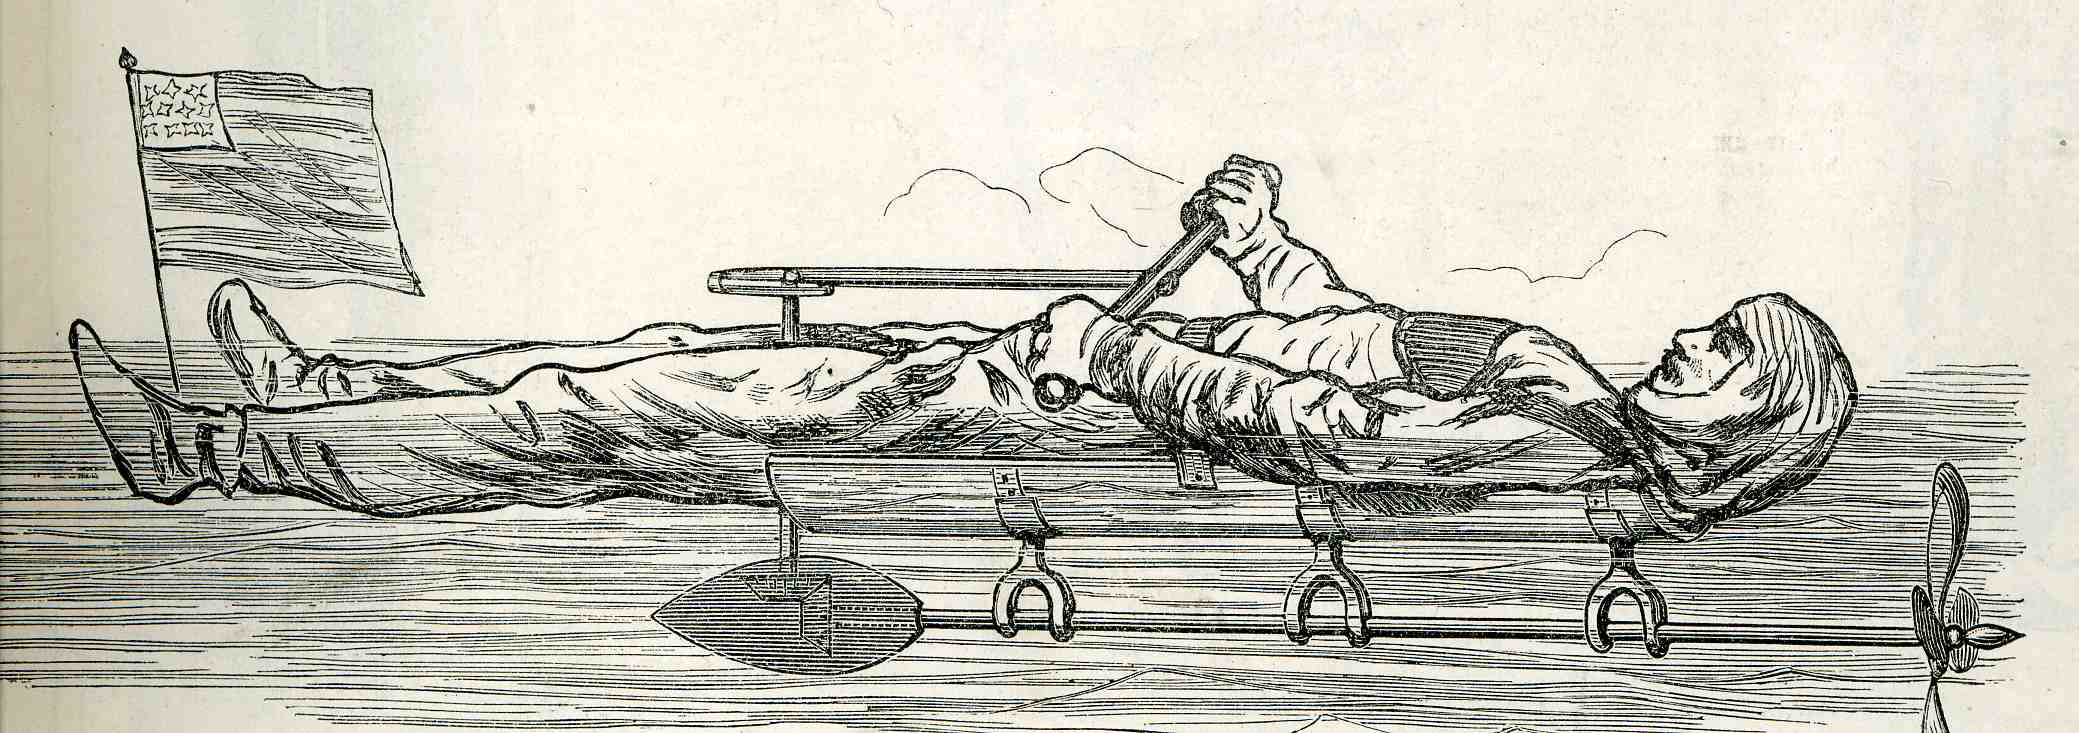
    The first, (above),  is from Illustrirte Zeitung (Leipzig), and published in 1878; it depicts an American effort at simplified swimming, though sometimes when you simplify an already-simple thing, the results are fairly complex.  I haven’t much of an idea about how this would make sense, seeing that the body’s strongest muscles are not being used at all; further, judging by the flag, this guy is moving feet-first, and the whole procedure, despite body suit, look as though it would be terrifically cumbersome and bloaty.  And with the geartrain, plus the weight of the driveshaft and propeller, I don’t know how anyone would keep afloat.  Or how someone would keep their neck in that position for any period of time. In the world of Good Ideas, this would be an Anti-Good Idea. 

    0--blog---Nov 24--skinny116

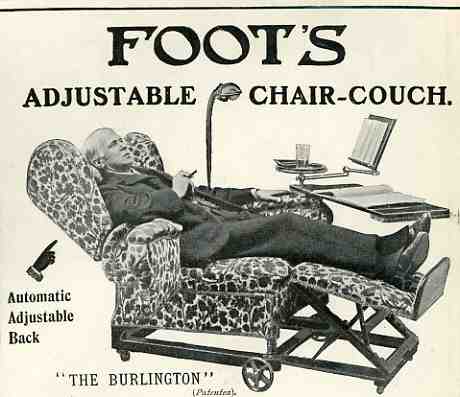
    Foot’s Adjustable Chair Couch, which I found in The Illustrated London News for September 1902, was remarkable for its cushion-y formlessness, accepting the reader to itself like a body with a goiter.  There’s just something terribly wrong with it, reminding me somehow of undeserved and needlessly- rewarded comfort–too much comfort foully a perfectly reasonable invention like The Chair. 

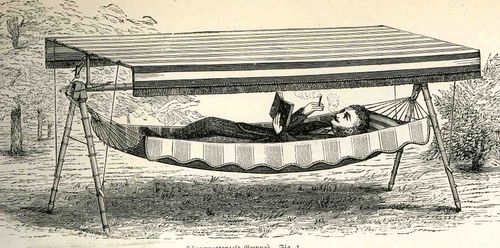
    Next is this skinny, low, light semi-automated shaded hammock; little, narrow, and maybe comfortable to fit a 120-pound person.  This appeared in the Illustrierte Zeitung, again, for 1892.

    0--blog---Nov 24--skinny115


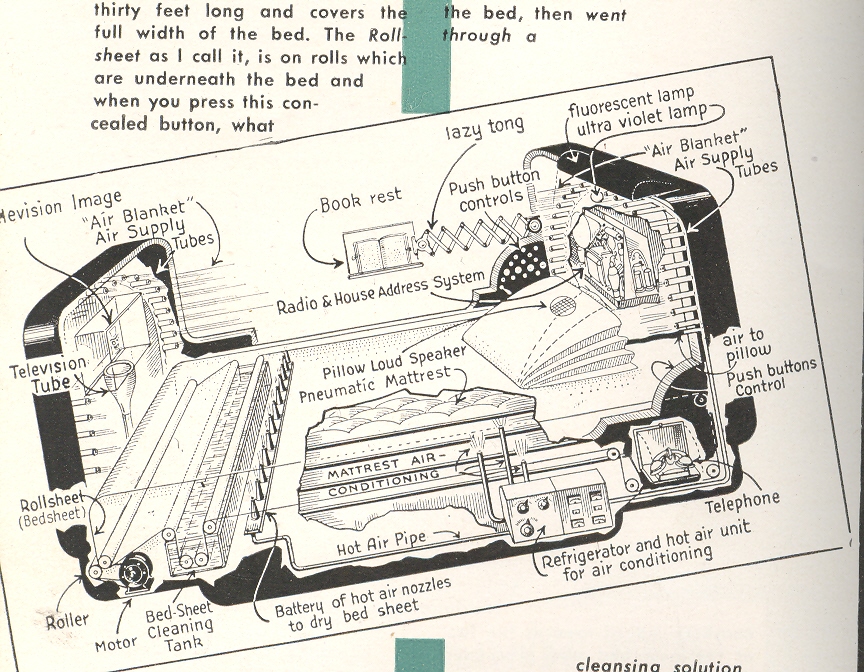
    And for the 20th century contribution, there is this overflowing fabulosity from Hugo Gernsback–this is the only-tongue-in-check effort amongst these entries.  The “electronic bed” appeared in a small 1945 pamphlet called Bizarre, and it is just that, and is certainly not hiding behind any lesser or ambiguous title.  It seems to be a parody of  small magazines and their advertising sponsors,  and copyrighted by the very far-reaching Gernsback, who in 1926 started the first magazine dedicated to the genre of science fiction (Amazing Stories) and for whom the World Science Fiction Society’s annual award for Science Fiction Achievement is named (the “Hugo”).  Gernsback evidently had a taste for cheeky parody, producing similar magazines to this called Quip, Forecast, Jolliers, Tame and Newspeep.

    Bed electronic


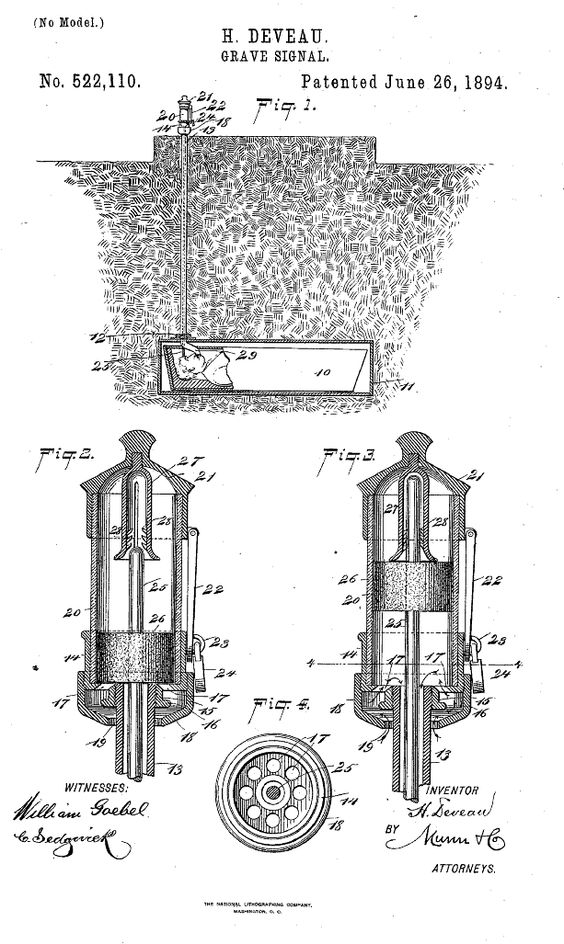
    There is good lying down, and there is “bad”–that is, the lying down that we don’t want to do, the lying down that we try all of our lives to postpone; that is, the lying down for the Big Sleep.  Since it was difficult to absolutely diagnose death in some cases before the 1950’s, there were some people who went to extreme measures to ensure that if they were buried prematurely that they would have some recourse int eh situation–for example,with the patent granted below, a buried person could activate a signal from the grave with very minor movements of the mouth, thus hopefully alerting some passerby to the fact that the dead isn’t:

    Bed coffin signal

    There are endless varieties of lying down–these are just five examples. The world is full of possibilities that are good, bad, and indifferent. Some are very bad (like the restraint beds for the institutionalized insane in the 19th century) and near-bad (the sleeping accommodations of 18th century sailors), and of course the fantastic Renaissance beds of the rich and famous, and so on.  


  • When a Six-Cent Tax Was a Nickel Too Much (1938)

    JF Ptak Science Books    Post 2514

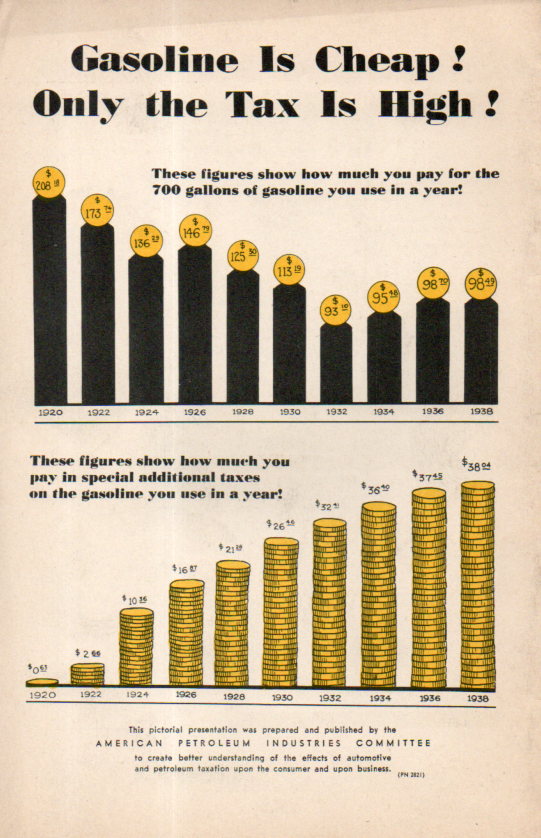
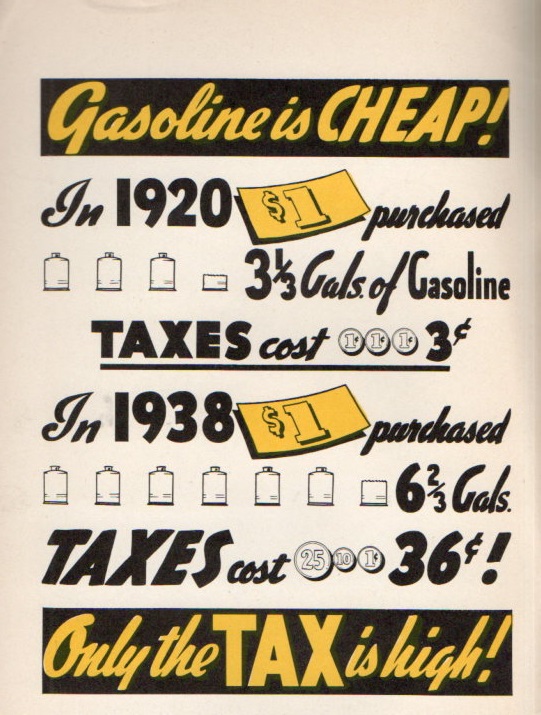
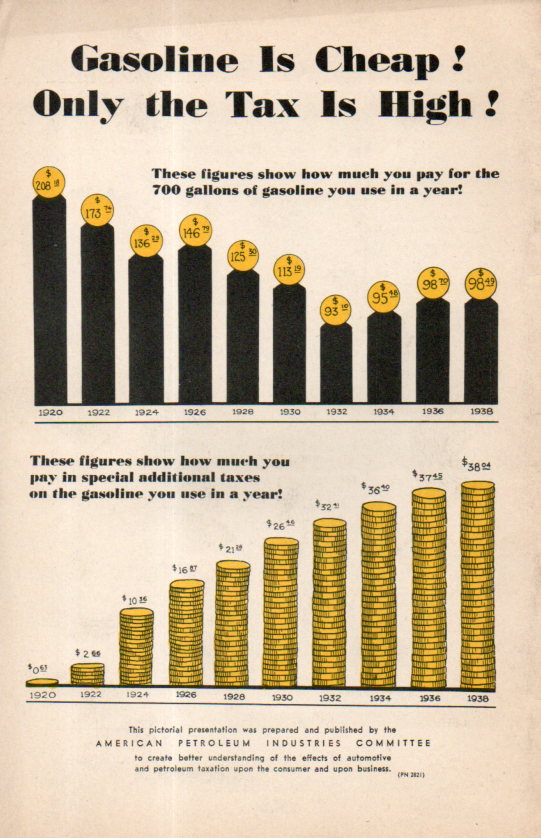
    Gas Tax062Although the artist/author created some great and 30’s-bubbly cartoons, I’m not sure about what he was so grouchy about–plus I don’t know about his number sources, either. The main graphic that gets to his point shows that in 1920 $1 bought 3.5 gallons of gas and paid  6 cents in taxes; in 1938 that dollar bought 6 gallons but the taxes were 36 cents.  So the screed was about getting even more gasoline for the buck even though it was buying nearly twice as much anyway.  Since the federal excise tax in gasoline actually went down from 1.5 cents to 1 cent a gallon at this time, the additional taxes would have come from the states, which I guess were not part of the equation in 1920. But the extra nickel or so per gallon looks to be about average for state taxes on gas in 1938 (as we see in Notes #1 below).

    [The image at left is the rear cover of the pamphlet under discussion–it really doesn’t have a title, just a series of statements.]


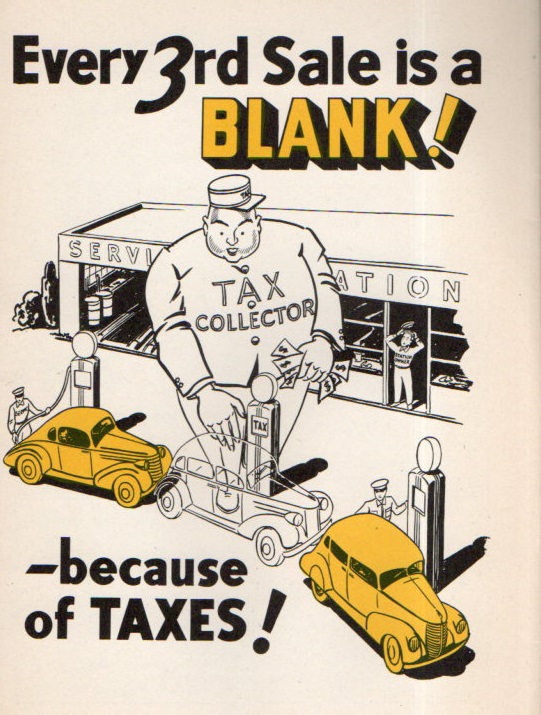
    This was sort of a long way to go in looking at a cartoon-illustrated sweaty tax screed from 1938, but as it turns out  there was a little surprise in the results.  The author/artist is uncredited but the pamphlet was produced and published by the American Petroleum Industries Committee, which no doubt was lobby for a decrease in state (and federal?) taxes to lower the price of gasoline and perhaps to increase consumption.  They made it abundantly clear that they did not like taxes.  And as it turns out they really don’t identify the source of the taxes, just gas taxes in general, though they made it seem as though it was a unified approach to lowering federal and state taxes together as a unit, and not as 48 individual governing bodies for state taxes. On the one hand the penny tax wasn’t really so bad; ont he other the state taxes could be 4-5-6 cents, which turns out to be a lot more than states charge today (CPI adjusted). 

    Gas Tax063So, given for example 5,000 miles/year at 15mpg1 average for 1938 is 333 gallons at 10 cents gallon making $33.33/year in gas expenses or 1.9% of a yearly average salary of $1,731. 

    In 2015, 5,000 miles/year at 20mpg=250 gals x $3.20 = $800/year in gas, and with the average salary (according to the Bureau of Labor Statistics) of $850/week or $43,700/year, the gas expense would be 1.8%  of the yearly income. I have seen other figures stating the individual average salary to be about $30,000–the discrepancy is considerable and I’m not sure of the origin. Using the lower figure the gas expenses jump to about 2.6%.  

    In any event I found it odd that working with a few found and not-quite arbitrary stats that the average percentage of the cost of gasoline via yearly salary would be so very similar.  Of course the cars have gotten much more expensive and also far more powerful and safer to operate, and car insurance has no doubt increased, as has maintenance, so the overall cost of keeping and using a car is quite a lot more today than in 1938–still the similarity of gas/yearly income was pretty cool to see.  

    Now the taxes that these guys were complaining about: that 1 cent in 1938 (according to the BLS inflation calculator) is equal to about 17 cents in 2015 dollars, which is just about what the federal excise tax is today in 2015. The 5 cent state tax in 1938 winds up being quite a bit more than state taxes today–for example North Carolina was charging 6 cents ($1.01) in 1938 compared to its 38 cents today.  

    And so where does this leave us? I really don’t know, except that when there are general complaints about things costing too much it is interesting to see how expensive things really are in a longitudinal perspective.  That, and always consider the source.  

      Gas Tax064

    Notes: 

    1.   First of all the 5k/yr average driving is arbitrary. Secondly I’ve found the stat several times now in quick searches that Ford Model A cars got about 20mpg in 1928.  Cars got heavier/more powerful by 1938 and for the sake of this exercise assume that the average mileage decreased with the increase in power and weight.  It is a little bit of a long shot but probably not to far from the mark. 


    IRS stats for federal excise taxes on gasoline, http://www.irs.gov/pub/irs-soi/00gastax.pdf


  • Finding the One Percent of 1916.

    JF Ptak Science Books  Quick Post

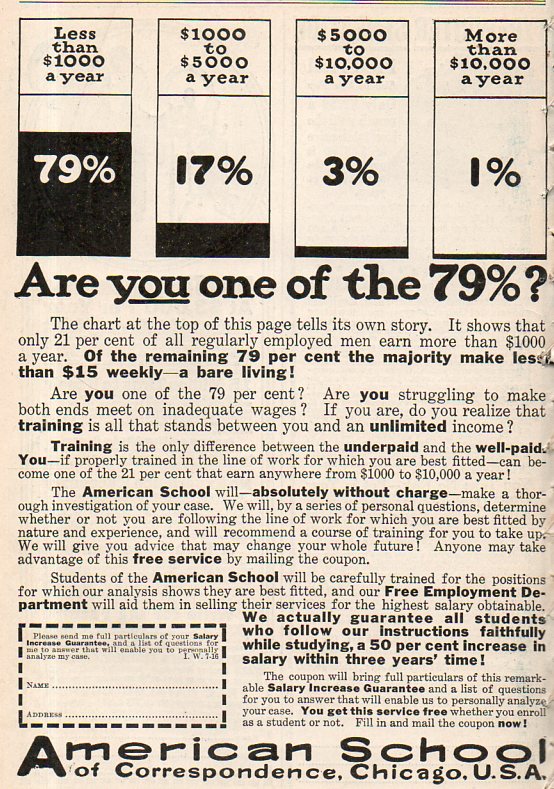
    Where was the One Percent of 1916? Luckily, I found it at the end of this simple bar graph for The American Correspondence School advertisement in Illustrated World for January 1916, right at the end of the other 99% WWI was about at the half-way point, America still wasn’t in the war, and there was little attention paid in the magazine to that fantastically bad Thing happening overseas.  In any event, the ad tried to attract the 79% of the population making $1000/year or less through not-described correspondence school means, and at the same time flagging the top one-percent earners in the U.S. as though making $10,000+ per year. 

    1 percent715
    This doesn’t seem much like a high figure, except that the average person was making about $650/year, and the average house cost about ten times that amount.  Today’s 1% income/year folks take in about $400,000 (or about 25 times the average yearly salary of the  99%, and three times the cost of the average house).  And according to the Bureau of Labor Statistics, that $10k/year is equal in buying power to about $212,000 yearly in 2013, so that odd-looking ten grand figure might be about right, even if it was probably all quickly made up in some composing room in Chicago 97 years ago. 

    If you were to look at this figure through comparative baseball eyes, it is particularly astonishing, given that in this decade or so there have been 65 players with $100,000,000 contracts, which makes for many dozens of players with 10 million/year salaries.  But these are different times, and the baseball players of 1916 (the year of the first super market opening) were paid hardly anything at all relative to the income of the team owners, though baseball as a business at this point represented almost nothing of what it would become. 

    I don’t mean to pick on baseball–it’s just that it is the beginning of the World Series and the game is on my mind.  And it doesn’t work so well to pick out the one percenters in, say, physics, where Albert Einstein–who had a terrific year in 1916–was probably being paid in the 3% club region in spite of his rather exalted fractional 1% status. 

    In any even I was surprised to see “1%” appear in this graphic.


  • Buying a Stocked Country Store, 1836

    JF Ptak Science Books   Post 2067

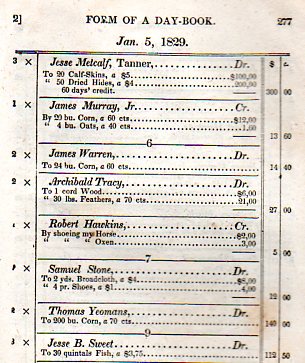
    MATH day bk407There are times when a reader can get a little piece of social history in an unexpected place.  For example, in the math text book that was just addressed on this blog1, there is a short anterior section called  “A Practical System of Book-Keeping for Farmers and Mechanics”.  It is here where the reader is introduced to the keeping of a Day Book (which is different from a  ledger and a cashbook) where the merchant would keep a record of what was sold to whom and for how much. To that end the author includes three pages of a sample Day Book, which displays a host of information for the modern reader about what could be expected to be found in the generic cash-and-carry trade in the U.S. in 1836.  Most of the goods sold would have been purchased to make something else–there were not many items that would be considered to be a product for end use. So someone might not buy a carriage though they would buy the stuff that would go into making a carriage, or the ingredients for making beer rather than the beer itself, and so on.

    And so, some of the entries from this practice Day Book: 

    6 yards of calico ($2.65), 2 yards of  broadcloth ($3.25), 217 pounds of iron @ 8cents/pound= $17.36, 37 pounds of cheese ($3.70), 41 pounds of feathers ($28.70), 32 gallons of molasses, 300 pounds of pork (at 7 cents/pound), 30 bushels of corn ($13.50),1 cask of nails (225 pounds for $18), 32 gallons of molasses ($8), 30 pounds of harness leather ($16), 17 brooms ($2.08), 7 pounds of butter ($1.40), 7 tons of hay ($70), 50 dried hides ($200), 4 bushels of oats ($1.50),  1 cord of wood ($5),  28 pounds of lard ($4), 3 bushels of salt ($1.98), 75 yards of brown sheeting ($10.50), 500 pairs of men’s shoes ($475), 120 pounds of blistered steel ($3.88), 100 pounds of Russia iron ($5), 300 pounds of bacon ($40), 3 pounds of coffee (48 cents), and 6 pounds of raisins ($1.99). 

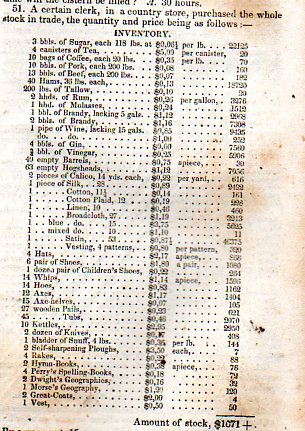
    Fascinating–but even more so from a bit found earlier in the book–an interesting and longish example for practical mathematics, a very detailed question for addition. The presentation is a nearly full-page list of the contents of a country store, the inventory of which was being purchased by “a certain clerk” thus giving issue to the addition problem as well as a hint to what was found in a general store in 1836. 

    MATH406
    In this addition problem (which is somewhat problematic in that in the overall price column there is no differentiation between dollars and cents, so “4” means $4.00 anfd “50” can mean $50 or 50 cents) there are 46 entries, almost all of which are standard necessaries, with a few luxury items tossed in for  the benefit of those who would have the occasional disposable income for such a thing.  Overall the list is dominated by basics: sugar (354 pounds worth), tea, coffee, pork, beef, ham, rum, brandy, wine, vinegar, (40) empty barrels, (63) empty hogsheads, vinegar, axes, whips, wooden pails, kettles, tubs, ploughs, and rakes, and more (as we can see below).  Less common was the book stock:  2 Hymn Books, 4 Perry’s Spelling books, 2 Dwight’s Geographies, and one copy of the iconic Morse’s GeographyAnd it looks as though the buyer purchased everything for about $1071.00—which was a considerable sum. The average farm laborer was paid about $10/week, plus room and board in 1840; a carpenter might make $1-1.50 per say, while laborers in manufacturing (glass, iron, wool, cotton) all made about 80 cents-1.00 per day2.  That means it would take the average man four years to save  $1000, and probably more. In order to start this business to make money, you certainly needed to have some money to get started in making it.  In the meantime, this is an interesting peep into what people bought in country stores in 1836. 

    Notes:

    1. Rosell C. Smith, Practical and Mental Arithmetic, on a New Plan, in which Mental Arithmetic is Combined with the Use of the Slate… which was printed in Hartford beginning in 1829 (my copy being printed in 1836).

    2.  See here for a decent look at what wages were like over decades in the 19th century. 


  • Prison Labor and the Price of Kegs of Lard, 1875-1885

    JF Ptak Science Books Quick Post
    Follow Me on Pinterest


    Fat and prison
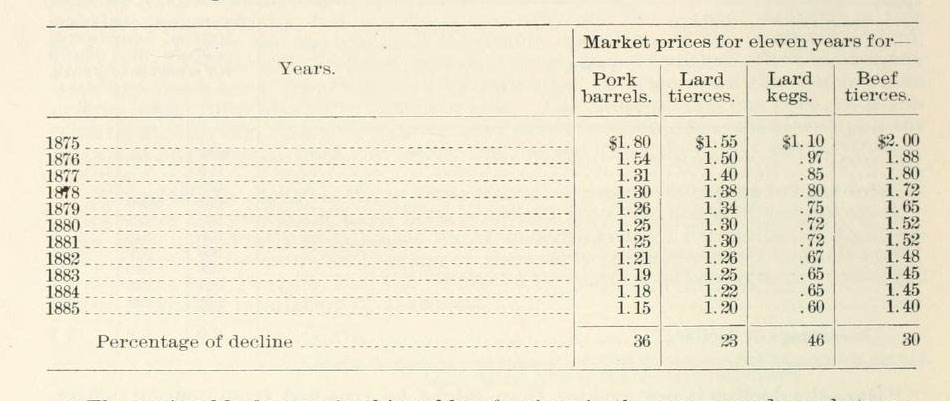
    The title of this quick post seems both irresistibly attractive and horribly repelling in an oh-g_d-is-this-what-we’re-down-to dissertation for a moderately-good university.  But really all this post is is a title–I stumbled upon this table looking for emigration figures to illustrate a dot-matrix map from the United States Industrial Commission (printed in 1900), volume 3, which concentrated on the statics and sociology of prison labor.  So what this table shows is the effect of prisoners’ labor on the price of pork and pork fat in the Chicago market for a ten year period at the end of the 19th century, and what we see is that the “free” labor in prison in this area produced cheaper prices in the fat market.  There you have it. [Source: Internet Archive, here.]


  • How Much it Cost to Clothe the Working Poor of London, 1854

    JF Ptak Science Books  Post 1761

    The “working poor” of England may have been half of that–working, that is, and hard at work, though not being paid even enough to be considered poor. Their story has been told in many ways, of course, the backbone of the Industrial Revolution succeeding on their bones, observed and recorded and shared by Charles Dickens and others, and on and on, told elsewhere in brevity and quick detail better than I can do so here.

    I did want to make a quick comment about a very small detail in the state of those poor people, found in Charles Kingsley’s  Cheap Clothes and Nasty, printed in 1850.  It is quite a documentarian’s tour of the plight of the poor, written by a very able observer.  (Kingsley is a very interesting person–an historian, priest in the Church of England, social commentator, and novelist.  As a matter of fact he was exceptionally prolific, producing during his lifetime (1819-1875) a fine long list of accomplishment, three of which have survived to this day as sorts of minor classics.  But what he did with great regularity was publish books–34 of them in 25 years between 1850 and 1875, including 15 during the decade of the 1850’s, 11 in the 1860’s, and 8 in the 1870’s to his death in 1875.  Perhaps as important as all of that was the role he played in the arrival of C. Darwin’s On the Origin of  Species…, as Kingsley wrote one of the earliest reviews of the book and defended it strongly.)

    But getting back to the poor,  Kingsley made a very strong case for the poor being less so than that, as we see here:

    “Folks are getting somewhat tired of the old rodomontade that a slave is free the moment he sets foot on British soil! Stuff! – are these tailors free? Put any conceivable sense you will on the word, and then say – are they free? We have, thank God, emancipated the black slaves;  it would seem a not inconsistent sequel to that act to set about emancipating these white ones.Oh! we forgot; there is an infinite difference between the two cases – the black slaves worked for our colonies; the white slaves work for us. But, indeed, if, as some preach, self interest is the mainspring of all human action, it is difficult to see who will step forward to emancipate the said white slaves; for all classes seem to consider it equally their interest to keep them as they are; all classes, though by their own confession they are ashamed, are yet not afraid to profit by the system which keeps them down…”–Charles Kingsley, Clothes, Cheap and Nasty, 1850

    Kingsley continues on with the stuff of research, uncommonly sharing the lot of what a vast section of English society experienced daily though mostly in silence.

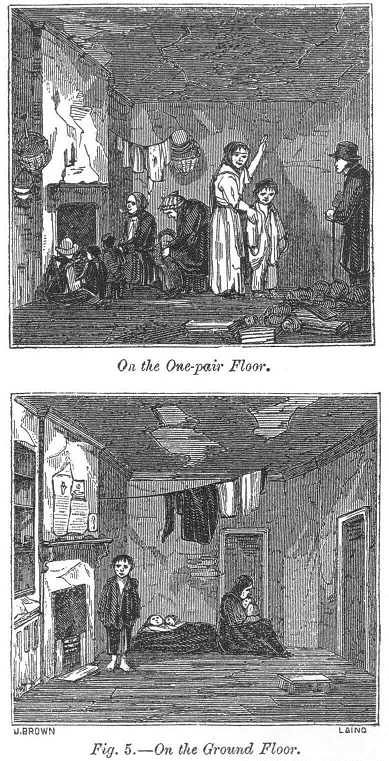
    Another excruciating and interesting report was made by George Godwin in his London Shadows, a glance at the “homes” of the thousands of 1854 (the whole work found on the wonderful Victorian London blog, here and about which I posted about here).

    Godwin–an influential architect and editor of the very influential The Builder  as well as a social reformer, who lived from 1813-1888) wrote an expose of how so many Londoners lived at the middle of the century. It is also illustrated with woodcuts of the places in which people lives–artwork in wood and ink that have a very definite quality of the unforgiving cameras of Life magazine a century later.  The images are awakening and abrupt–all the bitter observation of George Orwell, only told much more quickly, like a person trying to describe a raging house fire before the thing burned itself out.  Its a powerful work, and I can’t help but think that those reading it in 1854 must have been appalled not only by the deep visualization of the state of the working poor, but also by its scope, and the possible revelation of England’s basic bedrock.

    Here is an example of Godwin’s work, which includes observations on not only housing the poor, but clothing them as well, and published in the editorial pages of journal The Builder. He presents one aspect of their lot by discussing their clothing and its purchasing, bought for what the polite reading circles who would find The Builder  to be almost for no money at all, though the few pennies spent on a pair of shoes or shirt were a major factor in the weekly ration of the working poor., particularly if they were making 5 or 10 pounds per year.   It was an interesting way for Godwin to present to the non-poor what the other-half really had to live like, and perhaps by reaching out to the population that did the building-of-London he probably hoped to affect some sort of reform in the way in which the poor had to live and work.  An example of the Godwin work:

    “One of the London missionaries (a body whose valuable services can only be properly appreciated by those who understand the nature and extent of the evil to which we are directing attention) says:-
        “Persons who are accustomed to run up heavy bills at fashionable tailors’ and milliners’, will scarcely believe the sums for which the classes we are describing are able to purchase the same articles for their own rank in life.”
        A missionary who recently explored Rag-fair, reported that a man and his wife might be clothed from head to foot for from 10s. to 15s. Another missionary stated that 8s. would buy every article of clothing required by either a man or a woman, singly. In Pennant’s time it was less. He says (speaking of the other Rag-fair), that the dealer pointed out a man to him, and said: “Look at him. I have clothed him for fourteen-pence. A third missionary reported : “There is as great a variety of articles in pattern, and shape, and size, as I think could be found in any draper’s shop in London.” The mother may go to “Rag-fair” with the whole of her family, both boys and girls,- yes, and her husband, too, and for a very few shillings deck them out from top to toe. I have no doubt that for a man and his wife, and five or six children, £1 at their disposal, judiciously laid out, would purchase them all an entire change. This may appear to some an exaggeration: but I actually overheard a conversation in which two women were trying to bargain for a child’s frock; the sum asked for it was 1½d. and the sum offered was a penny, and they parted on the difference…”
    http://www.victorianlondon.org/publications4/shad-06.gif