A Daily History of Holes, Dots, Lines, Science, History, Math, Physics, Art, the Unintentional Absurd, Architecture, Maps, Data Visualization, Blank and Missing Things, and so on. |1.6 million words, 7500 images, 4.9 million hits| Press & appearances in The Times, Le Figaro, Mensa, The Economist, The Guardian, Discovery News, Slate, Le Monde, Sci American Blogs, Le Pont, and many other places… 5000+ total posts since 2008.

  • Are YOU the Girl for the Job? 1952

    JF Ptak Science Books    Quick Post

    These were the helpful hints to get the working woman out the door and into a job that she could keep–following the reimine of daily healthcare and body awareness as suggested by Bristol-Myers, the maker of the list as well as most of the products that one could buy to help keep pace with it.

    girl6

    ·Posted by :

    ·in:

  • Anatomy of the B-17: Construction Images from Seattle, 1941/2.

    JF Ptak Science Books   Quick Post

    Tessie with planeI’ve long been an admirer of the Boeing B-17 aircraft and have posted about it on this blog a number of times.  Today I just wanted to share some images of the aircraft’s production and assembly at the Boeing Seattle works in 1942.  All photographs are from the Farm Security Administration series (Office of War Information) and can be found (with a hundred others) at the Library of Congress site, here.

    (Our younger daughter, Tess, with here antique wooden model of the B-17, with the real thing (B-17G)  in the background.)

    Farm Security Administration/Office of War Information Black-and-White Negatives:  B-17 Construction, 1942-1944

    Production. B-17F heavy bombers. A women worker, over 60 years old, does an expert riveting job on a B-17F bomber in the Long Beach, California, plant of Douglas Aircraft Company. Better known as the "Flying Fortress," the B-17F is a later model of the B-17, which distinguished itself in action in the South Pacific, over Germany and elsewhere. It is a long range, high altitude, heavy bomber with a crew of seven to nine men and with armament sufficient to defend itself on daylight missions

    “Production. B-17F heavy bombers. A women worker, over 60 years old, does an expert riveting job on a B-17F bomber in the Long Beach, California, plant of Douglas Aircraft Company. Better known as the “Flying Fortress,” the B-17F is a later model of the B-17, which distinguished itself in action in the South Pacific, over Germany and elsewhere. It is a long range, high altitude, heavy bomber with a crew of seven to nine men and with armament sufficient to defend itself on daylight missions.”


  • The Decision to Use the Bomb, 17 July-6 August, 1945

    JF Ptak Science Books  Post 1720

    July 17, 1945 (Trinity +1 or Hiroshima -20), the day after the Trinity test of the first atomic weapon, was the first day in which very concerted, very real discussions ensued about what to do with the bomb and where to us it.  Actually the discussions were mostly on the “where” than on the “whether”.  (As it turns out part of a minor segment of the “whether” part was Leo Szilard’s petition to President Truman not to use the bomb and which was signed by 155 Manhattan Project scientists, and which had reached its final version on this day.)

    The truth of the matter was that it was a very complex issue, an easily misunderstood tapestry of circumstance and consequence. The major issue of course was that the Japanese would not surrender, and that there would be “fanatical resistance” once the invasion of the Japanese islands had begun.    The battle of Okinawa had just been fought—it was a horrible confrontation taking 12,5000 American lives and more than 1000,000 Japanese , demonstrating that even in impossible circumstances that the Japanese simply would not surrender (unconditionally).   This is just one instance—there are many others, not the least of which was t he recent firebombing of Tokyo, taking 150,000 lives.  Air strikes in general seemed to not make a difference in the will of Japan to fight—as was demonstrated again and again in the British and American bombing of Germany—as was further demonstrated in General Curtis LeMay’s and General Hap Arnold’s  60-city attack in the May-August span.  The thought was that if there was an invasion that it could well cost the U.S. 1000,000+ casualties and would be completely devastating to Japan.

    ·Posted by :

    ·in:

  • Manuscript and Carbons on the U.S. Naval Bombardment Survey, July 1945

    JF Ptak Science Books   Quick Post

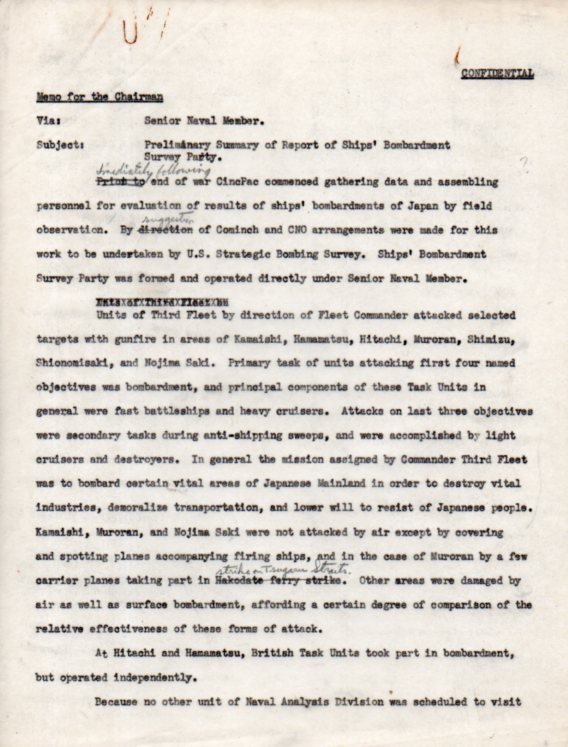
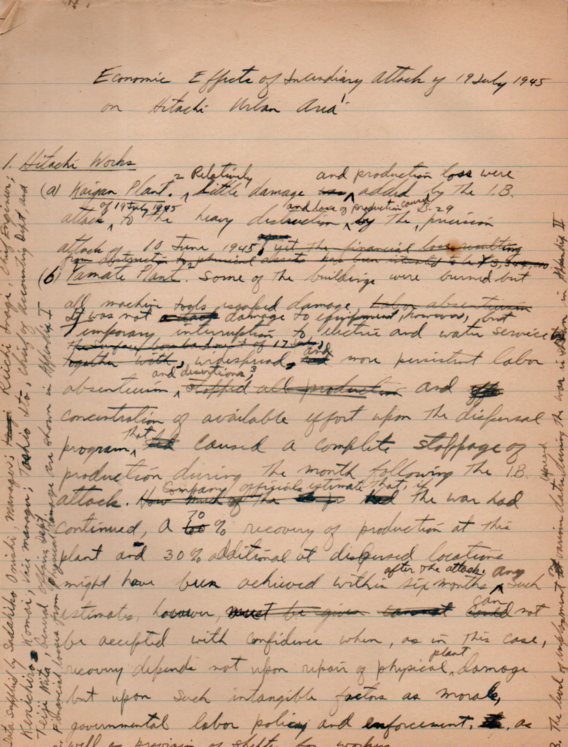
    I just wanted to point out that over in the books for sale section of this blog I posted a bit on a small archive of manuscript and carbon copy material that comprise what seems to be the summary of the U.S.Navy (and Allied) bombardment of Kamaishi, Muroran, Hitachi, Kushimoto, Shimizu and Hamamatsu, forming the Navy Bombardment section of the U.S. Strategic Bombing Survey.  This was about the extent of the Allied naval bombardments against Japan, as it was not possible for battleships to maneuver close enough to the Japanese homeland to fire against industrial and production centers.  (It may have also been the case that the aircraft used to protect the assaulting ships could have perhaps done as much damage to the targets as the ships themselves.)

    For those of you with an interest in these things I’ve posted the entire working copy of the “executive” summary of the report, as well as covers of some of the rest of the sections of the survey, here. 

    USSBS 1176

    USSBS economic effects189

    [The archive is from the estate of J.D. Coker, who served in the U.S. Navy on the US Strategic Bombing Survey Ships’ Bombardment section, and who later became a leading official in the U.S. Atomic Preparedness programs (such as the President’s Committee on Emergency Preparedness).]

    ·Posted by :

    ·in:

    —
  • One Inch=$370 Million: Unusual Displays of Quantitative Data and the Height of American Public Debt

    JF Ptak Science Books  Post 1721

    0 ebay 13 graphs268

    [Click image to enlarge]

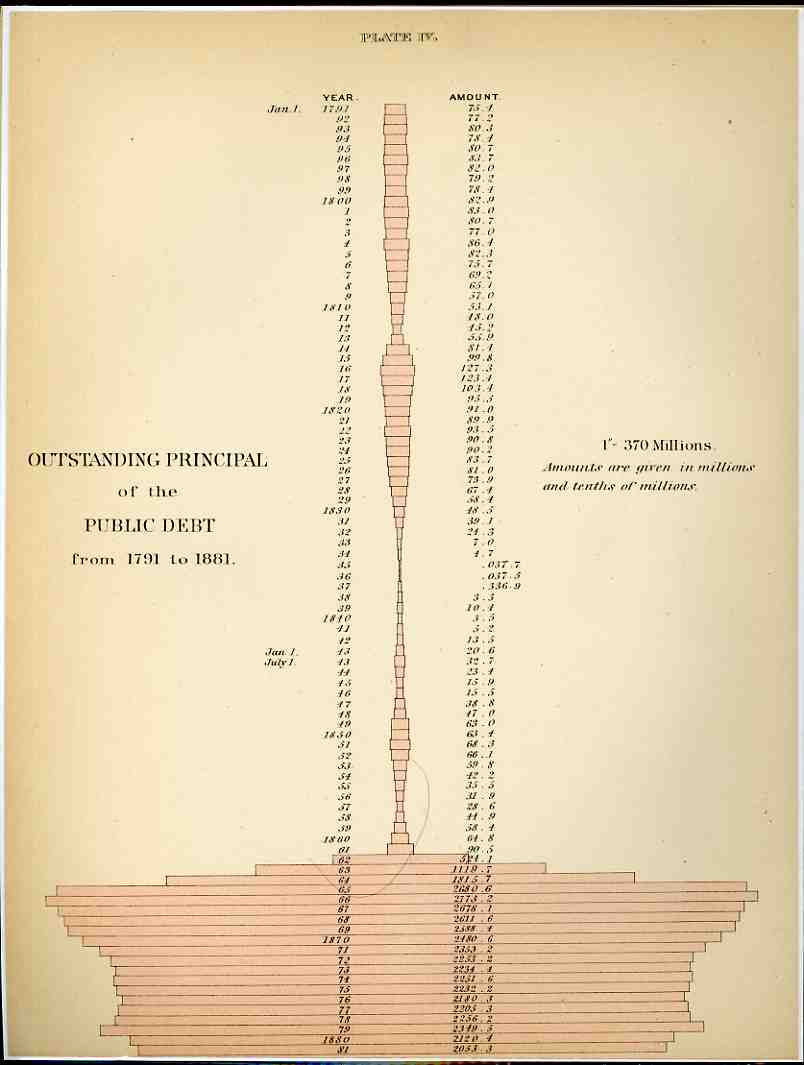
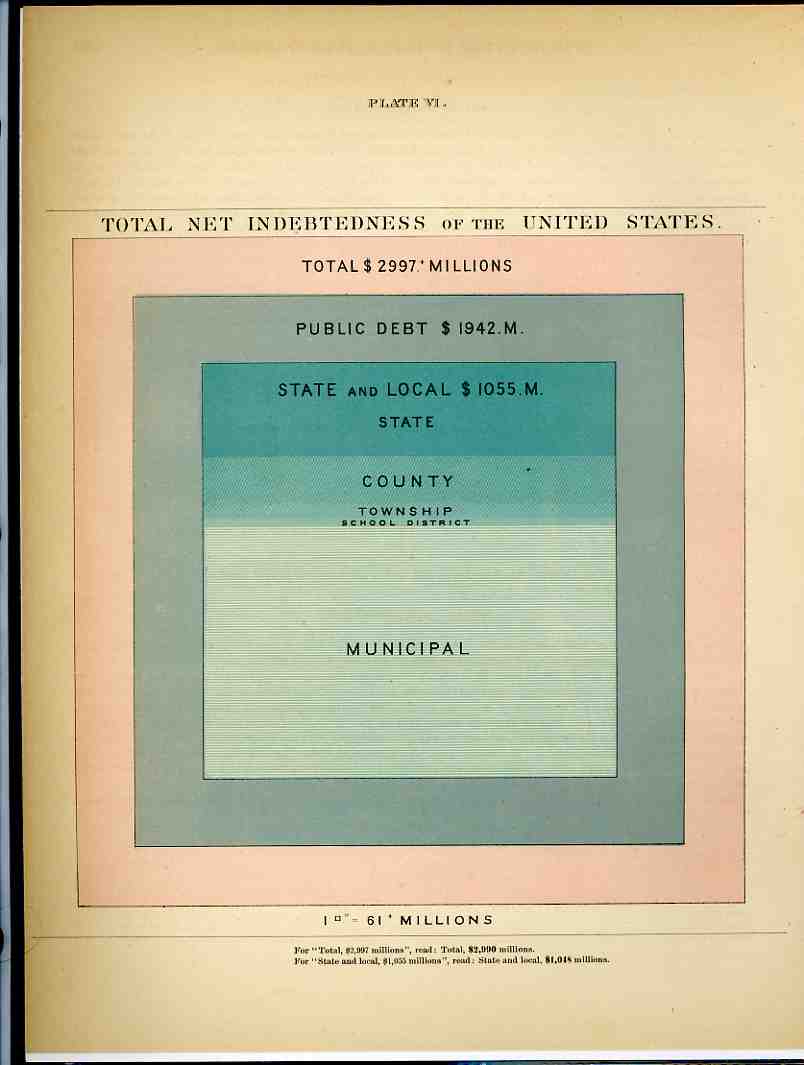
     It isn’t often that you see money represented by dry measure, but that’s what happened here in these two examples from the fantastic Walker Statistical Atlas ( Statistical Atlas of the United States based on the results of the tenth census 1880 with contributions from many eminent men of science and several departments of the government Comp. under the authority of Congress by Francis A. Walker, M. A., superintendent of the tenth census … and published in 1884).  What we see here is a history of American federal indebtedness from 1791 (when the public debt stood at 75.1 million dollars) to 1881 (about 2 billion).  Using the CPI (consumer price index) as a factor to translate that number in 2008 dollars (or so), the 2 bil grows to about $40 billion (a nickel then is about a dollar now). The interesting part of the legend–and what drew me to this graphic even before its somewhat unique shape–state “1”–370 millions”, that is one inch of pink horizontal bar stands for about $370,000,000, and the last bar on this graph is about 6 inches long, which, adjusted for inflation, would now be about 10 feet long. .That said, the really interesting part comes next–if we use this measure to graph a horizontal bar for the American debt as it stands in 2008, it would pink a pink bar that was about a HALF MILE long to express our 10(+) trillion dollars of debt.  OR, somehow, the old debt of 1881 would be about 1 story of a house, while the 2008 version would be up one side of the Empire State Building and down the other (and yes that includes the aerials).  I don’t know how to put this comparison in context, the differences are so staggering. 

    0 ebay 13 graphs269
    After having popped a neuron or two trying to get my head around that one, we’ll further confuse the situation with the second chart, which shows the total net indebtedness of the U.S. in 1881 in terms of square inches; or, at the bottom of it all, a 7×7 inch square represented the entirety of the $3 billion owed out.  49 square inches. Working backwards this time, our $10 trillion (or $10,000,000,000,000.00 writ large) adjusted back to a CPI value in 1881 would have covered about 88 PAGES of the atlas or 9,000 square inches.  Again, the numbers are just almost too big to mean anything. 

    We, as a country, owe one hell of a lot of money.

    And yes there are many different ways of trying to figure out what one 1881 dollar “means” in terms of 2008 dollars, but the CPI is the most simple to use and least argumentative and at least gives a pretty good idea of scale.  It would be more useful to try and establish the degree of difficulty  of turning the corner on the debt in 1881 compared to doing that today, but this is just a late-night post at the end of the week, and I don’t have a good clue about how to try and measure that bit simply.

  • Imaginative Display of Quantitative Data: the Diminishing French Navy

    JF Ptak Science Books    Quick Post   [Part of the series on the Quantitative Display of Information.]

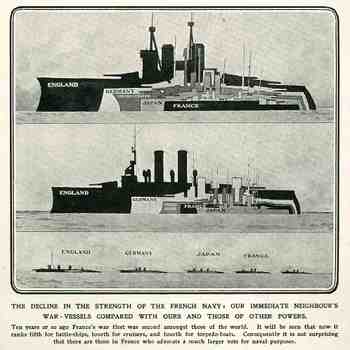
    The size of the French Navy was displayed in carnivorous detail in this 1905 graphical display of data, found in the Illustrated London News.  To have your navy devoured by the Germans, Japanese, British and American navies, seen in relentless relief.  I’m sure that the illustration put across its message rather well. 
    Blog1sept_16ship_france569

  • Japanese Propaganda: the Invasion of China, 1931-1938

    JF Ptak Science Books Quick Post

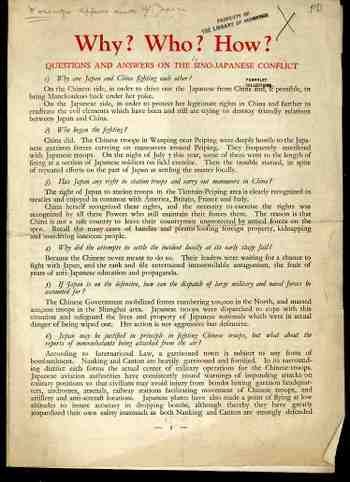
    Blog1sept_8_japanese_prop517 This Why/Who/How pamphlet on the Sino-Japanese War fully and incredibly lays the blame for the war in the hands of China, reminding me a lot of an earlier propaganda pamphlet that I wrote about here on the threat of Poland to Nazi Germany (1939).   Even the title of the war “the Sino-Japanese Conflict” is misleading–placing the Chinese first in the description of the fighting invests the idea with the primacy of the Chinese role simply because it is before the hyphen.  Japanese-Chinese Conflict certainly sounds different, yes?   (Click on image for a readable size; also see below for the rest of the pamphlet..)

    The Chinese tried to tell their story, but I think not nearly as successfully as the Japanese–also this was complicated by the fact that Europeans had been mucking around in China for almost a hundred years by the time the Japanese got to it in 1932, so their voice raised against a foreign intruder was definitely not as loud as it might have been had the foreigners not been devastating China for such a long period of time beforehand. 
    Blog1sept_8_japanchina_side521

    When this pamphlet was published, the war-in-earnest had been waged already for a year, mostly through engagements over a cresting wave of “incidents” in which Japan found it more and more necessary to “protect” itself from China while at the same time trying to harness/steal as much of China’s natural resources as possible.  It would take another six years for total war to set in, the end result of which (in the 1937-1945 timetable for the event) found 20-35 million Chinese soldiers and civilians dead and wounded, while the Japanese lost in the vicinity of 2 million.  This war was basically folded-in to WWII after 7 December, though it is by far the bloodiest war fought in Asia in the 20th century.

    ·Posted by :

    ·in:

  • Complicated Simplicity: A Marconi Wireless Graph of Connections at Sea, 1907

    JF Ptak Science Books  Quick Post

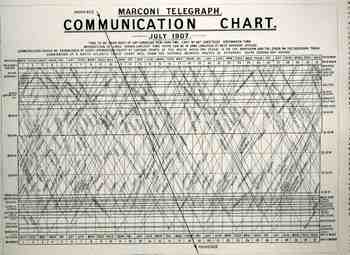
    This is an illustration of the approximate times and places that ships at sea could expect to be able to communication with each other by the relatively new invention of wireless telegraphy. (We’re talking about Marconi here and just very briefly; this is not the place for the discussion of what he did or didn’t “borrow” from his predecessors and contemporaries such as Heinrich Hertz, Oliver Lodge and Nikolai Tesla.  He at the very least however owed all of them at least an enormous helping of gratitude, and probably more.  Then there’s Marconi’s very conservative technical continuation in the field which is confusing and interesting.  And finally but not the least of all of the stuff about Marconi is his comfort and support of the Fascist regime in Italy, where Marconi became a member in 1923, escalating in his fame through the party ranks to have none other than Benito Mussolini serve as the best man in his second wedding.  But as I said that’s all for another day.) It appeared in The Illustrated London News for 7 September 1907,surrounded by an article on Obelia in the “Science Jottings” section of the magazine.  This chart isn’t
    1blog_oct_13marconi_at_sea816

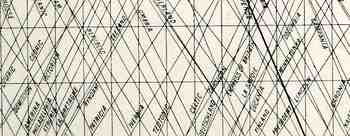
    quite as complicated as it seems, really: all you need to do is follow one line from the top to the bottom.  Simply put, each diagonal line represents a specific ship (all of which are named) and their positions as they make their ways across the North Atlantic ocean; each intersection represents the time and place that two ships can communicate via wireless with one another.  So, for example, the Empress of Britain will on its six-day voyage be able to communicate at least 26 times with other ships for news and information.

    What this seems to me to be is the supplemental efforts of the ocean-going ships

    1blog_oct_13marconi_at_sea817

    to the newly established trans-Atlantic radio-telegraphic company and installation opened by Marconi in October 1907.  Even though the first transatlantic communication is celebrated as having taken place in 1901, the performance, even in 1907, was still spotty.

    Again, I’m just after this for the image 

  • A History of Holes: Electric “Holes”

    JF Ptak Science Books  Quick Post   [Part of a series on the History of Holes.]

    Well, this really isn’t a “hole” per se, but it, the “hole”, certainly behaves like one, at least metaphorically.  The concept occurs in the title of this famous work by the problematic William Shockley (below)–it was the bible, really, of all early things relating to the semiconductor–the electron hole being the mathematical opposite of an electron  (e– ).  (The electron is a subatomic particle with a negative charge, explained very early on in its first format as “radiant energy” by William Crookes in 1879, who built on the earlier work of Hittorf and then on Goldstein, with the name “electron” finally coming to the particle by George F. Fitzgerald.)

    Shockley208The “hole” is a metaphor, a useful use of a word to explain the absence of an electron from a full outer shell.  In a semiconductor, an electric current is carried not only by the flow of electrons but also by the flow of positively charged holes where the electron absence occurs–the hole is an electronic absence charge carrier, and it the basis for modern electronics.

    [This book may be purchased by the person who cannot live without it on our blog bookstore site.]

  • Ultra-Massive Acceleration, Jules Verne, and Making Human Jelly. A Romance of 22,000 gs

    JF Ptak Science Books   Post 1722     

    [My apologies to my readers:  in an earlier version of this post I calculated that the Verne space module would be traveling 129,000,000 mph exiting the space cannon–that was wrong, I’m very sorry to say. The figure should have been 129,000,000 feet per hour, which would be about 25,000 mph.  Mea culpa.]

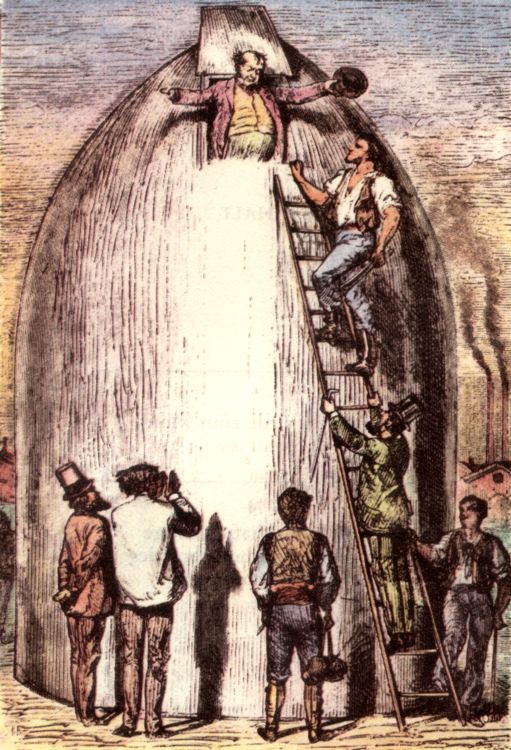
    Earlier in this blog appeared a post on the Eiffel Tower Happy Bullet.  It turned out to be a highly-circulated bit, what with the subject matter and all–describing a gigantic bullet filled with people and dropped from the interior heights of the Eiffel Tower and landing in a big watery hole at the bottom.  The effect of impact I think would have made those folks suffer Massive Internal Complications.

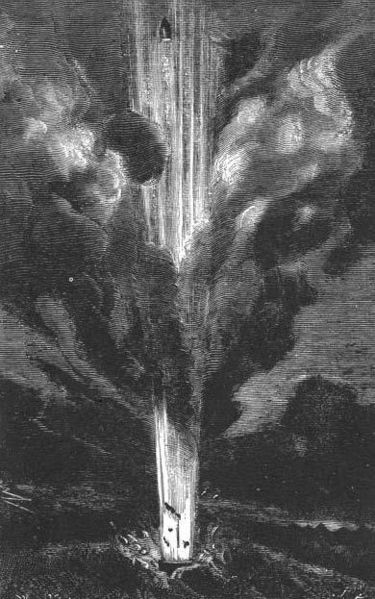
    Impressive as the Eiffel bullet idea was, it was absolutely nothing compared to what another Frenchman thought of at about the same exact time.  Perhaps no human could have suffered more internal disruption in any science fiction story than those who would have been subjected to Jules Verne’s (whose birthday is today, February 8, 1828 – March 24, 1905) space gun, an enormous Columbiad, the mode of propulsion for the travelers in his From the Earth the Moon/De la Terre a la Lune.

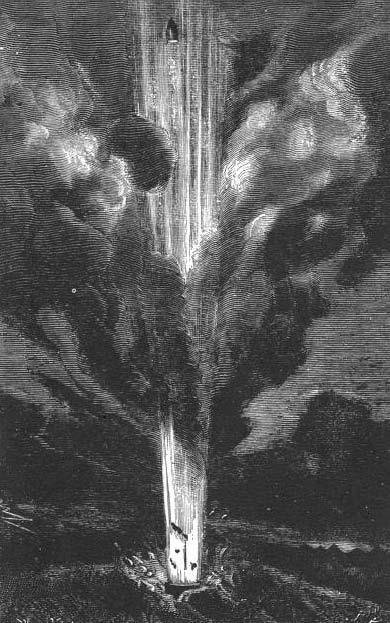
    Verne’s 20,000-lb projectile to the Moon would sit in a cannon-hole in the Earth that was 280 meters deep with a diameter of 2.7 meters, which would sit on the bottom of the hole capping off  200 feet of guncotton (!, weighing 400,000 pounds!).  Somehow this mass would be ignited, and as Verne (or his brother) calculated would produce an initial velocity of 12,000 yards per second, which is 36,000 ft sec, or about 24,000 mph, which is a big enough number to attain the (more or less correct) escape velocity Ve  of 11.2 km/sec. (Very high-velocity shells  fired by tanks fitted for kinetic energy penetrator ammo attain a muzzle velocity of 5700 ft/sec.) And somewhere in there would be a crew greeting a rather-ncredible-to-write-down 22,000 gs.  Astronauts in the Apollo program experienced something like 1g; dragster car drives who go from 0 to 100 mph in .86 seconds experience about 5.4g.  

    22,000gs is another thing entirely.
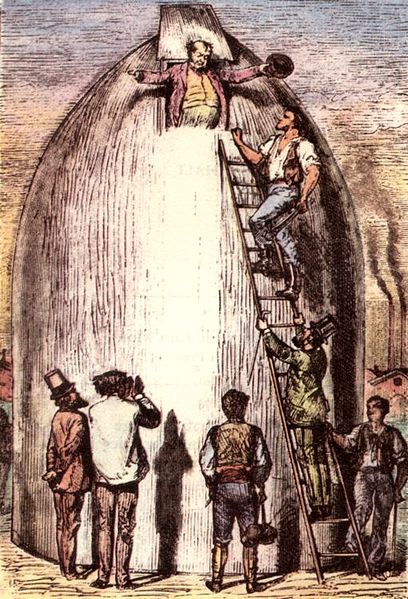
    File:'From the Earth to the Moon' by Henri de Montaut 39.jpg

    And difficult to imagine.

    File:FETMlaunch.jpg

    Jules Verne got a lot of stuff right in his long and lovely career–an there was quite a bit that he foretold correctly in this very story.  Just not the take-off. 

    The further-funny thing about this space gun is that it made another appearance in another Verne story, The Purchase of the North Pole, 1889.  During this period of human exploration there was a push to explore the Poles–in Verne’s story, an attempt is made to simply this exploration.  But not in the way you might think.  Verne was going to employ the space gun, again, but this time to alter the axis of the Earth so as to make it easier to get to the Poles and exploit their natural resources.   I must say that this answer was not at all clear to me, even with my best sci fi cap on:  but Verne saw it, saw that it would be better for all concerned to move the Poles rather than moves towards them. And that’s some pretty big thinking.


  • A Pictorial Manual on Computers, 1957

    JF Ptak Science Books  Quick Post

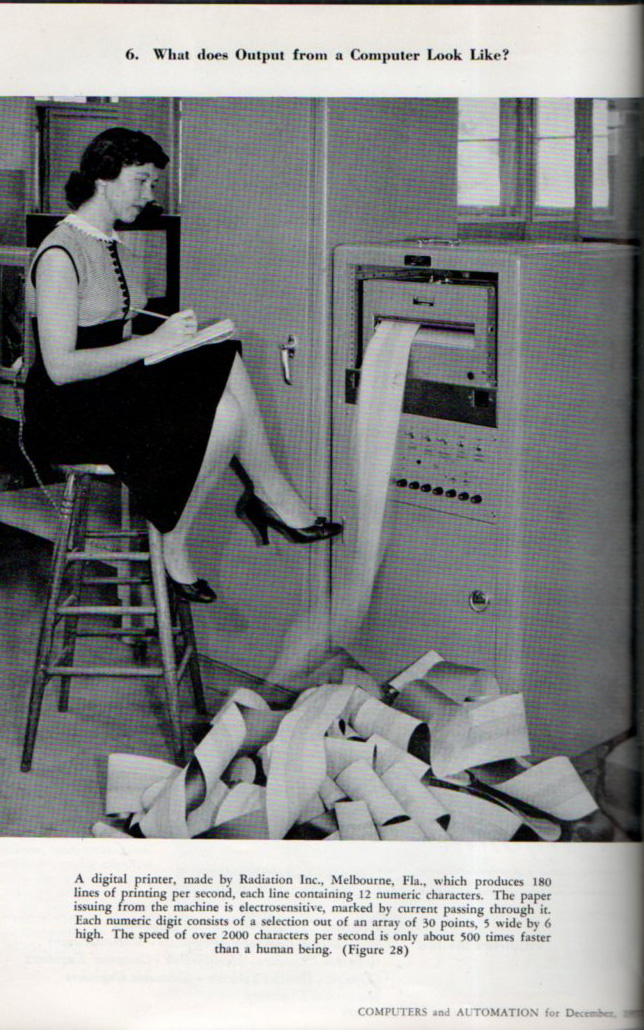
    Computer look like 9224

    This lovely illustrated story appears in the December 1957 issue of Edmund Berkeley’s Computers and Automation, which was the world’s first semi-popular magazine devoted to the computer.  The article is divided into questioned sections, including:

     “What is ‘Operating a Computer’ Like?,  showing the “new Computing Center” at the famous Moore School of Electrical Engineering at the University of Pennsylvania, the place where most of modern computing in America was born in 1944/5/6. 

    ·Posted by :

    ·in:

Recent Posts

Archives

Categories