JF Ptak Science Books Quick Post
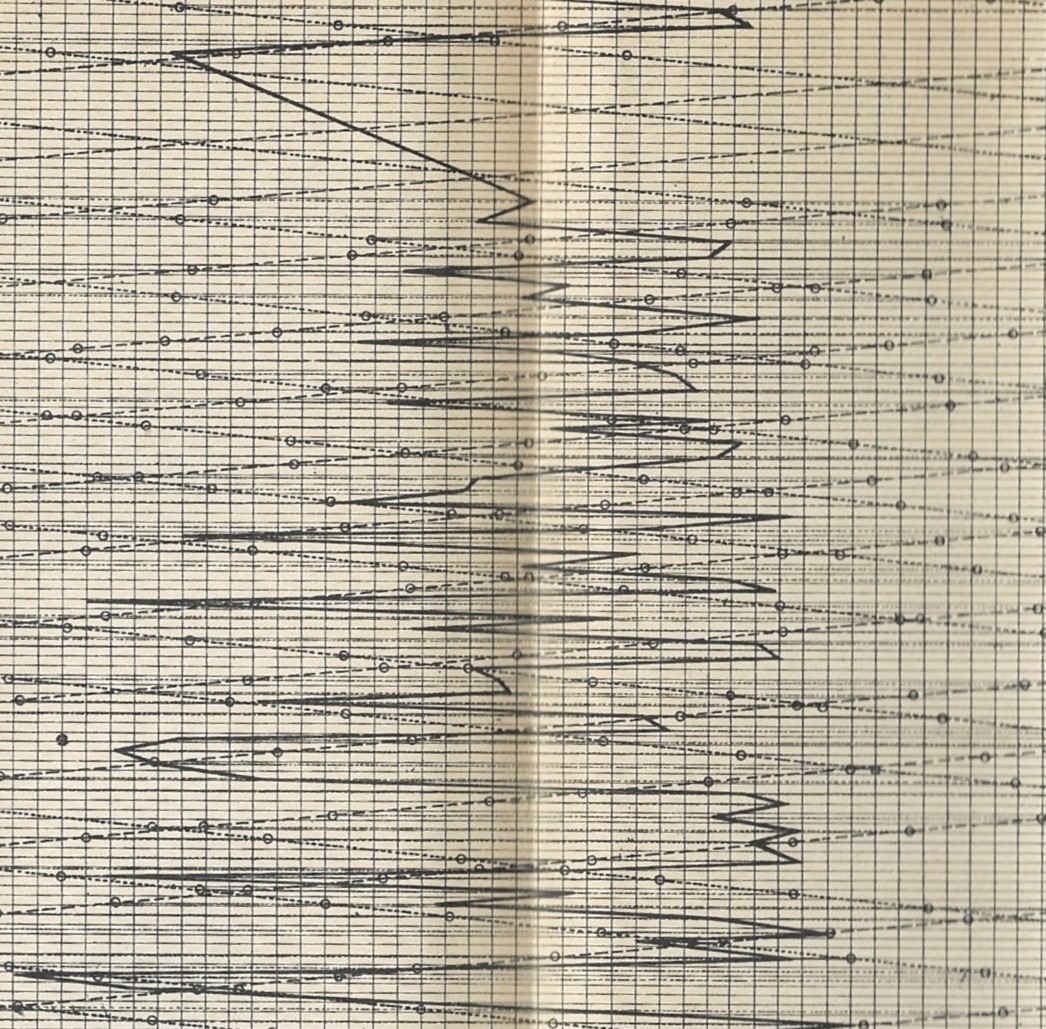
It has been a while since I’ve added a post to the History of Lines series, but today I’ve found a good one: a graphical display of the limited comings-and-goings of the cable tram on the Brooklyn Bridge in 1888. The bridge–still not yet quite the “Brooklyn Bridge”, but the “New York and Brooklyn Bridge”–was open at this point for only five years, still relatively new. and this chart shows the power expense and general time table of the small train that ran pedestrians from one end of the bridge to the other. It wasn’t a continuously moving cable train, and had regular departure times. In any event I’m happy to display the complicated and not altogether clear display of the data associated with the train:
And the full display, with legend and explanation:
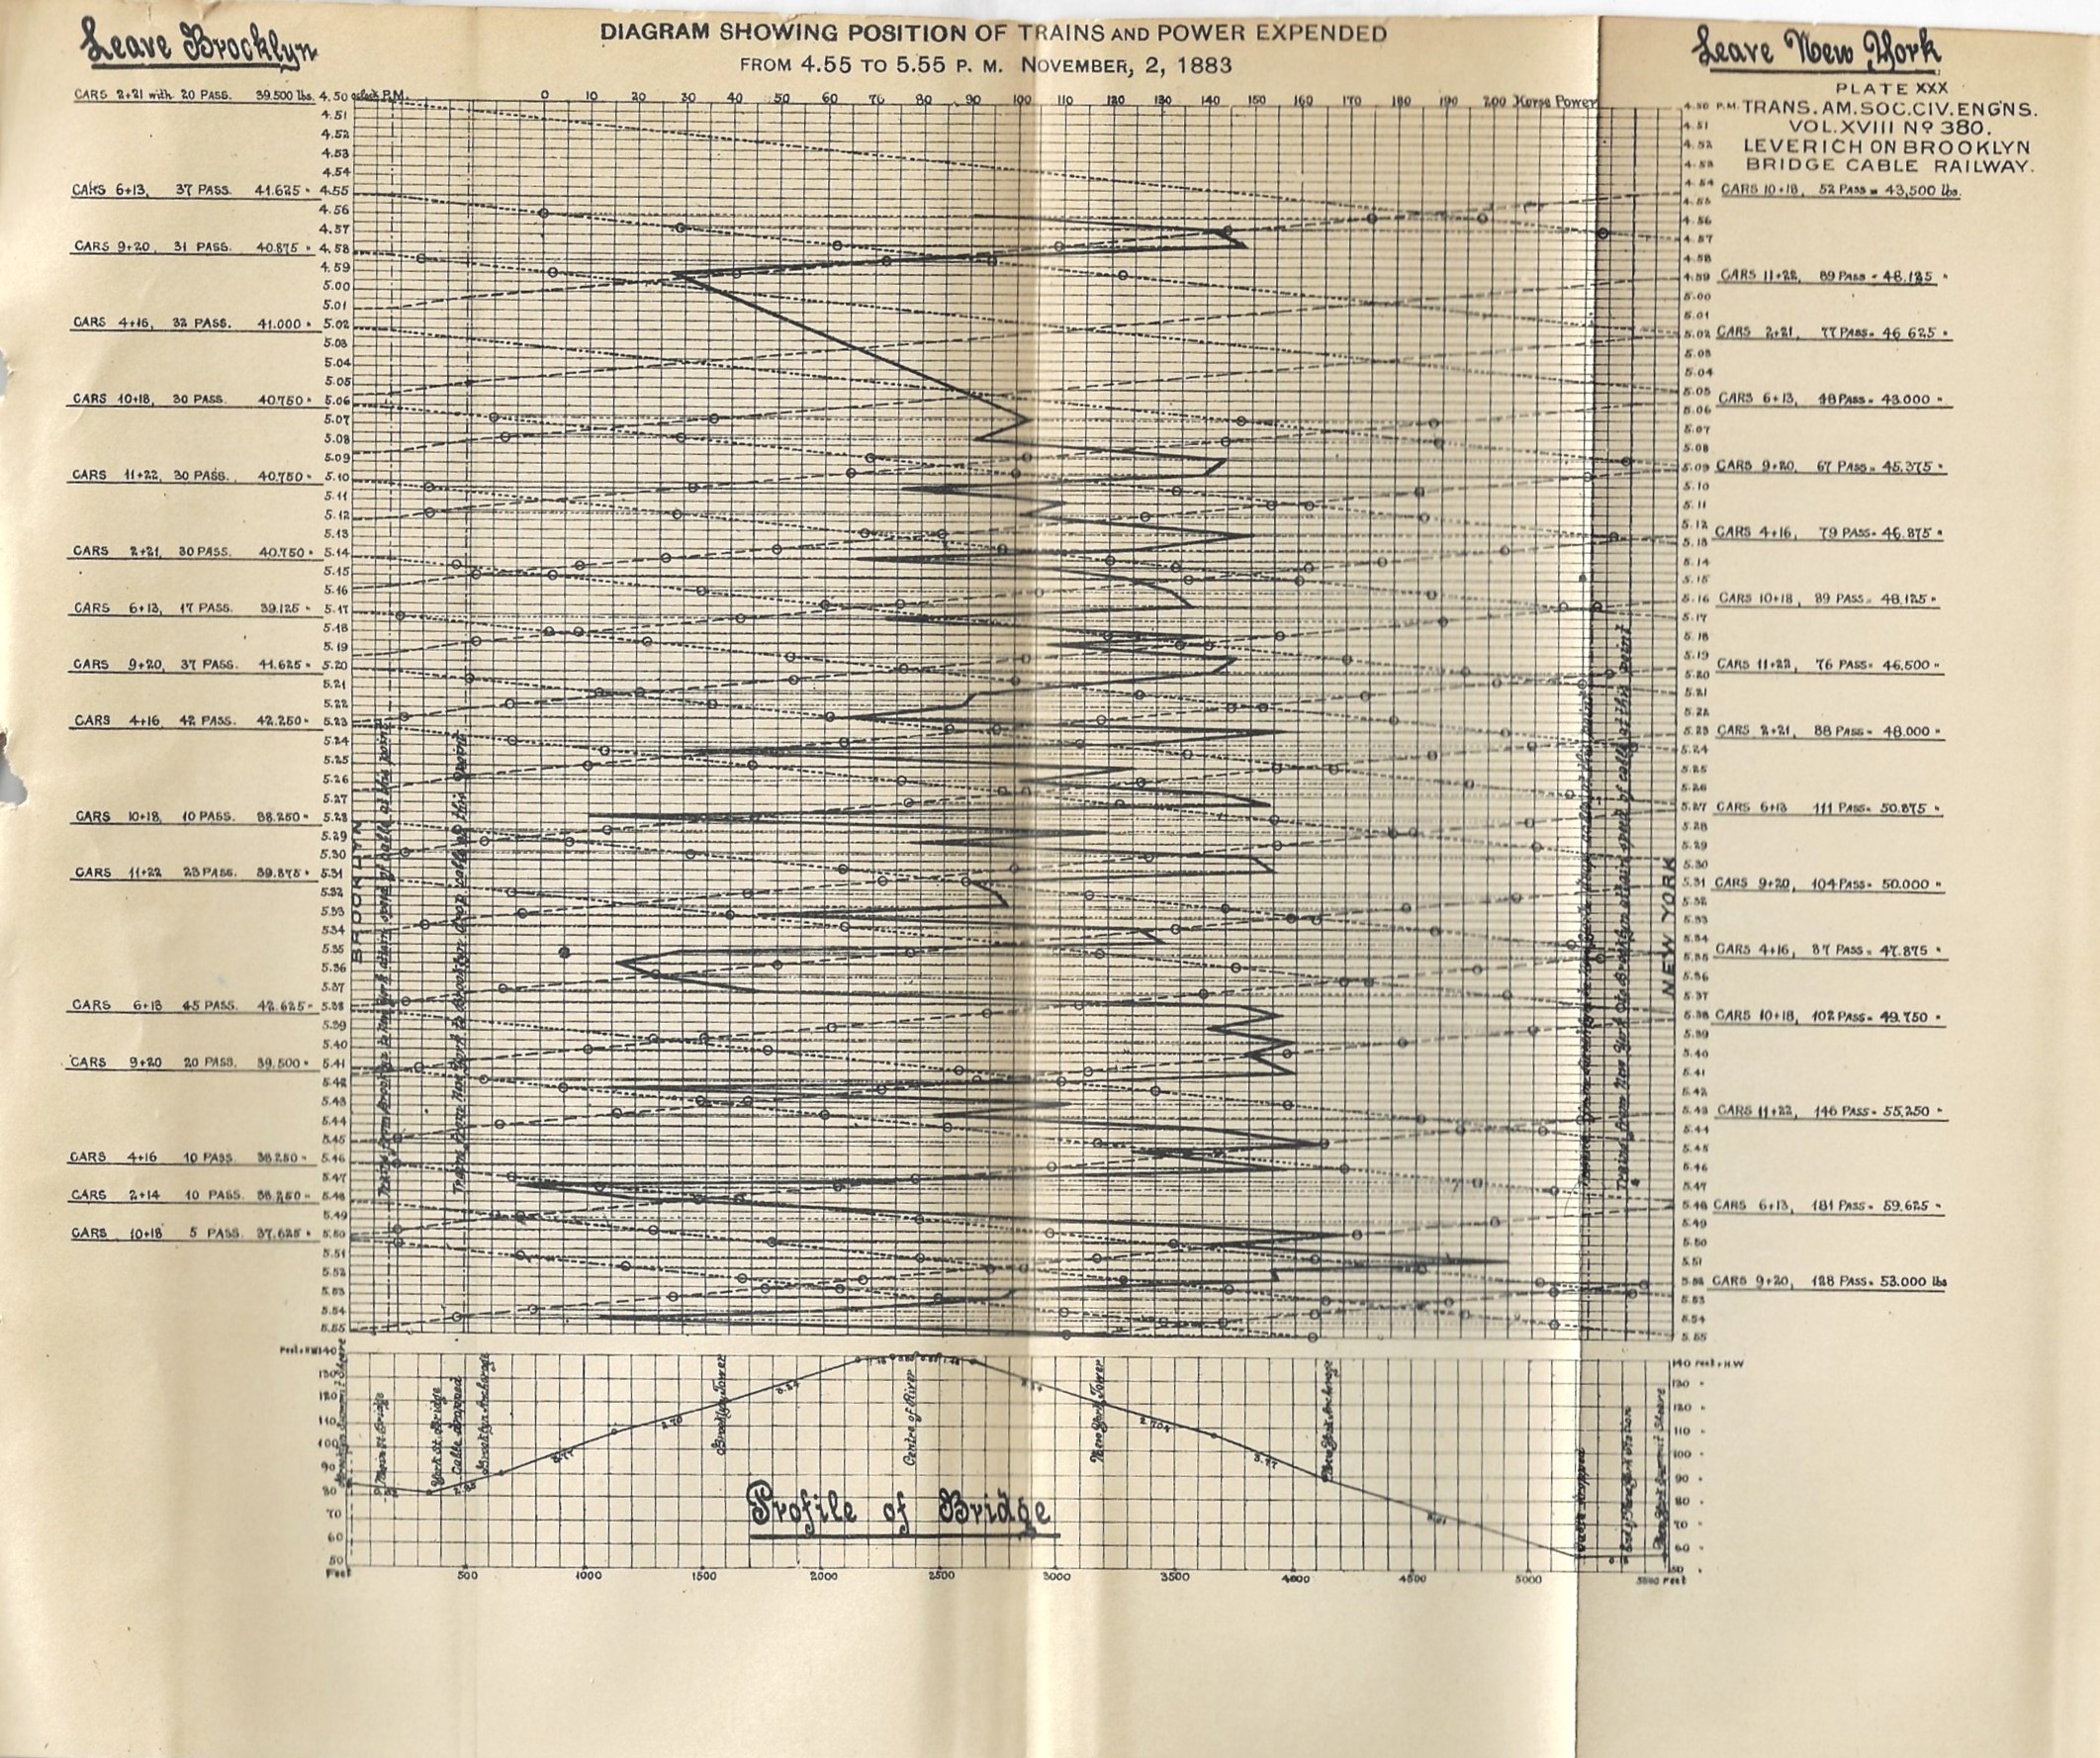
Source: G. Leverich, “The Cable Railway on the New York and Brooklyn Bridge”, from American Society of Civil Engineers, Transactions, vol XVIII, March 1888, #380, pp (67)-102, plates 4-30 (25 folding plates of various aspects of the power train and fittings, complete).