JF Ptak Science Books Quick Post
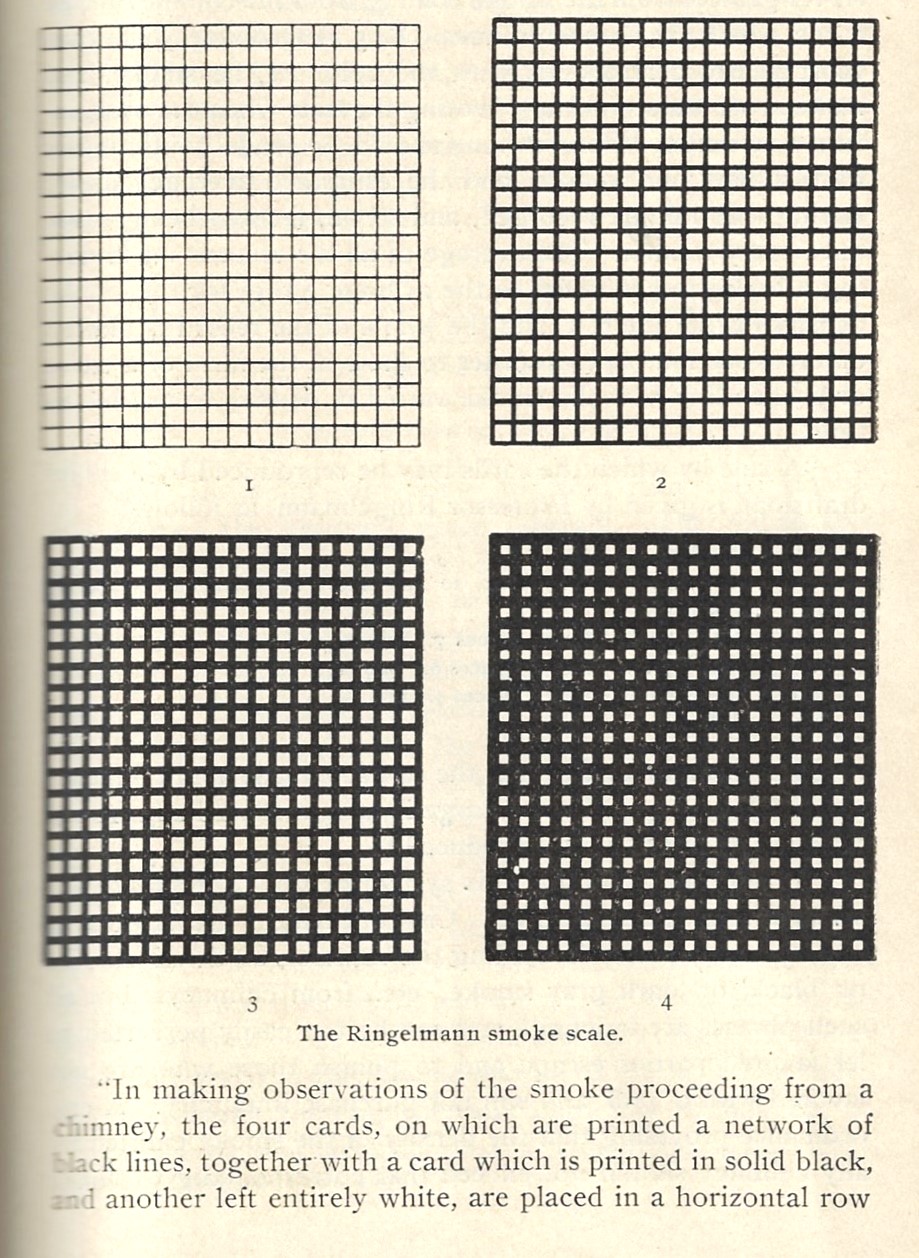
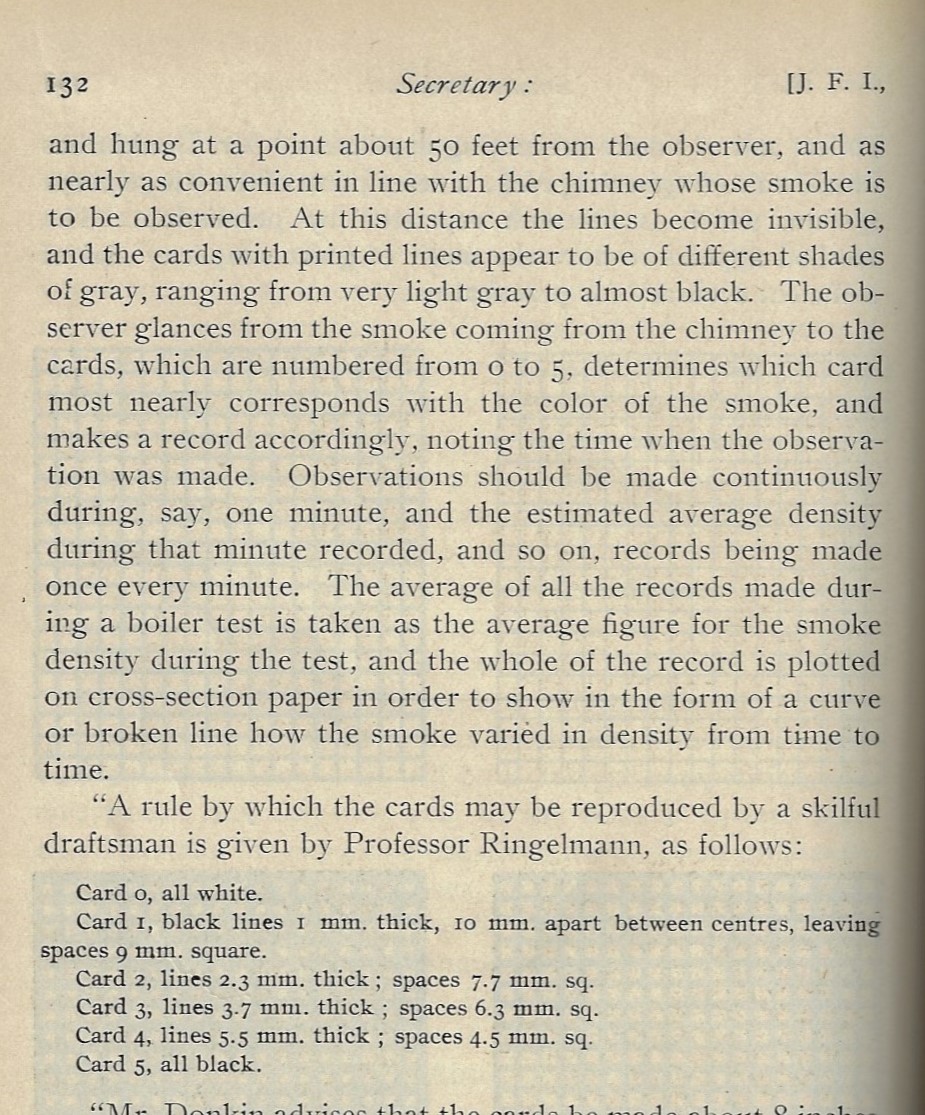
This is one of those things that you’d probably not properly think about until you had to do so–a quantitative measuring device to classify smoke (or visible emissions). In a way it reminds me of Mr. Howard who was the first to classify clouds in a scientific way in 1803–surely you’d think that the great classifiers like Aristotle & Co. would have done this over the centuries, but evidently the moving floating mountains escaped scientific classification until relatively recently. Is the same true of the cloud’s distant cousin, smoke? And what about classifying fog? I don’t have the answers to this tonight as its too late to figure it out right now, but I’ll return with the answers and correctly update this post. In the meantime, please find below the last part of a two-part article that appeared in the Journal of the Franklin Institute1 in which the organization and classification of smoke by Max Ringlemann is discussed and explained. It seems as though there is a slightly earlier publication of the scale in Engineering News in 1897, though I haven’t yet (again!) found the original article by Ringlemann himself. (“In 1897 architectural engineer Maximilien Ringelmann developed smoke charts to allow observers to contextualize observable smoke into a scale of known gray. Lighter smoke indicated fewer particulates and more water, while the darkest of smoke was of grave concern. The charts were posted outside of factories, providing a very public method of environmental monitoring and awareness.”–Science History Institute, https://www.sciencehistory.org/ringelmann-smoke-charts.)
It is interesting to note that a paper published by the Bureau of Mines of the U.S. Department of the Interior in 1967 employed the Ringlemann scale pretty much as we see it below.
There is also an interesting article that addresses the use of the Ringlemann scale in regards to discussion of air pollution:
- “ Dark smoke – an introduction to air pollution control (smoke) regulations “(PDF). Hong Kong: Environment protection department, Hong Kong. Retrieved 31 August 2018.
Notes:
1. William H. Thorne, “The Smoke Nuisance and its Regulation…”, JFI, February 1898, vol 145, pp 401-442 and pp 17-59 (same volume, different number).