A Daily History of Holes, Dots, Lines, Science, History, Math, Physics, Art, the Unintentional Absurd, Architecture, Maps, Data Visualization, Blank and Missing Things, and so on. |1.6 million words, 7500 images, 4.9 million hits| Press & appearances in The Times, Le Figaro, Mensa, The Economist, The Guardian, Discovery News, Slate, Le Monde, Sci American Blogs, Le Pont, and many othr places… 5000+ total posts since 2008.

Big Time Big Bombs–Great Infographic, 1917

JF Ptak Science Books   Quick Post 
 
Follow Me on Pinterest

I don’t often see graphical displays of quantitative data utilizing quite so many images of shells, even when the image is comparing ammunition production.  This striking example is found in The Illustrated London News for July 15, 1917. 
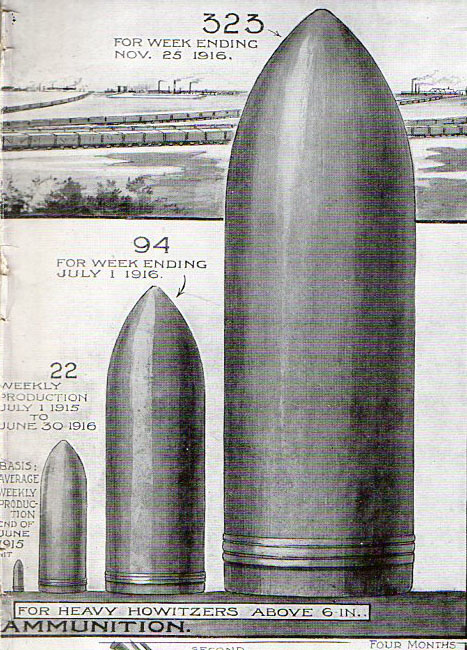
 

Bombs994

Recent Posts

Archives

Categories