JF Ptak Science Books LLC Post 699 Blog Bookstore
See also my related posts:
The Worst Picture of Santa, Ever
and
Deathly Equality: Liberty
This is a simple ad for a butane-based lighter (appearing in LIFE magazine for 18 December 1950), lighting the
way down Cigarette Road. Actually,
it was more a highway than a road, and a superhighway at that. Government-sponsored warnings about tobacco health issues was still more than a decade away: medical doctors were part of the advertising machine, as were actors (including RWR), sports figures, and virtually anyone else with a mouth.
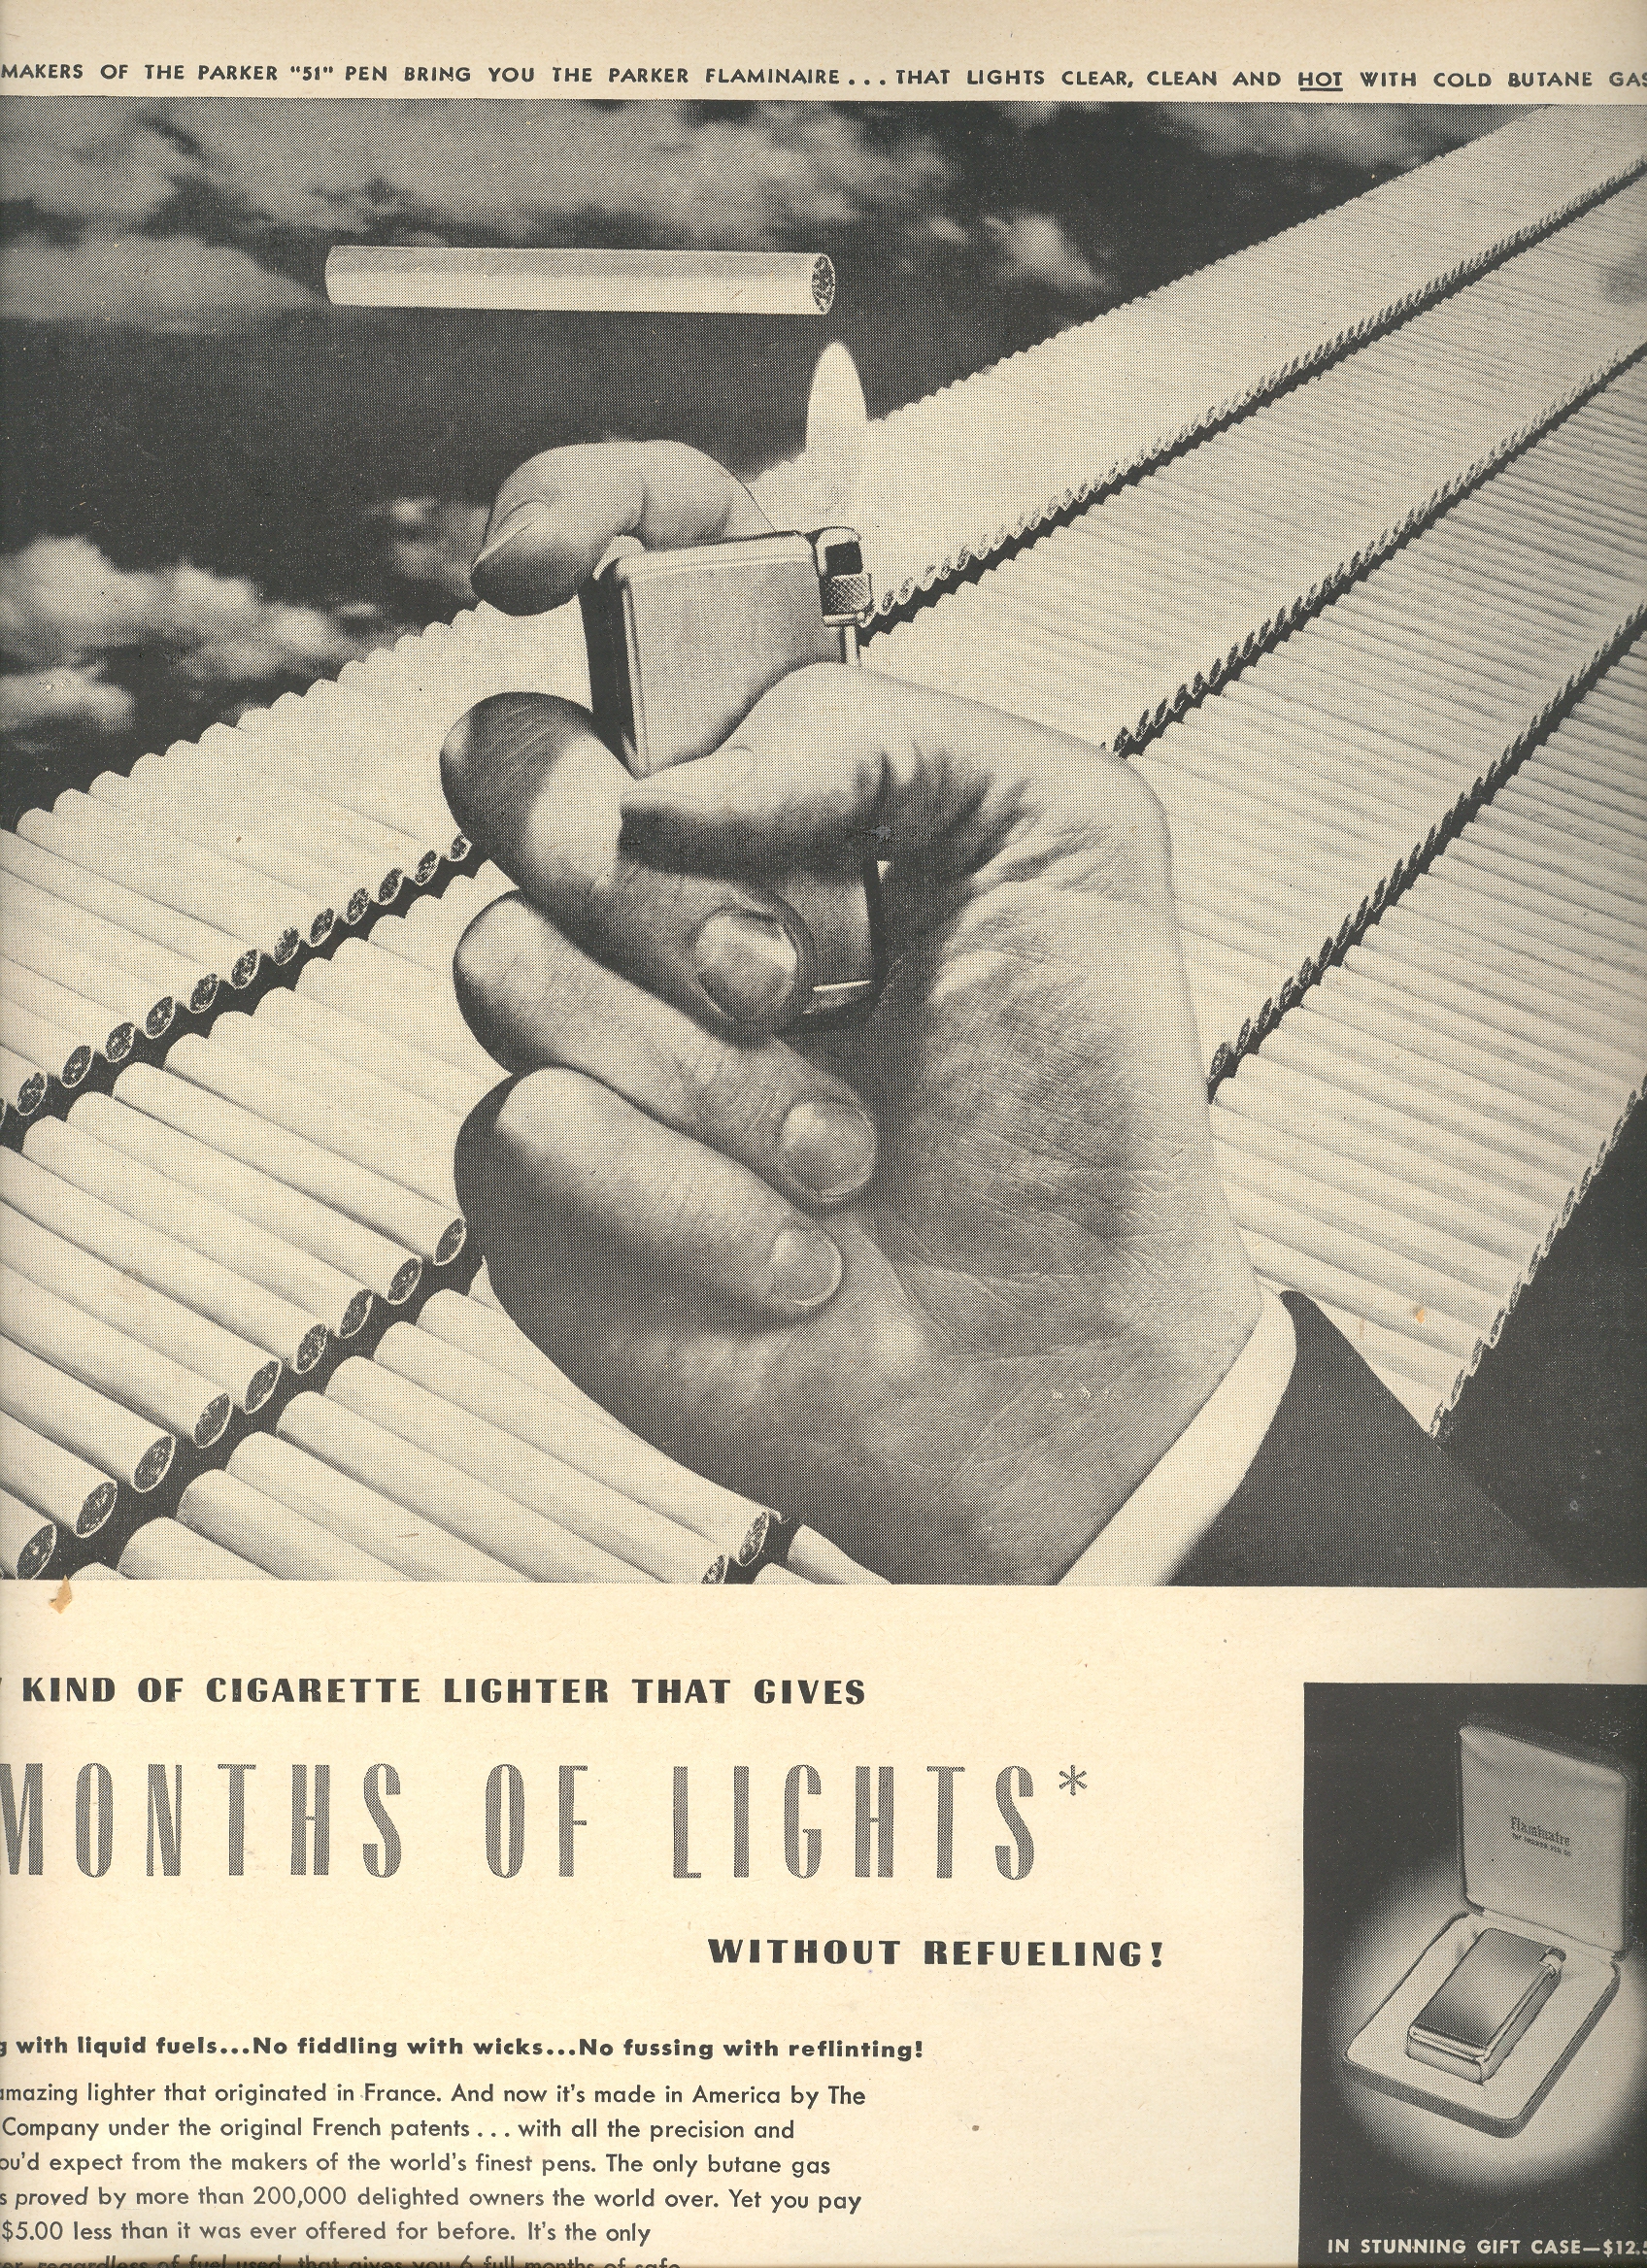 It seems to me that there are about 300
cigarettes in this ad, and that looks like a lot—point of fact though is that
in 1950, the average American (of 18+ years) smoked about 3,522 cigarettes a
year, which means about 10 cigarettes a day for everyone in the country. Not 10 per smoker; 10 for everyone in the entire country, smoker
or not, who was over 18 years of age.
50 cigarettes or so—that’s equal to this line of cigarettes being smoked every
six days.
There were virtually no brakes.
Even Santa (a pipe smoker) got into the business. This was a standard, acceptable, vanilla-packaged advertisement.

1900–2007
First number is total consumption in billions; second number
is per capita yearly consumption for people 18+.
1915 17.9 285
1920 44.6 665
1925 79.8 1,085
1930 119.3 1,485
1935 134.4 1,564
1940 181.9 1,976
1945 340.6 3,449
1950 369.8 3,522
1955 396.4 3,597
1960 484.4 4,171
1965 528.8 4,259
1970 536.5 3,985
1975 607.2 4,123
1980 631.5 3,851
1985 594.0 3,461
1990 525.0 2,827
1995 487.0 2,515
2000 430.0 2,092
2005 376.0 1,716
2007 360.0
Source: Tobacco Outlook Report, Economic
Research Service, U.S.
JF Ptak Science Books LLC Post 699 Blog Bookstore