JF Ptak Science Books Post 2456
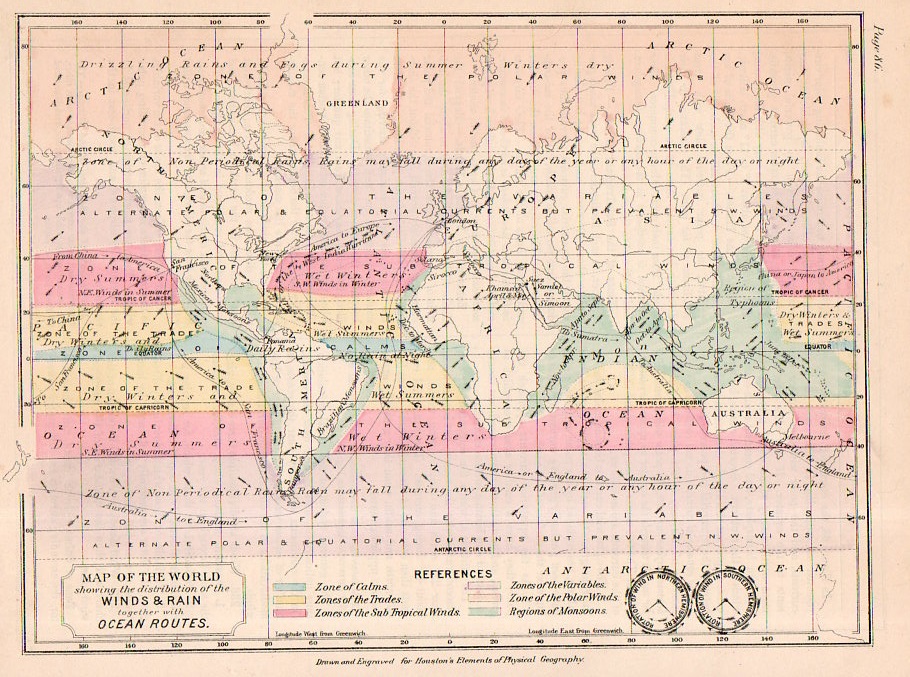
The idea of a global map1 of the winds was still something relatively new when this map was published in 1886. It represented a state-of-the-winds accomplishment and was published in the popular press–just a century earlier the idea of the completeness of a map of this sort for such a variable as The Wind was still of great speculation. But aside from the great scientific achievement of being able to display such enormous quantities of data in this way, the map has its artistic element, though almost all of this is done by the reader. For example, out-of-context this map depicts the delightfully- and disturbingly-named Equatorial Calms and Doldrums, Calm of Cancer, Calm of Capricorn, Zones of the Trades, Zones of the Variables (!), Zones of the Polar Winds, and Monsoon Regions.
- This map is available for purchase via the blog’s bookstore, here.
Really though this small (7″ x 9″) map is impressive for showing so very much big information in a small place: in addition to the poetic calms and doldrums, it shows areas of drizzle and fog, areas that have snow in spring and autumn, and the periodicity of rain.
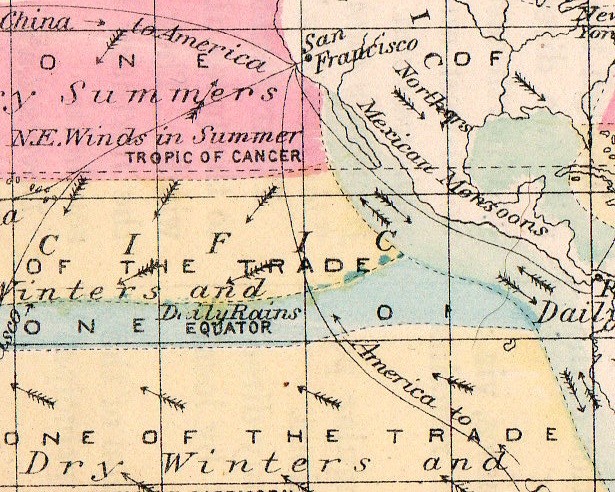
It naturally shows trade routes (so dependent upon the winds) and then goes on to display prevailing winds and then to name some of the the important ones, including the Northers (central North America), Simoon (Arabian Peninsula), Sirocco (Mediterranean), Solano (Spain), Chamsin (Egypt), and Harmattan (West Africa).
It is a lovely map that becomes even more so the more closely you look at it.
Notes
1. “A world map from 1891 showing the distribution of the winds and rain, together with ocean routes”, by Edwin J. Houston, and published in The Elements of Physical Geography (Philadelphia, PA: Eldredge & Brother, 1886). 7×9″ Hand-colored lithograph.