JF Ptak Science Books Post 2794
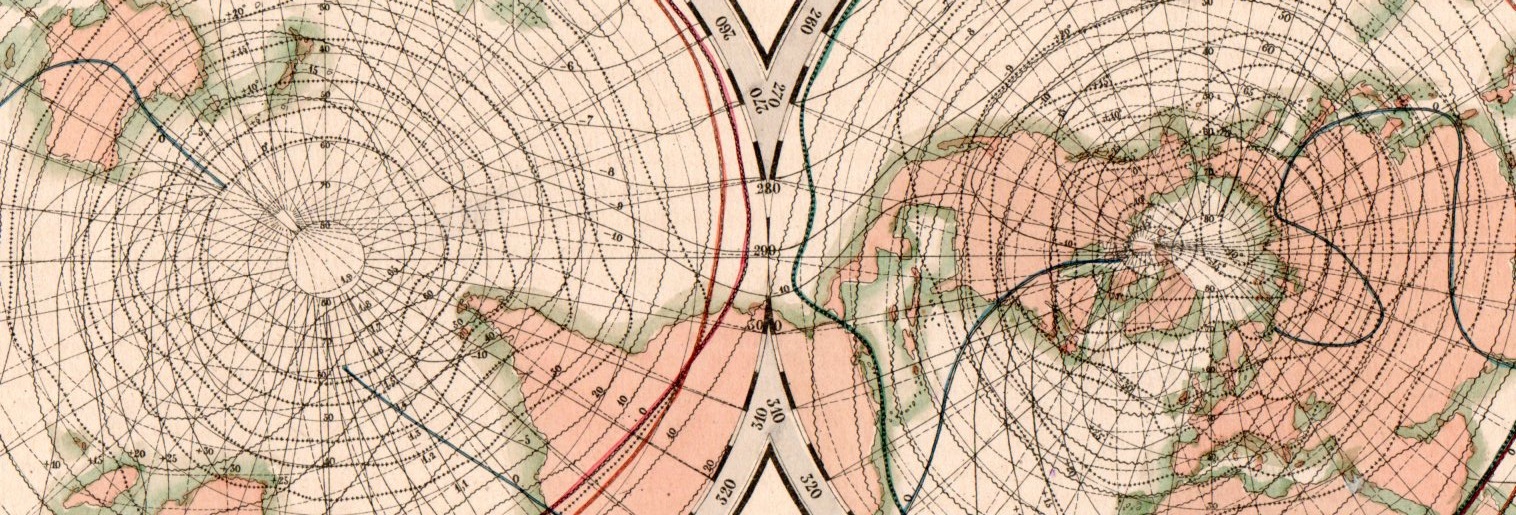
This beautiful network of lines tells the early story of weather in cartographic form. They appear on Karte der Isothermen, Isoklinen, Isogonen und Isodynamen mit der Magnetischen Meridianen, and was published in the atlas to accompany the best-selling encyclopedic presentation of the natural history knowledge of the world to that time, Baron Alexander von Humboldt’s Kosmos, which was published over a period of several from 1845-1862. The map demonstrates and visualizes climatic information showing isothermes, isoclines, isogones and isodynamics, with the magnetic meridian.
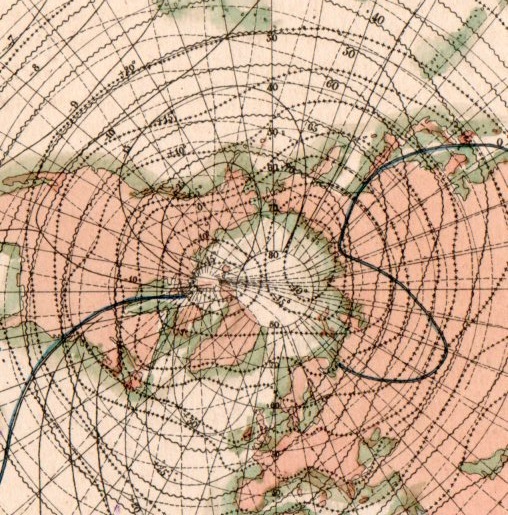
[This is a detail of the Northern Hemisphere section of the double-hemisphere map, which is reproduced below.]
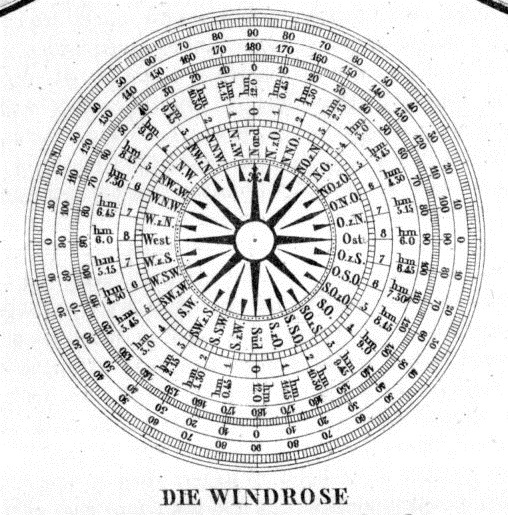
At bottom there is also a beautiful 32-point wind rose: