JF Ptak Science Books Quick Post [Series on the Artistic Display of Data]
This striking comparative visual display of data appears on the front cover of Scientific American for 2 March, 1907, and relates the weekly consumption of gas in the U.S. in an enormous imaginary storage facility measured against several iconic structures. (I think it would’ve been interesting to have an inset showing the yearly consumption…) People would not doubt immediately forget the actual numbers of consumption, though they’d be hard-pressed to forget the comparative imagery of the number.
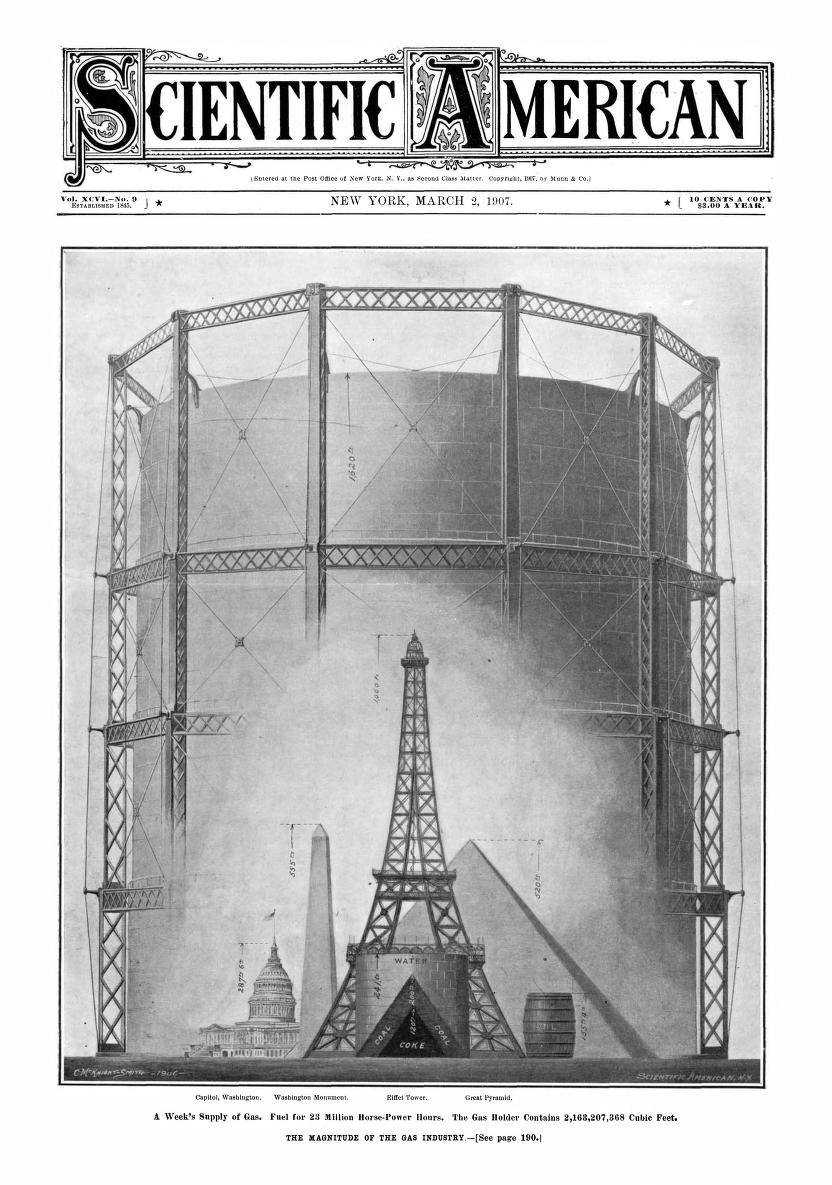 “A comparison of the yearly production of gas is unwieldy, owing to the lack- of objects with which to compare.
The Eiffel Tower would look lost compared with a gasometer 4,556 feet -high, so we have taken a week’s supply,
which amounts to 2,163,207,368 cubic feet. This enormous bulk is shown in our engraving stored in a huge gasometer
1,620 feet high and 1,350 feet in diameter. The water is contained in a tank 241 feet high and 268 feet in diameter.
The raw materials are also of a bulky nature. The coal would form a cone 268 feet across at the base and 200 feet high.
The coke also forms a cone 120 feet high and 160 feet across the base. The oil would fill a barrel 155 feet high and
122 feet in diameter.”–Scientific American, 2 March 1907