JF Ptak Science Books Quick Post
There are many more complex, complicated, and data-rich displays like this one presented on this blog (just access the “Display of Quantitative Info” section), but there is a certain attraction with this simple-ish one. It is the design of W.R. Robinson–an artist with a fine touch, which is on display here more for the employment of empty space than lines–and gets across the information pretty easily and quickly. In any event, here it is, displaying the relative strengths of the world’s navies ten years after the end of WWI, which at that point was still the great War, “World War I” waiting to be invented in another ten years when there was a needed distinction between that world war and the newest world war.
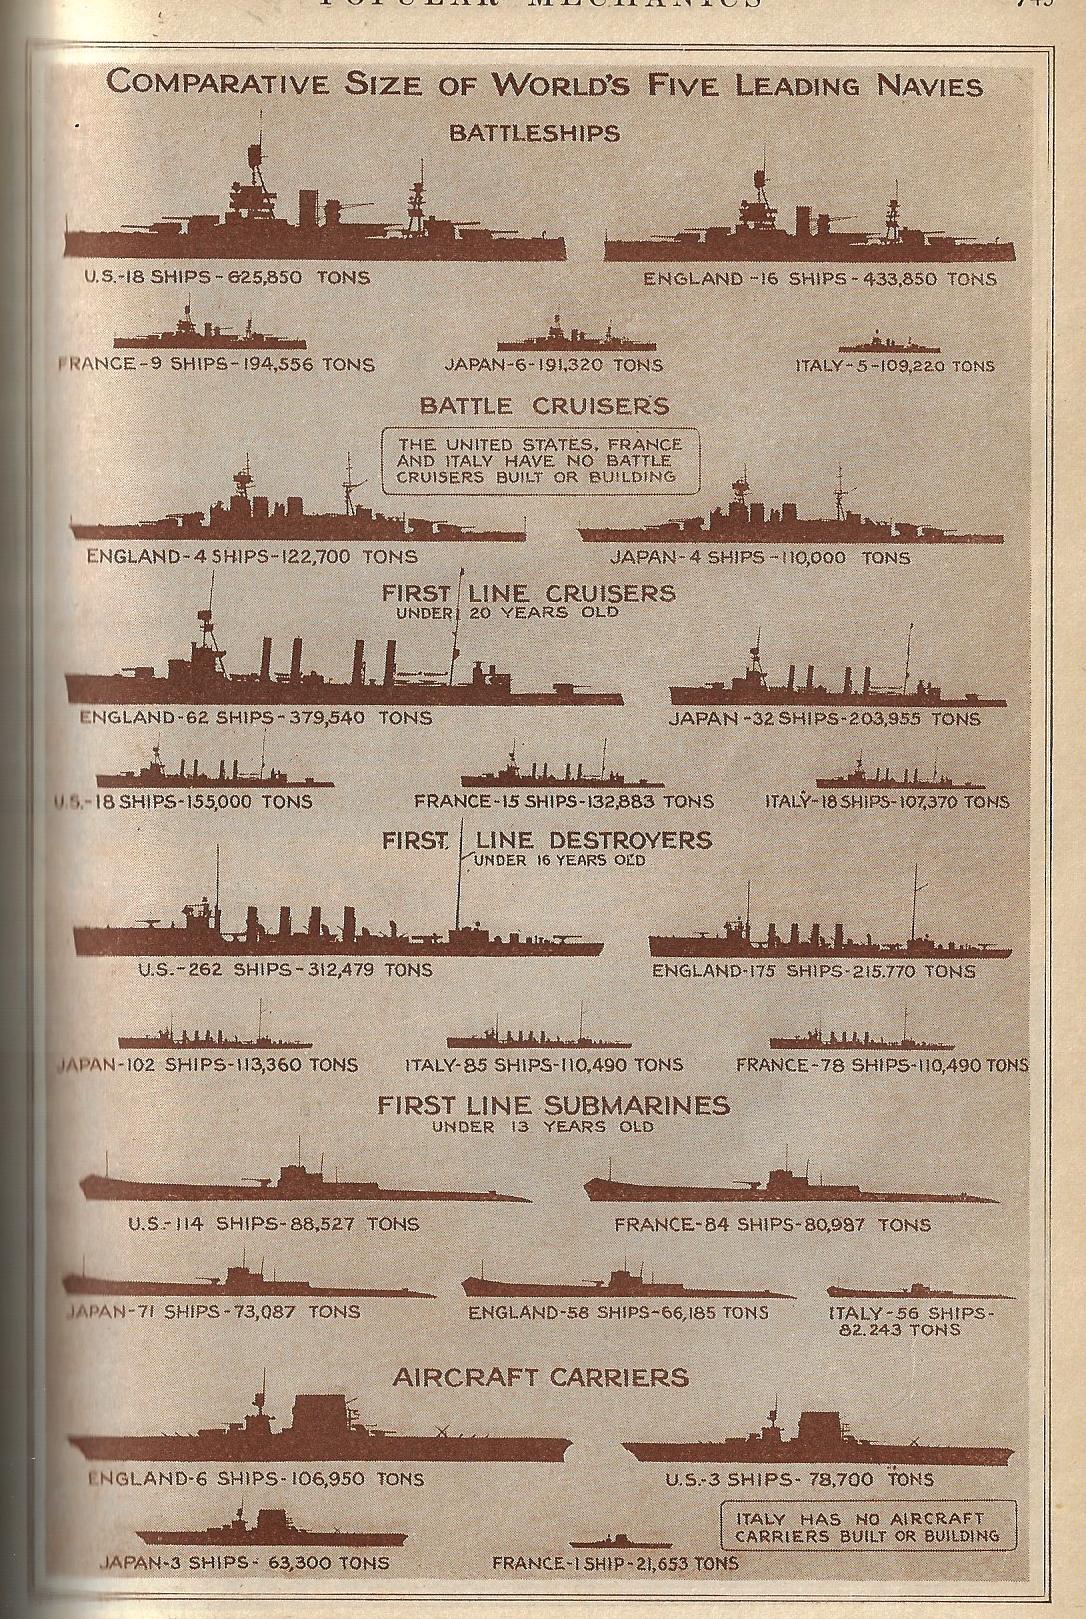
[Image source: Popular Mechanics, June, 1929.]