A Daily History of Holes, Dots, Lines, Science, History, Math, Physics, Art, the Unintentional Absurd, Architecture, Maps, Data Visualization, Blank and Missing Things, and so on. |1.6 million words, 7500 images, 4.9 million hits| Press & appearances in The Times, Le Figaro, Mensa, The Economist, The Guardian, Discovery News, Slate, Le Monde, Sci American Blogs, Le Pont, and many othr places… 5000+ total posts since 2008.

Data Visualization of U.S. Territorial Populations

JF Ptak Science Books  Quick Post

The following is a relatively prefunctory visualization of data, found in the Scientific American for March 31, 1917. It displays the populations of eight U.S. territories in relation to that of the United States, standing here as a professorial Uncle Sam to somewhat wincing representatives from the territories (including Puerto Rico, the Philippines, Alaska, Hawaii, Panama, Guam, Samoa, and the Danish Islands). 
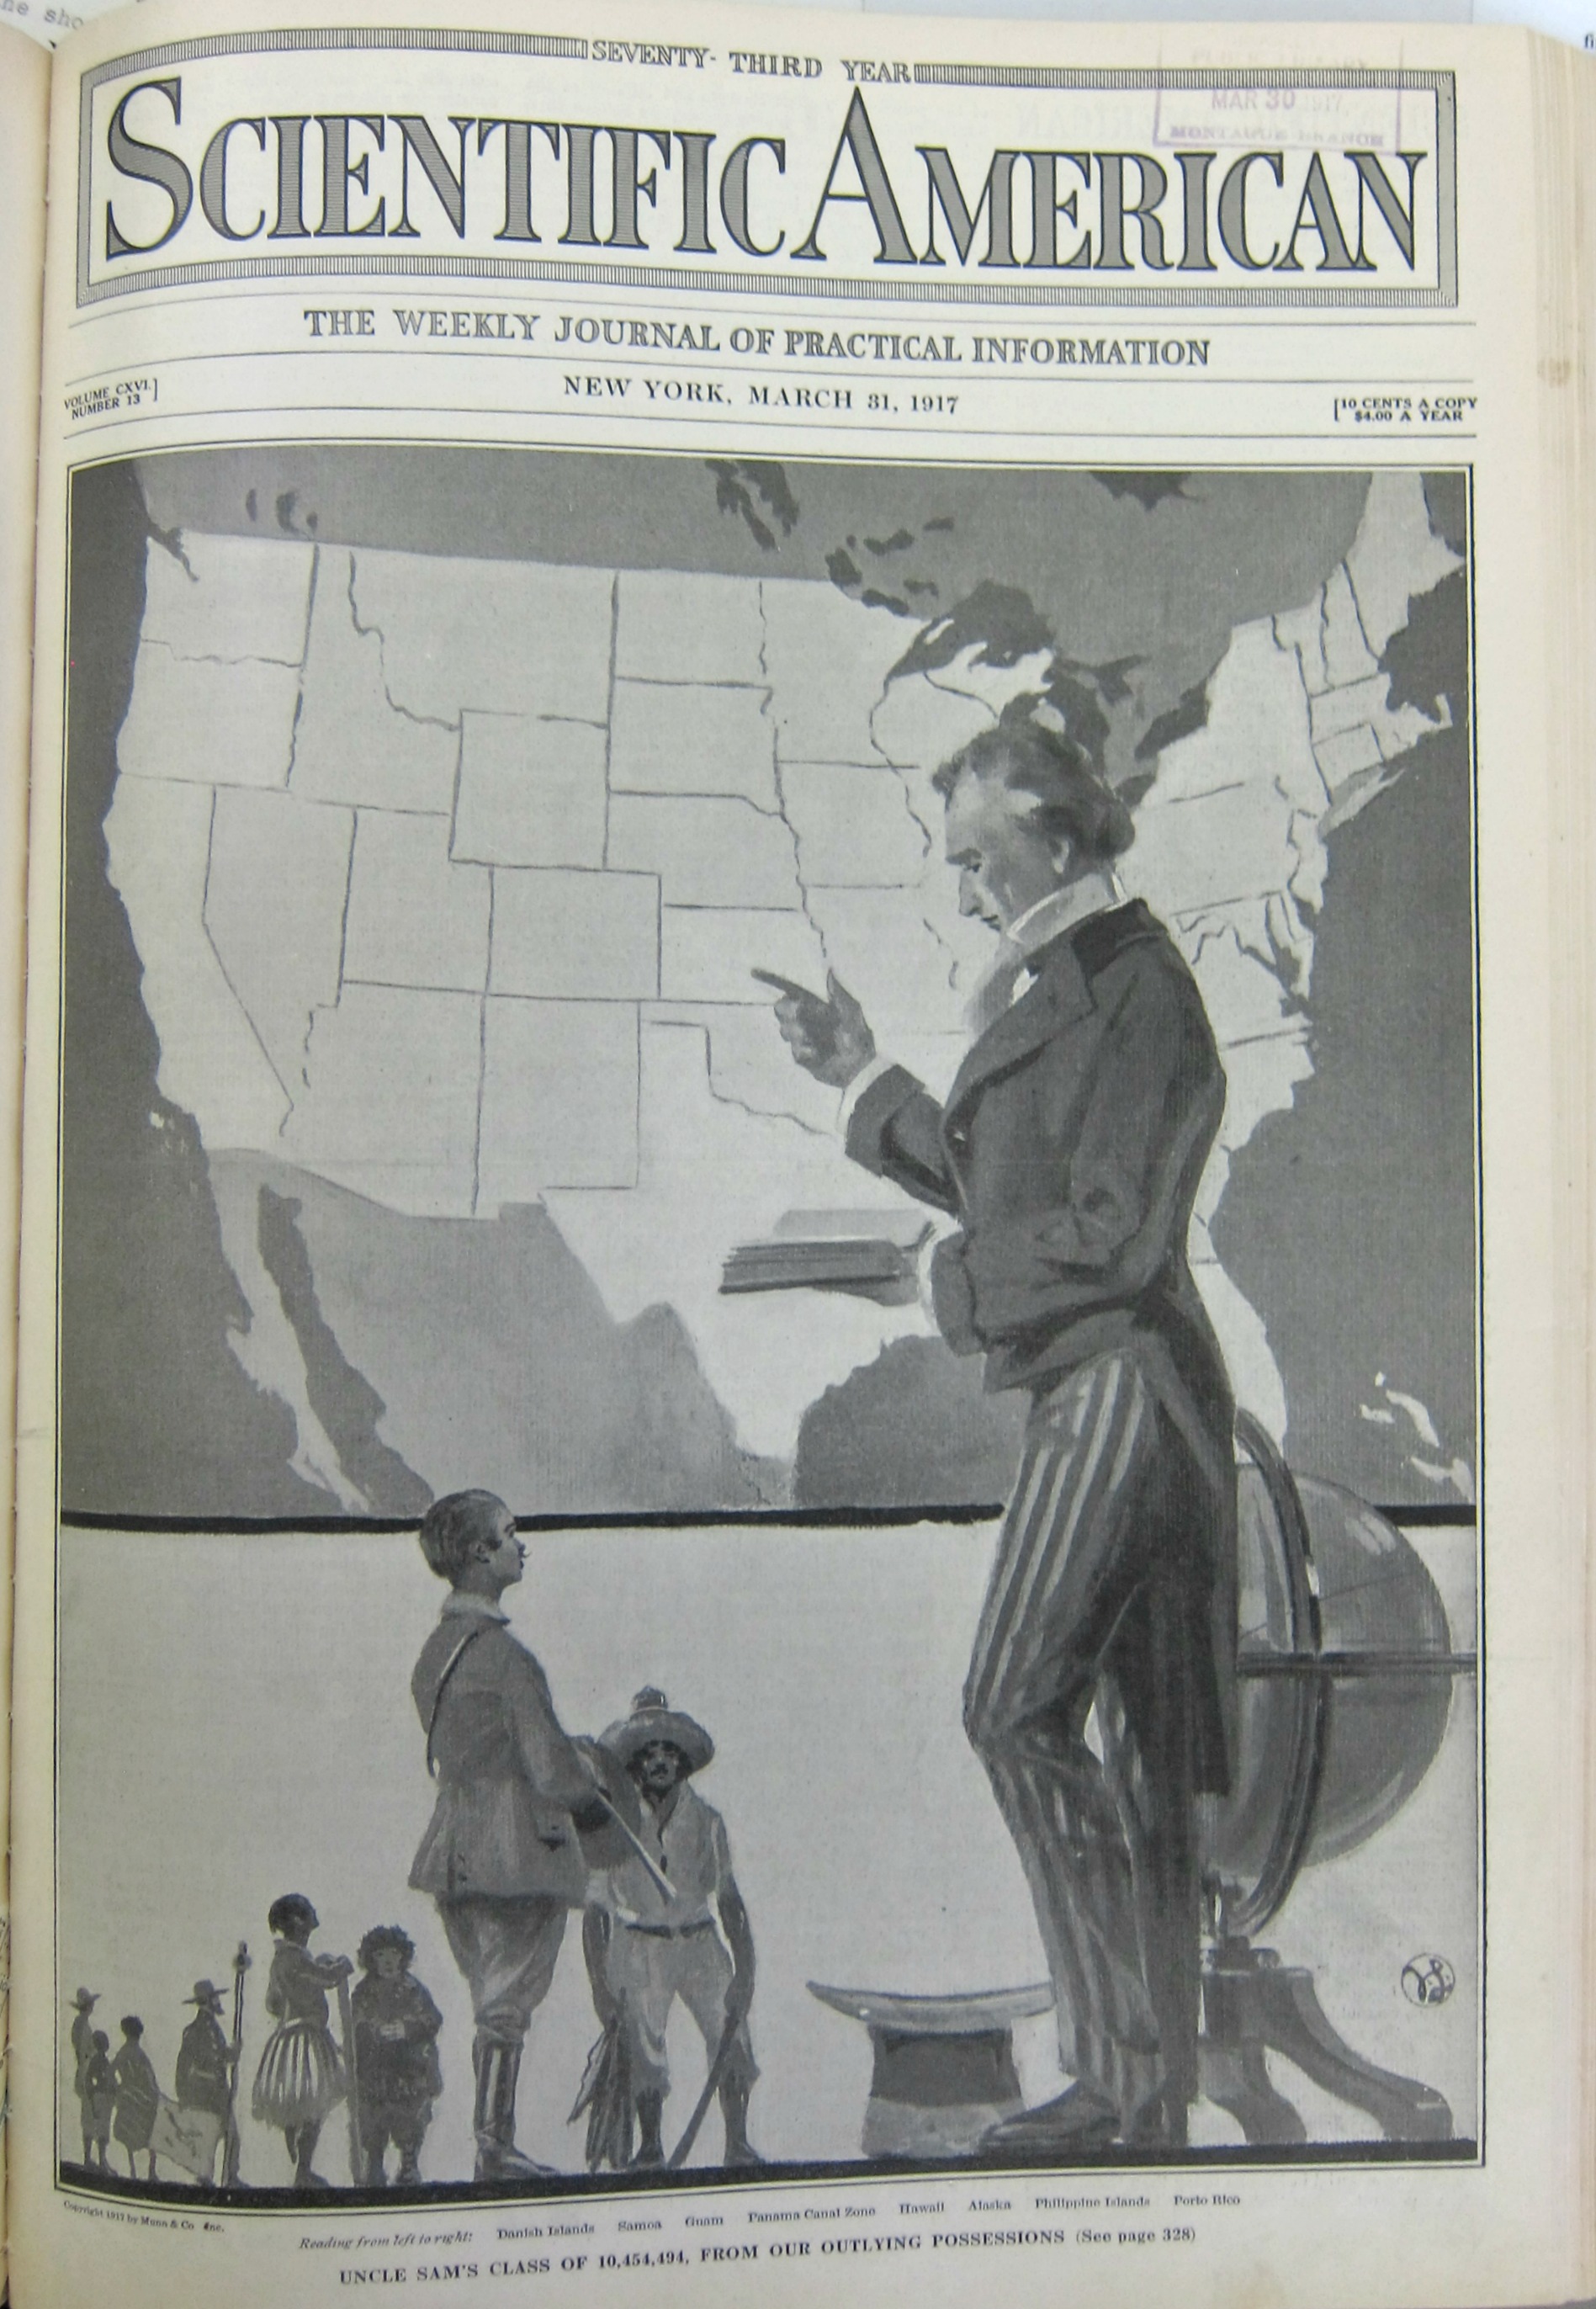
Dataviz U.S. pop territories

[Source: Scientific American for March 31, 1917]

Recent Posts

Archives

Categories