JF Ptak Science Books Quick Post
The History of Lines series
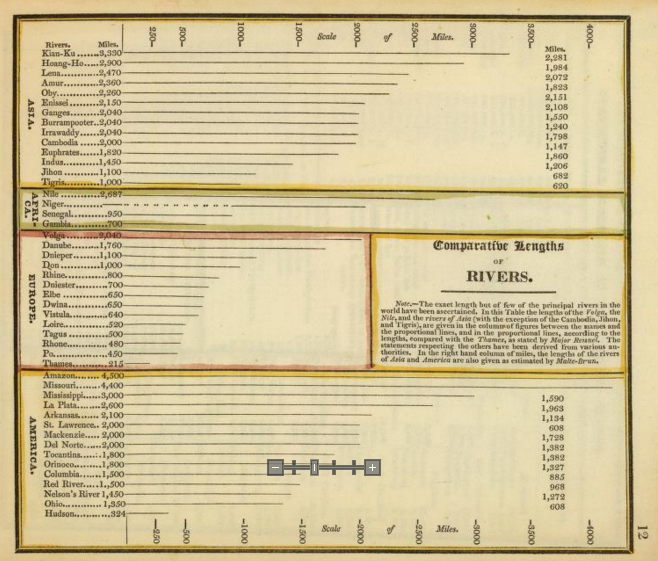
This is another entry in a series of posts on maps and the representation of quantitative data, this one being early in the development of this genre of imagery. The map (a little guy at 5×7″) is from An Atlas Accompanying Worcester’s Epitome of Geography, published in Boston by Hilliard, Gray & Co., in 1828.

[Source: Images of the Hilliard map found at David Rumsey’s map website, here: http://www.davidrumsey.com/luna/servlet/s/xz62g8]
In the 46 river lengths displayed here, 45 have distinct measurements; one–the Niger–does not, or almost does. The indistinct and suggested delineation shows what was know of the river, and what wasn’t, with bits on either side of the middle section (reached and surveyed by the fabulously-named Mungo Park, 1771-1806, at the turn of the century). Much of the Niger wasn’t well known at this point, though it had been plotted in part since antiquity–with all of that the overall length was well approximated (very close to its nearly-2500 mile length, the main river in West Africa). The line/dot combination was an honest approximation of displaying the river’s length, and not often seen.