JF Ptak Science Books Quick Post
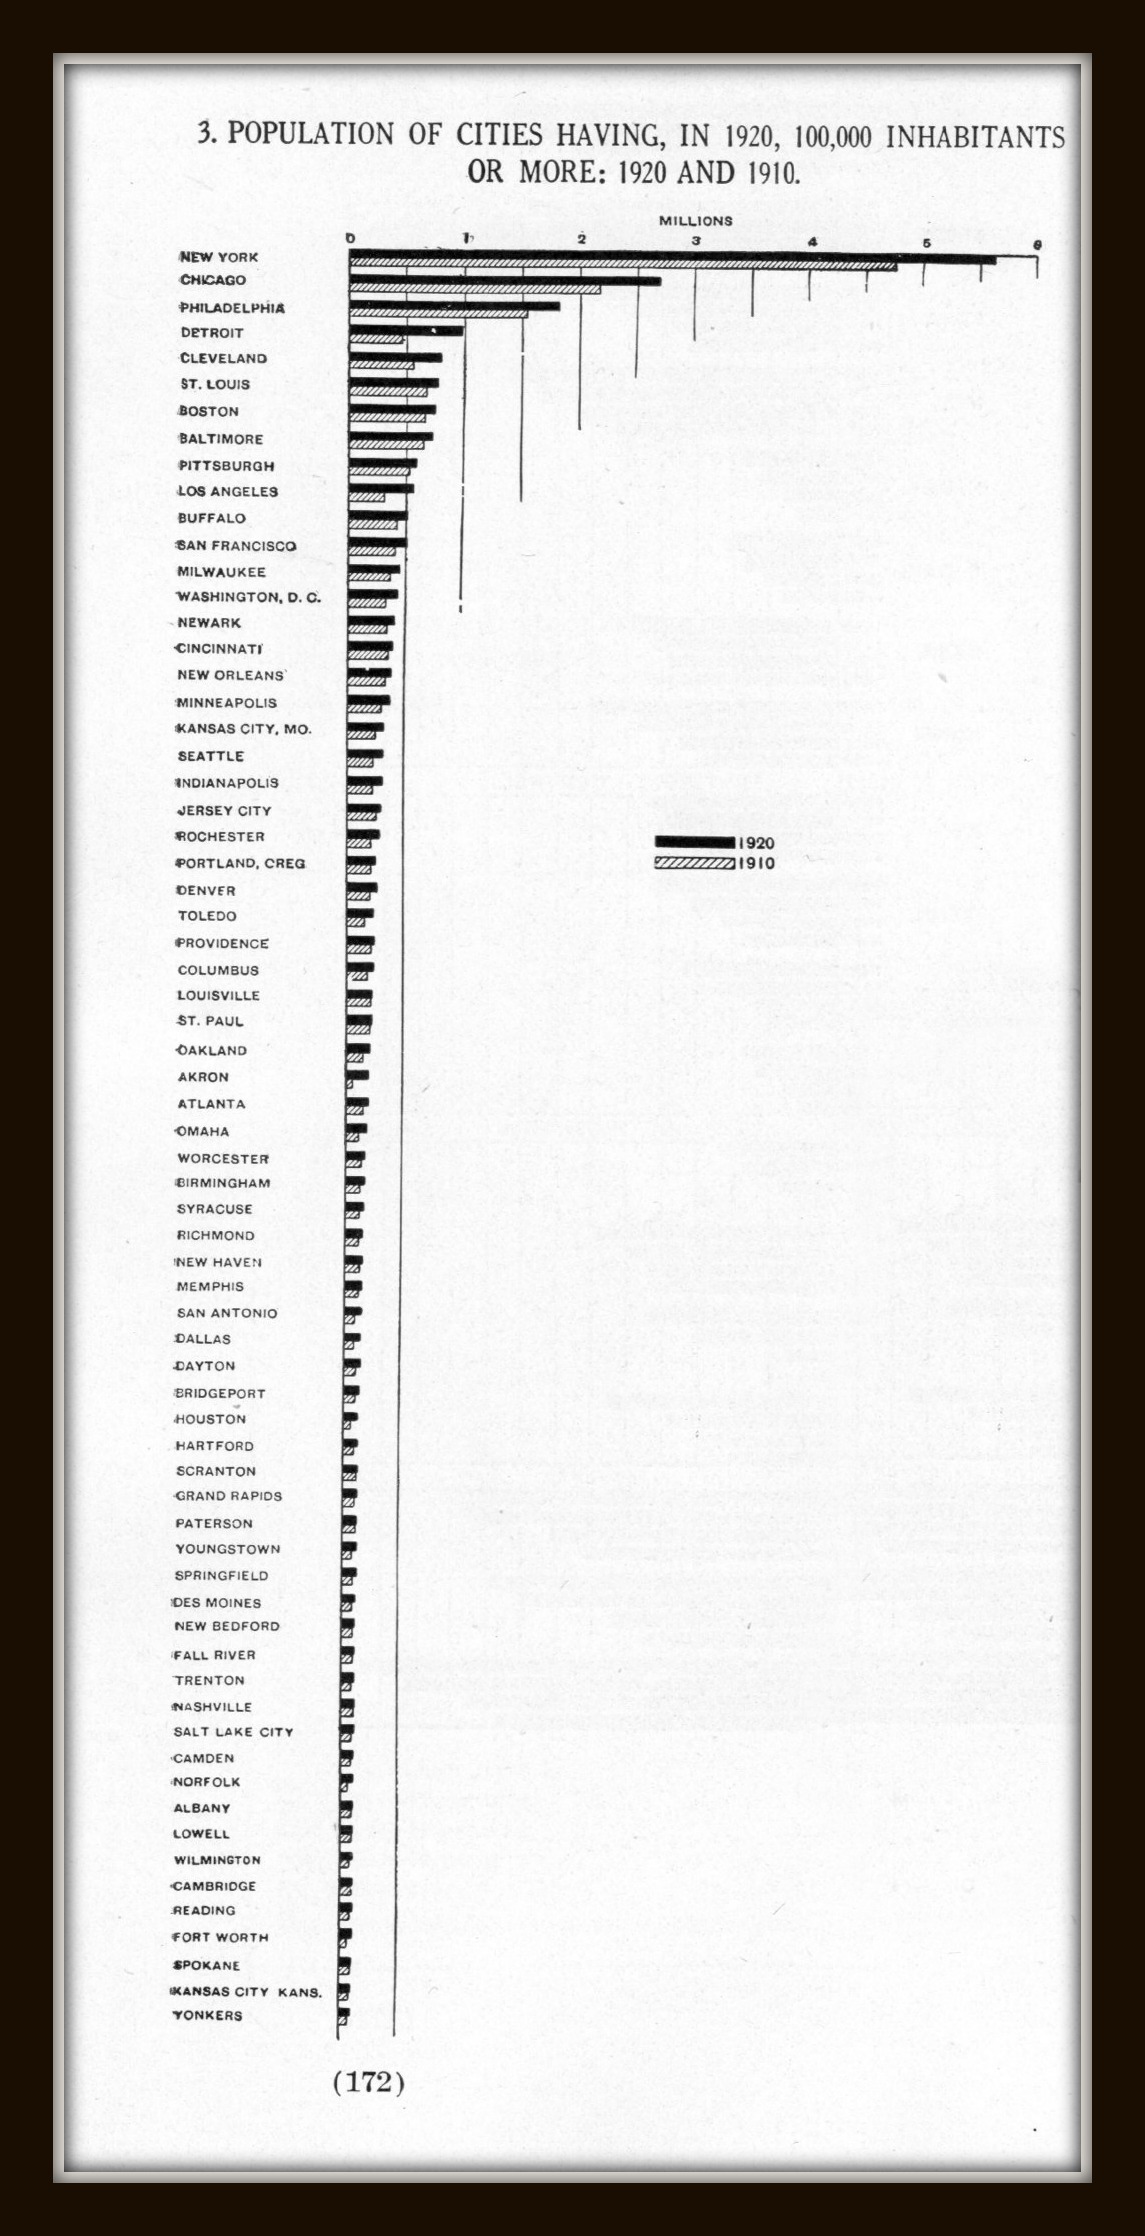
This fine, odd, and aggressively progressive-towards-skinniness of a graph appeared on plate 143 (page 173) in the great series of data visualization classics, the Statistical Atlas of the United States, published in Washington D.C., 1924. It is one of the simplest maps showing the development of the populations (compared to these extraordinary and classic attempts, here), and it is interesting to see where cities stood in 1920 relative to where they are today. For example, Detroit comes up at fourth in 1920, Cleveland 5th, Pittsburgh 8th, Buffalo 10th, Milwaukee 12, Newark 14th, Cincinnati 15th–of these, only Detroit (#19) and Milwaukee (#28) break the top-thirty in the census for 2010.