JF Ptak Science Books Quick Post
Information and Qualitative Display of Data Series
As stated, this is a simple post of an interesting piece of graphical display of data, this time coming from Life magazine, August 28, 1950. It vividly compares the general production of military aircraft for 1949/50 versus what was coming in 1950/1. We can see comparisons for budget, workforce, aluminum, copper, engines, and of course aircraft (trainers, fighters, transports, bombers), and shows the huge difference between the relative peace of 1949 and the beginning of the Korean War two months earlier than this article in 1950.
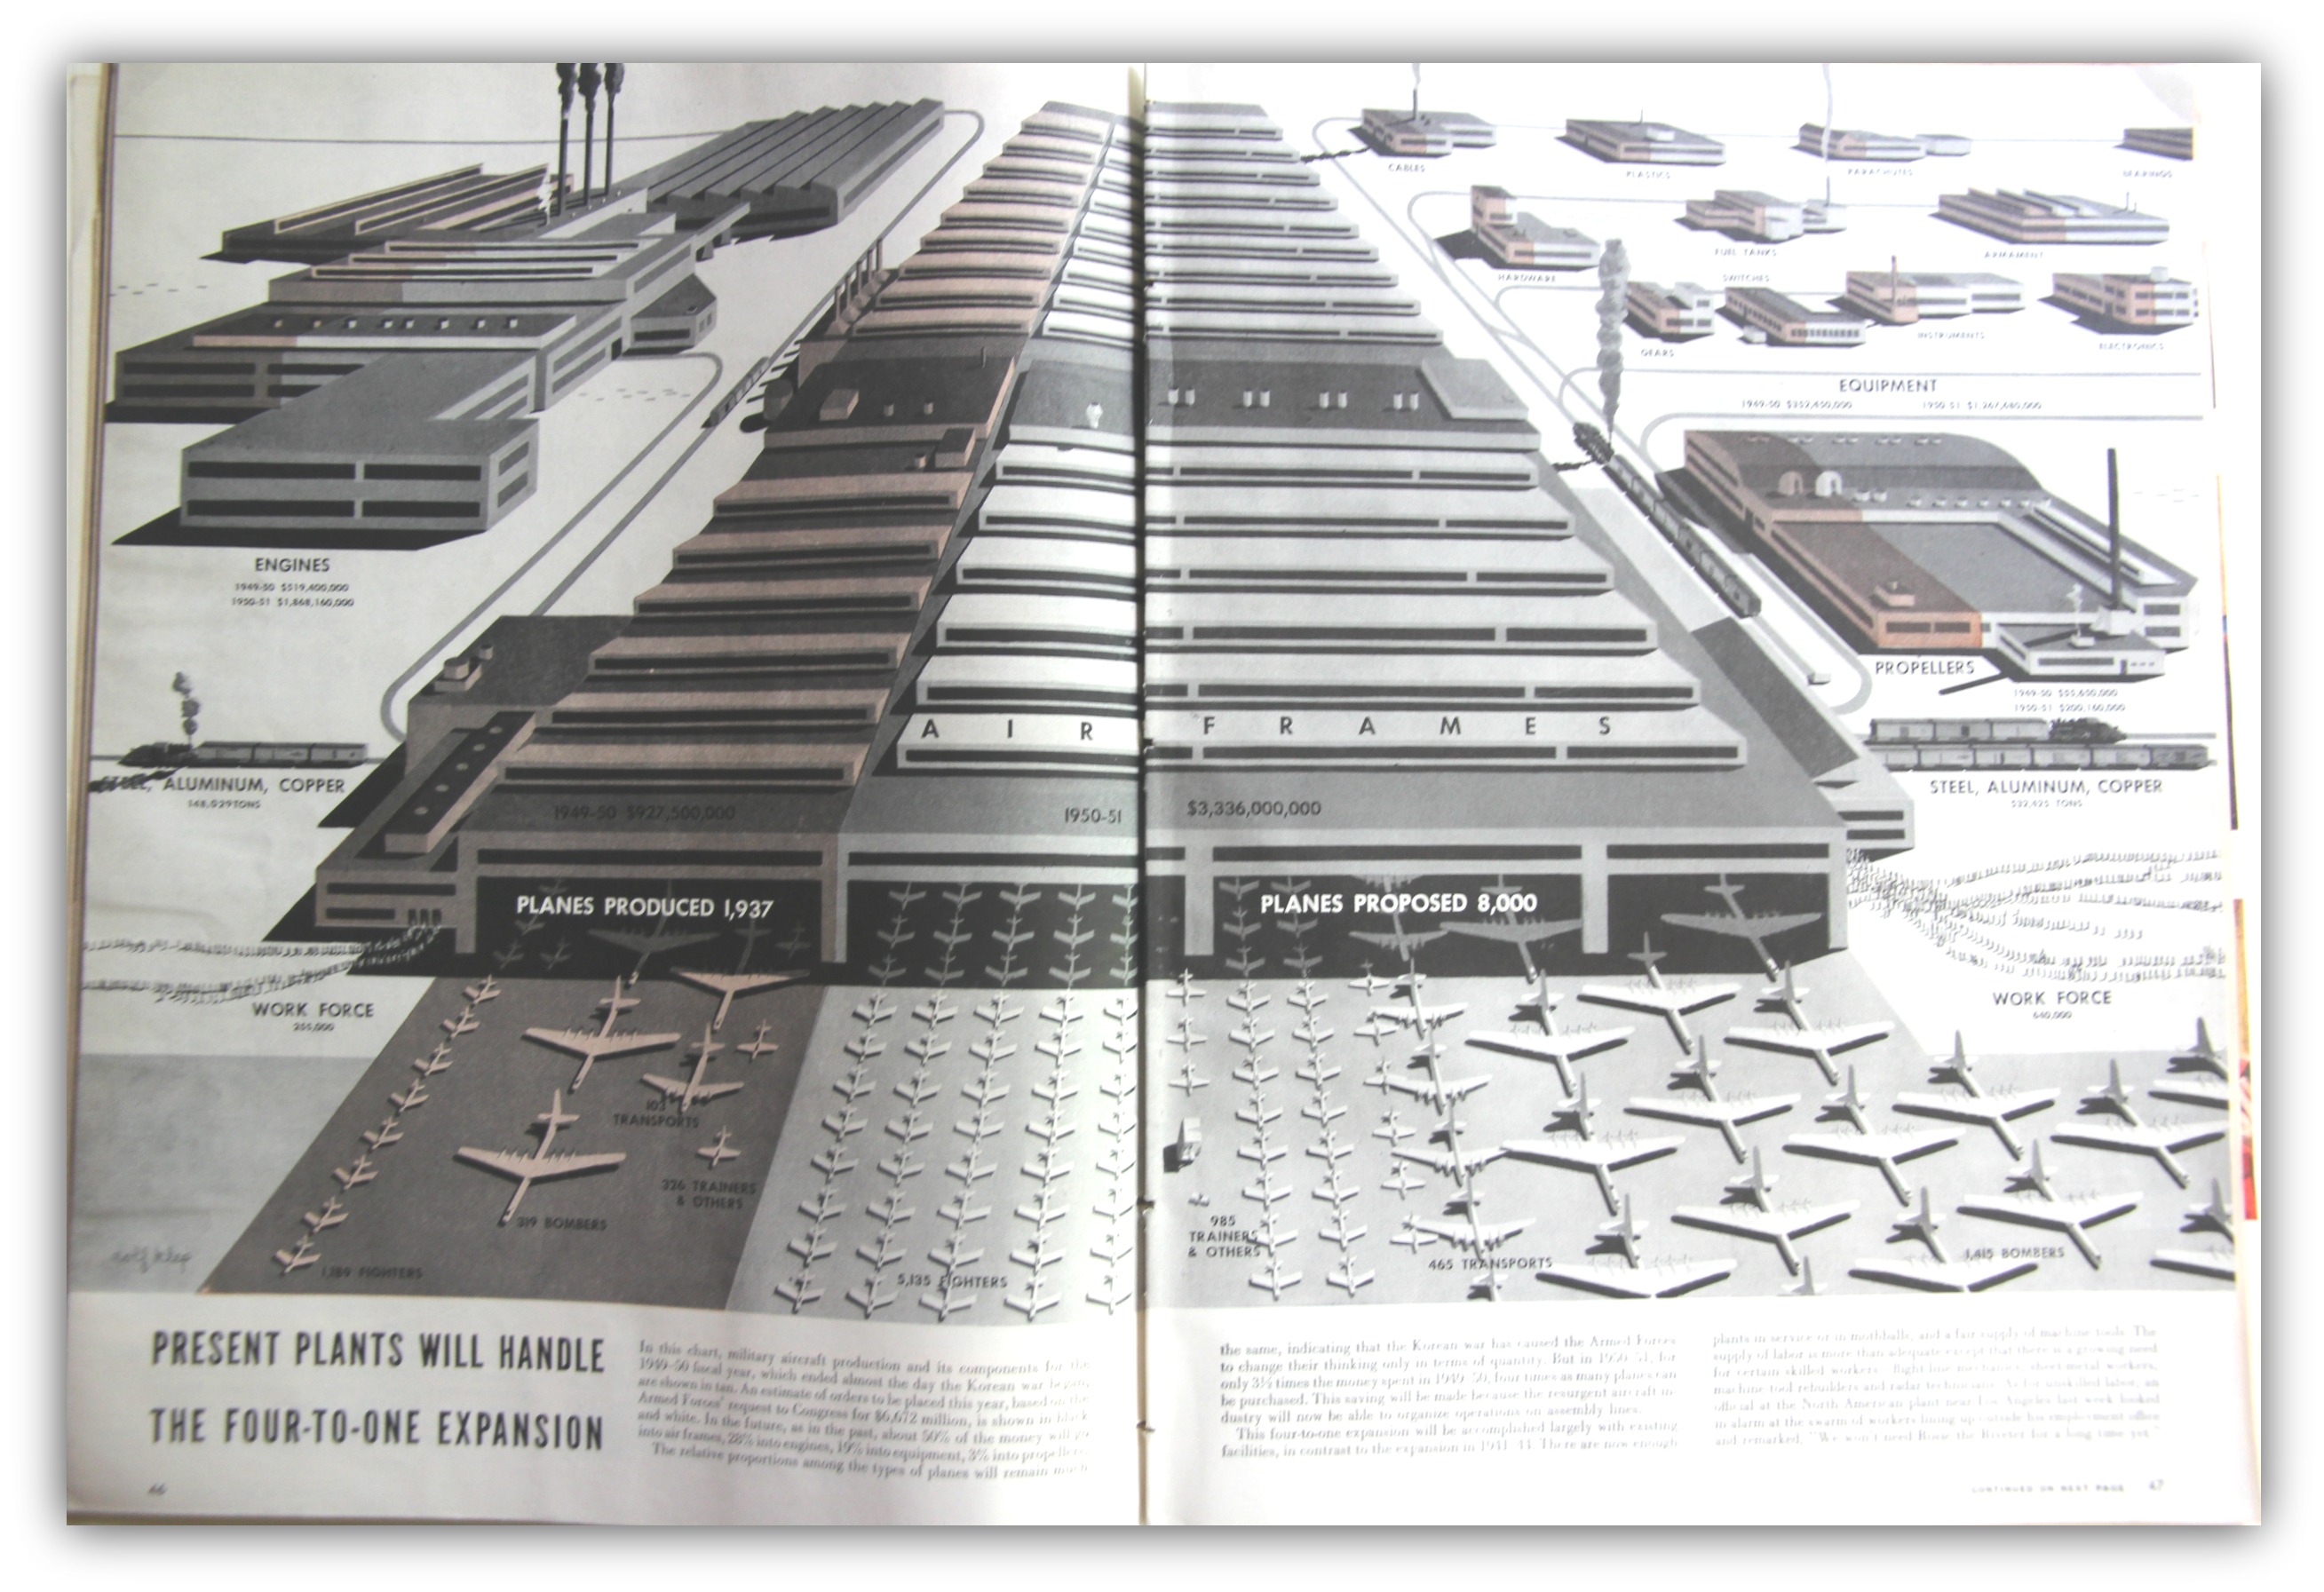 [Source: LIFE Magazine, August 28, 1950]