JF Ptak Science Books Quick Post

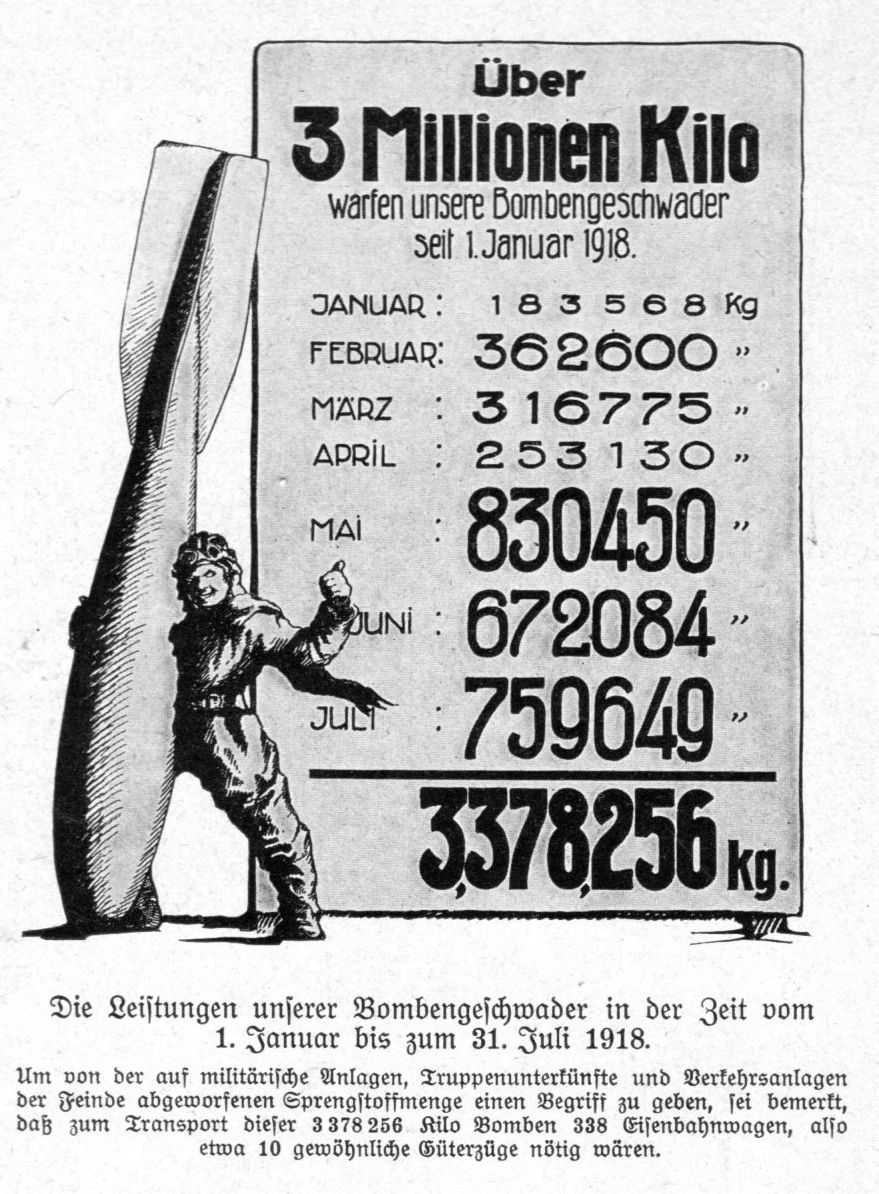
I found this interesting graphic in the Illustrirte Zeitung (Leipzig) showing the production of bombs in Germany for last half-year of WWI. The aviator seems happy enough, at least for the readers of the magazine, reassuring that something was goign on in the defense of the country, even though the writing was pretty much on the wall when this image appeared in late August, 1918, six weeks away from the end. It is a small graphical display–about 2.5×4 inches or so–and it is a congratulatory message on the massive amount of munitions that were produced from January-July 1918. This was one among many that just wasn’t enough.