JF Ptak Science Books Quick Post
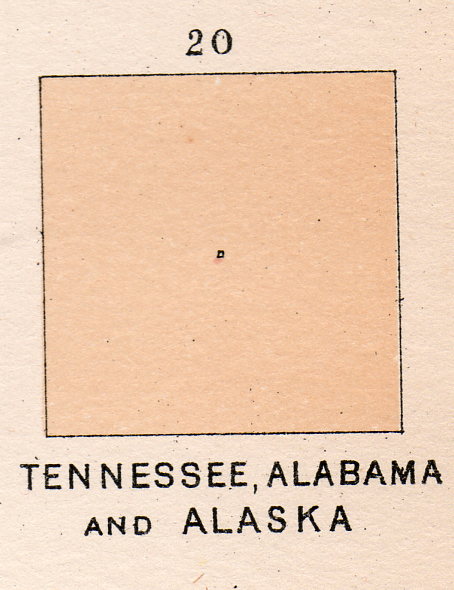
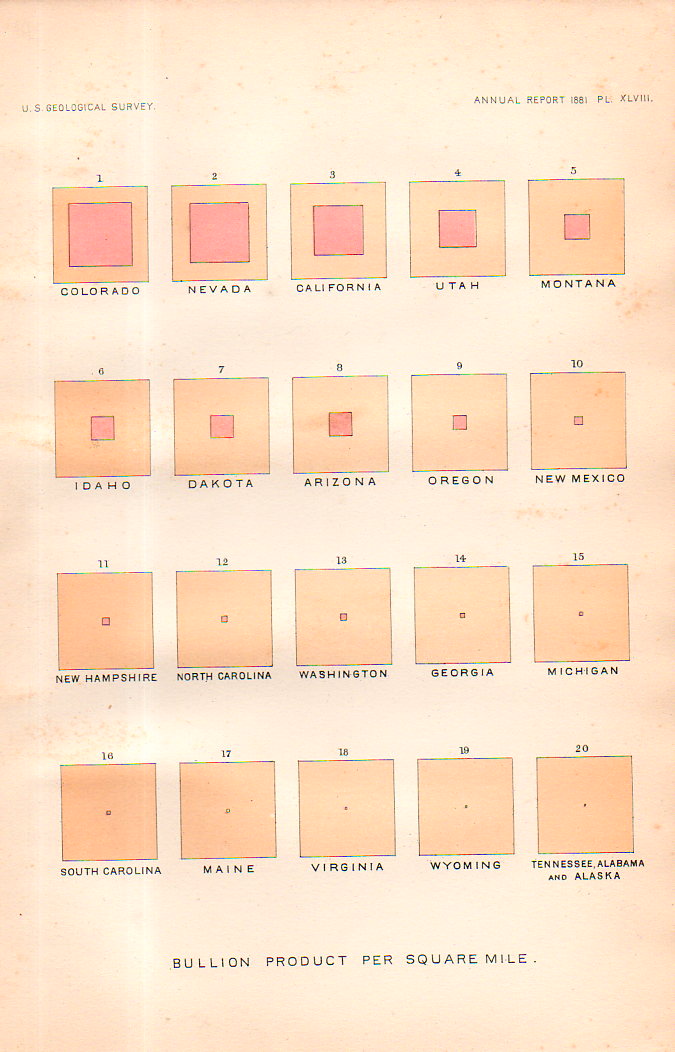
This square-within-a-square appears in a table of squares in several pages of square collections. They represent “Bullion product per capita” for U.S states and territories, and published in the U.S. Geological Survey Annual Report for 1881 (plate XLIX). The “bullion” is silver bullion, and as we can there twelve leading states for silver production worth discussing before the rest become melded into one solid whole in square 13. It is a beautiful display, in its pre-non-representational-art sort of way. Kandinsky was still more than 30 years away from calling this sort of thing “art”, and the representation itself was 95 years after the first graphic displays to convey info (in Playfair’s Commercial and Political Atlas of 1786)and still, it is very captivating in a simple, squarey sort of way.