JF Ptak Science Books Quick Post History of Lines series
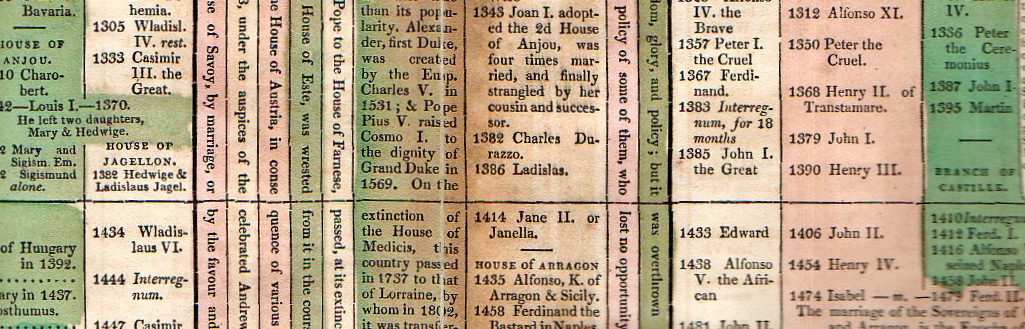
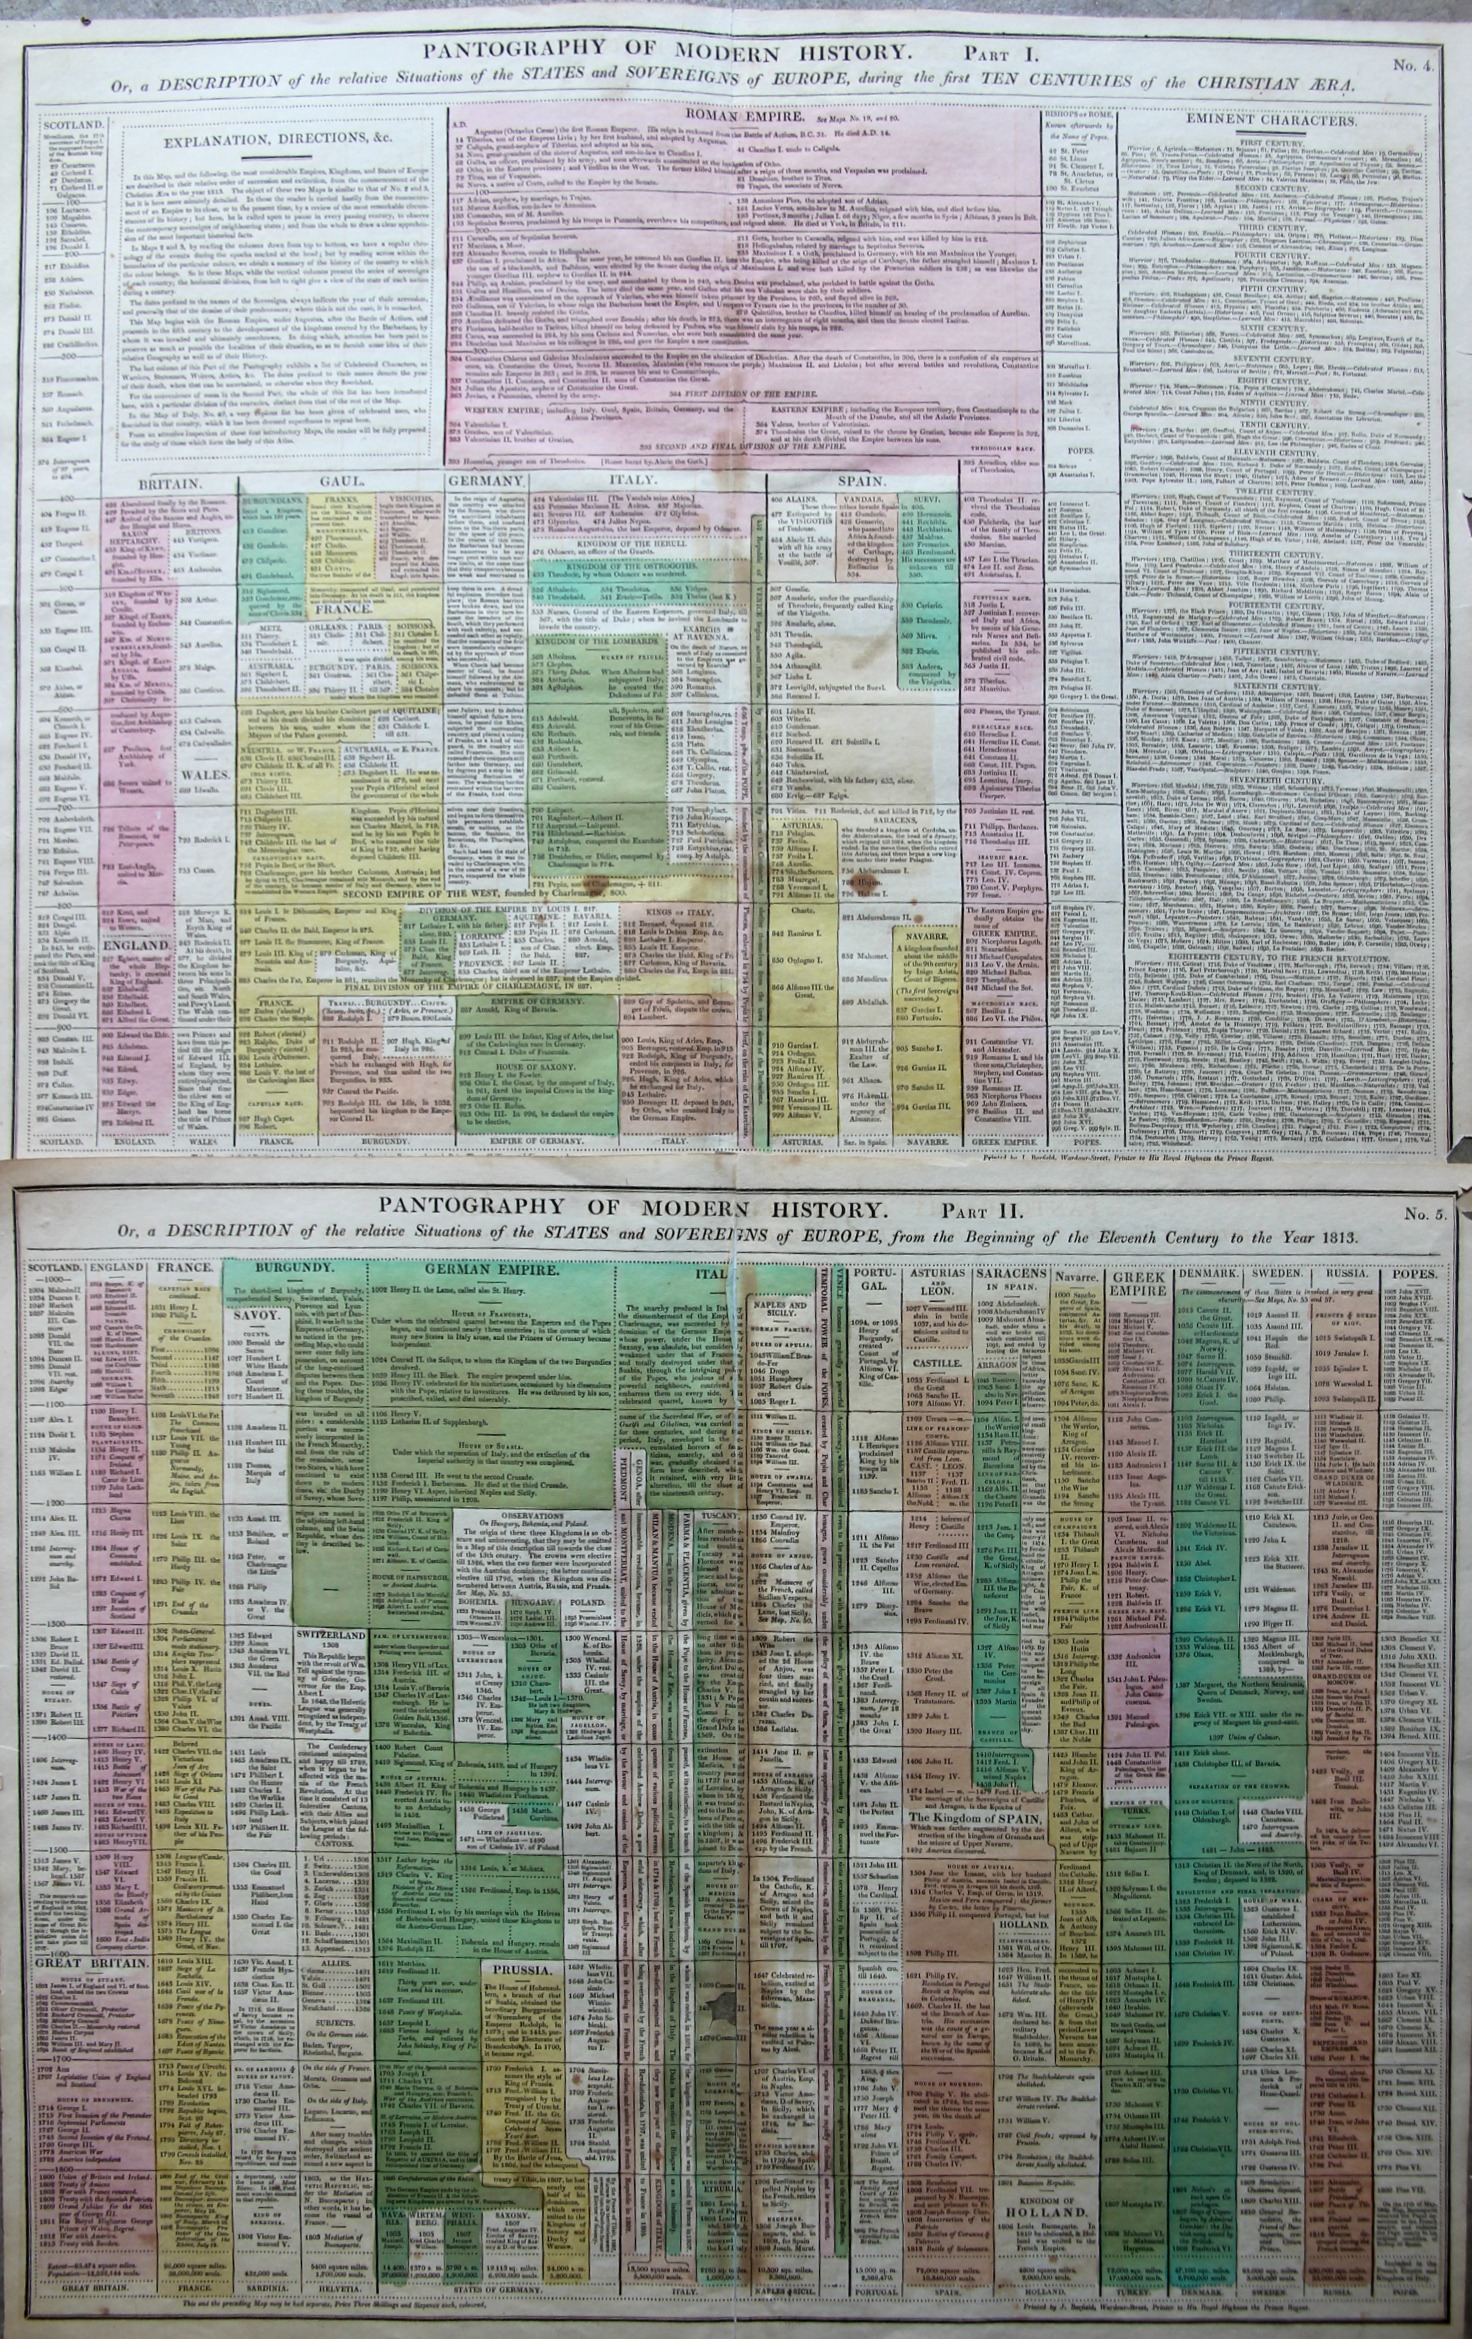
The “Pantography of Modern History” packs a lot of information into a relatively small space, surveying a good chunk of the history of the West from the year 14 to 1800. (It is very similar and may be a pirated English version of a French effort that I describe in this post, earlier on this blog.) The sheets are 16×20″ making the full pantography 32×20″ or so–I reckon that there are about 1000 data points on the four square feet or so of paper. There are some descriptions of events but most of the effort is keeping the ruling heads in order. This version is a little easier to follow than the French because the design is somewhat sparser, making the bits easier to discern.
I’m a big fan of this sort of data display.
- Published in Lavoisne’s Complete ….Geographical Atlas, printed by J. Barfield, 1815. “Pantography of Modern History. Or, a Description of the relative Situations of the States and Sovereigns of Europe, during the first Ten Centuries of the Christian Era” Accompanied by “… from the Beginning of the Eleventh Century to the Year 1828”.