JF Ptak Science Books Quick Post Reference Series
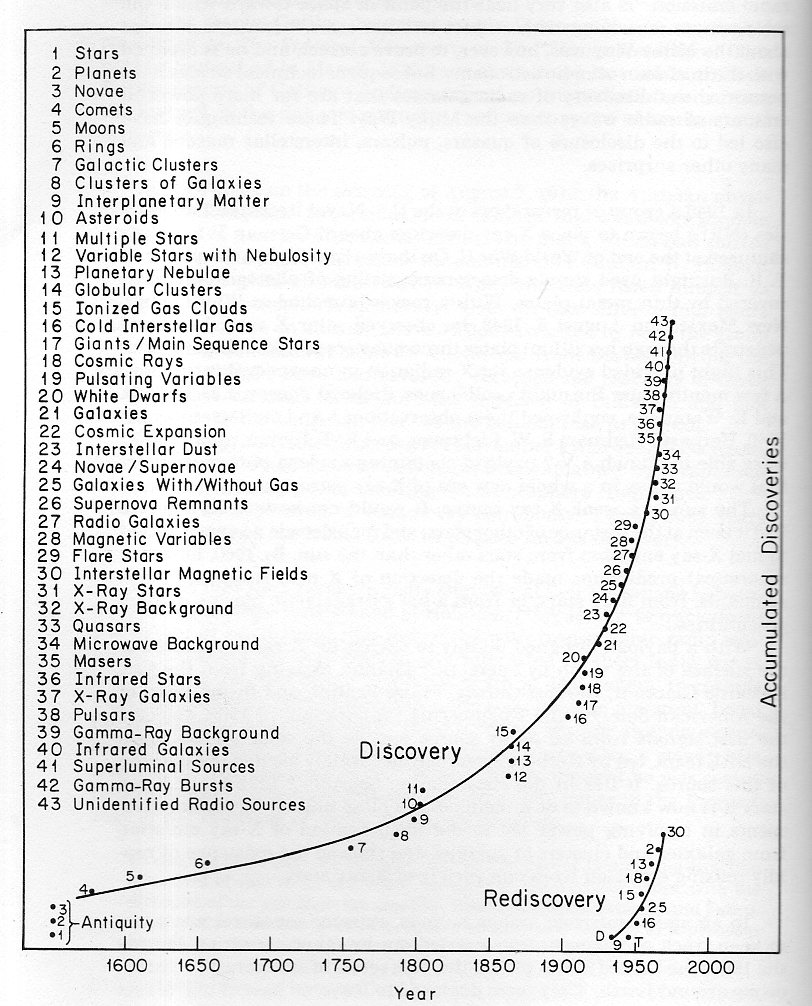
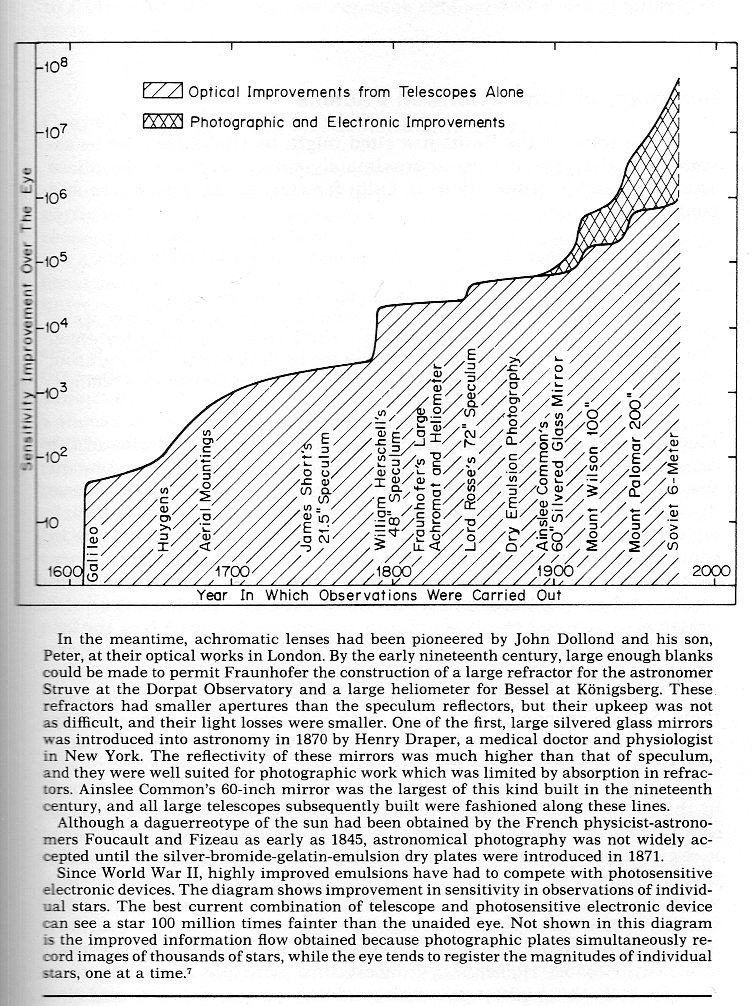
This interesting graph of cosmic discovery (and re-discovery) is found in the open pages of Martin Harwitt’s Cosmic Discovery, the Search, Scope, and Heritage of Astronomy, Basic Books, 1981 (page 14). It is an interesting advanced-introductory book which has a number of surprises, including this astro-discovery graph (below). There’s another unusual display of historical data in an optical power of telescopes graph, which plots “Sensitivity improvement over the eye” of telescopes with astronomers and observatories over time, from Galileo to 1980 (and which is found on page 175). They’re handy and useful and tell in a quickish glance some parts of the history of astronomy.