JF Ptak Science Books, Quick Post Part of the History of Dots series
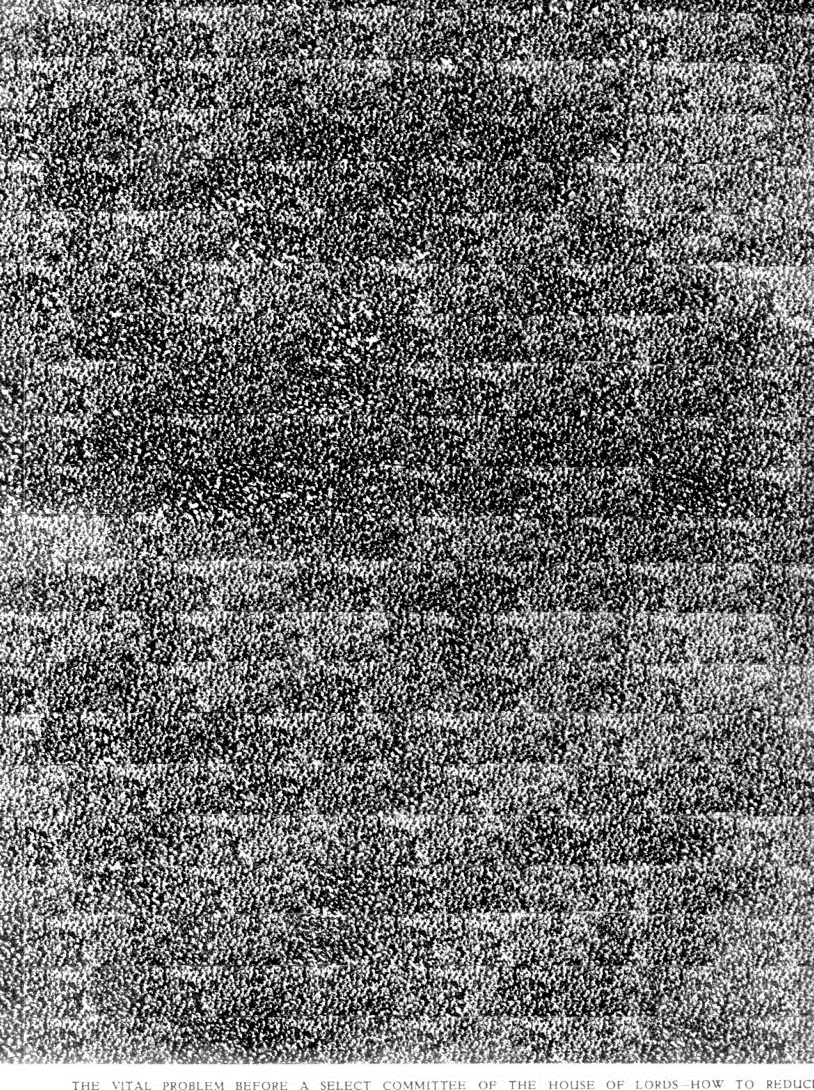
This is one half of a very impressive, “what the holy heck” sort of photograph–even more so that it portrays the number of people killed in road accidents in England from 1928-1937. 67,100 people were killed–the number of injured was evidently 30 (!) times higher. This is particularly impressive given that in all of the U.K. 2175 people were killed in 2012 compared to 36,000 for the U.S., which means 3.5/100,000 in the UK and 11.6/100,000 in the U.S. So things have gotten much better now than they were then, with a third of the fatalities for a much larger population. In any even the photo montage was a very compelling image, and was printed in the Illustrated London News, December 18, 1937, page 1110.
An extreme detail figuring about 2% of the image:

Another detail, about 1/20th of the image: