JF Ptak Science Books Quick Post

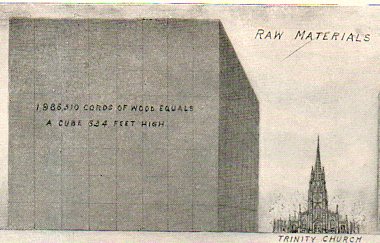
The rather dry article appearing in the 14 November 1903 issue of Scientific American discussing the comparison of raw and finished products in the printing and paper making industry survives itself in a glorious way with a captivating infographic explaining things in terms of units of Trinity Churches and Statues of Liberty–and that’s what makes the difference in presentation of data and the artistic display of statistical information.
 And so:
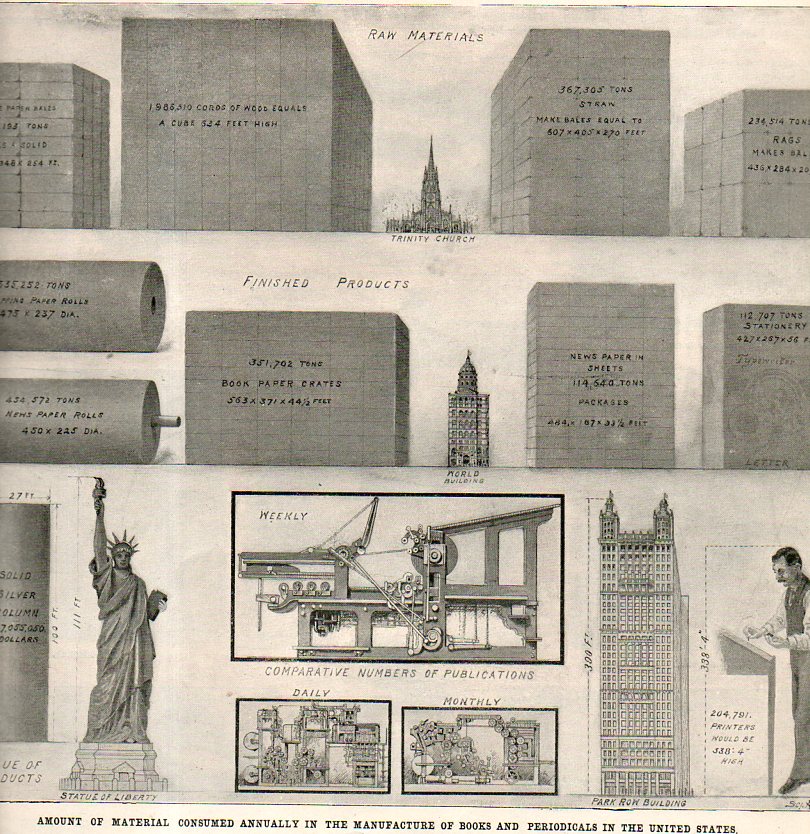 [Source: Scientific American, 14 November 1903]
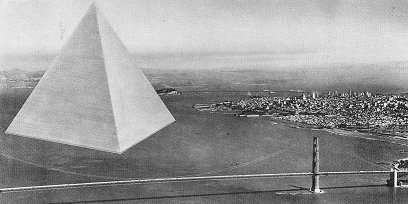
After everything is said and done these images remind me (unfairly, probably) of Buckminster Fuller’s idea for an enormous floating city named Triton. All things being equal, Triton probably could have worked, for good or not.