JF Ptak Science Books Quick Post
I’d like to add the few images below to a developing thread on the use of trees in diagrammatic displays of information as seen earlier on this blog in the following posts:
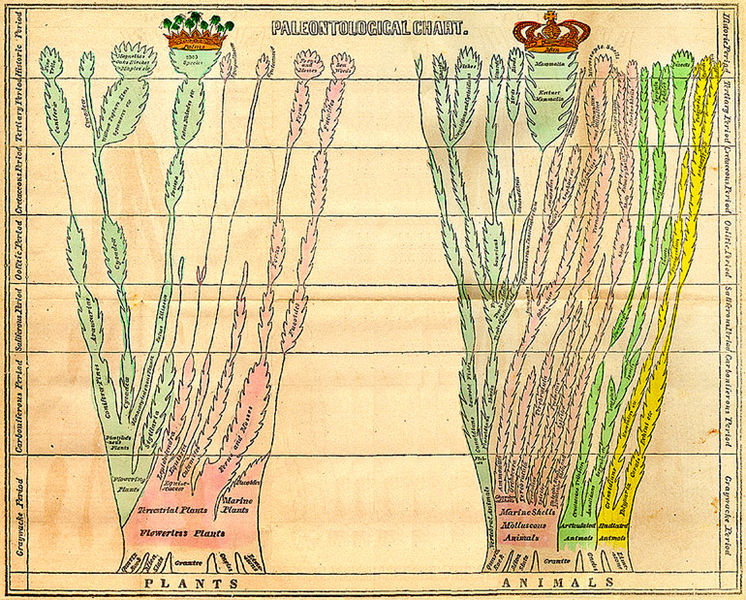
This is a distinctive utilization, featuring a king and queen versions of the tree/plant display, this by Edward Hitchcock (1763-1864) in his Elementary Geology, published in 1840, and showing paleontological chart of trees andplants:
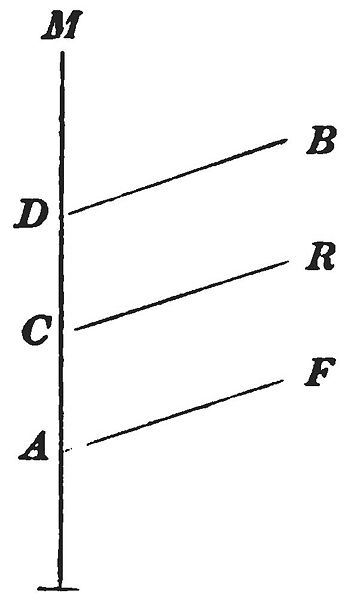
At about the same time came this outline for a tree diagram, (of embryonic development), from Robert Chambers, Vestiges of the Natural History of Creation, printed in 1844, and which shows a model of development where fish (F),
reptiles (R), and birds (B) represent branches from a path leading to
mammals (M):
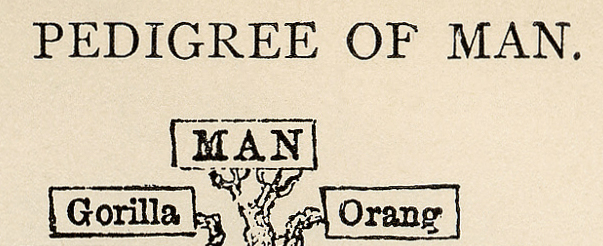
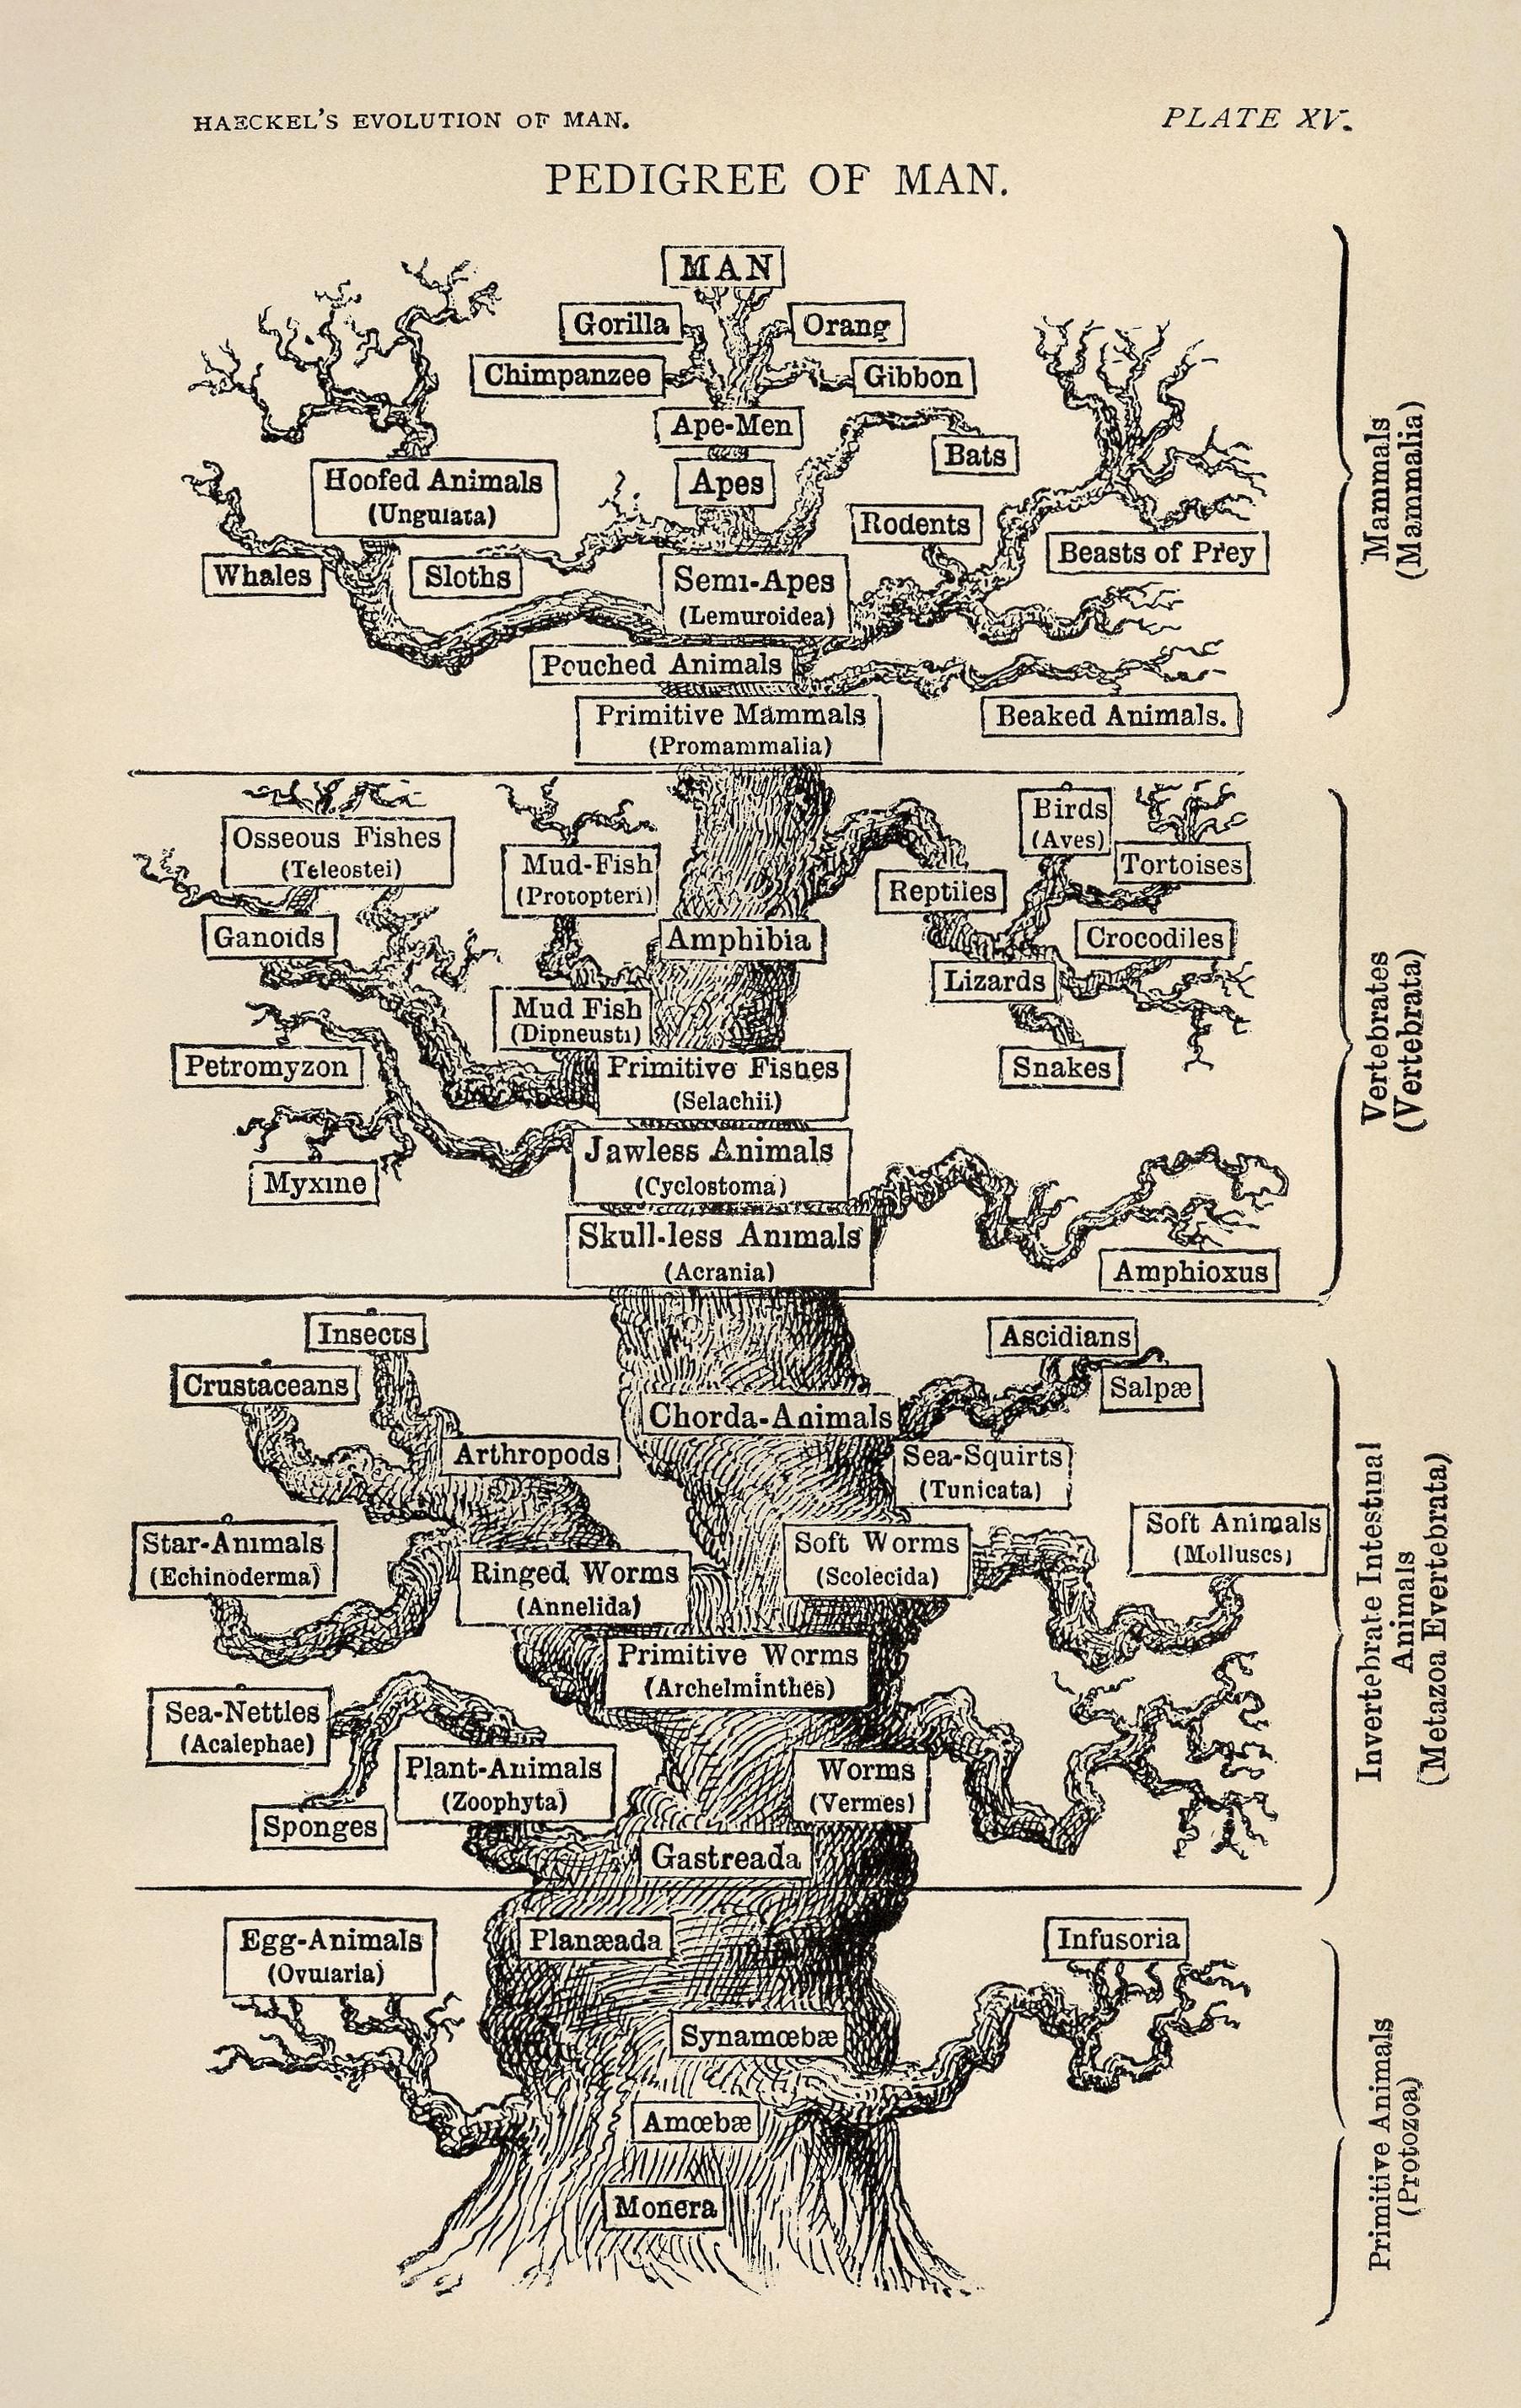
And somehow in the different representations of the tree of life by Ernst Haeckel I failed to include these three very famous renderings, the first made for an English-language edition of his Evolution of Man, which appeared in 1879:
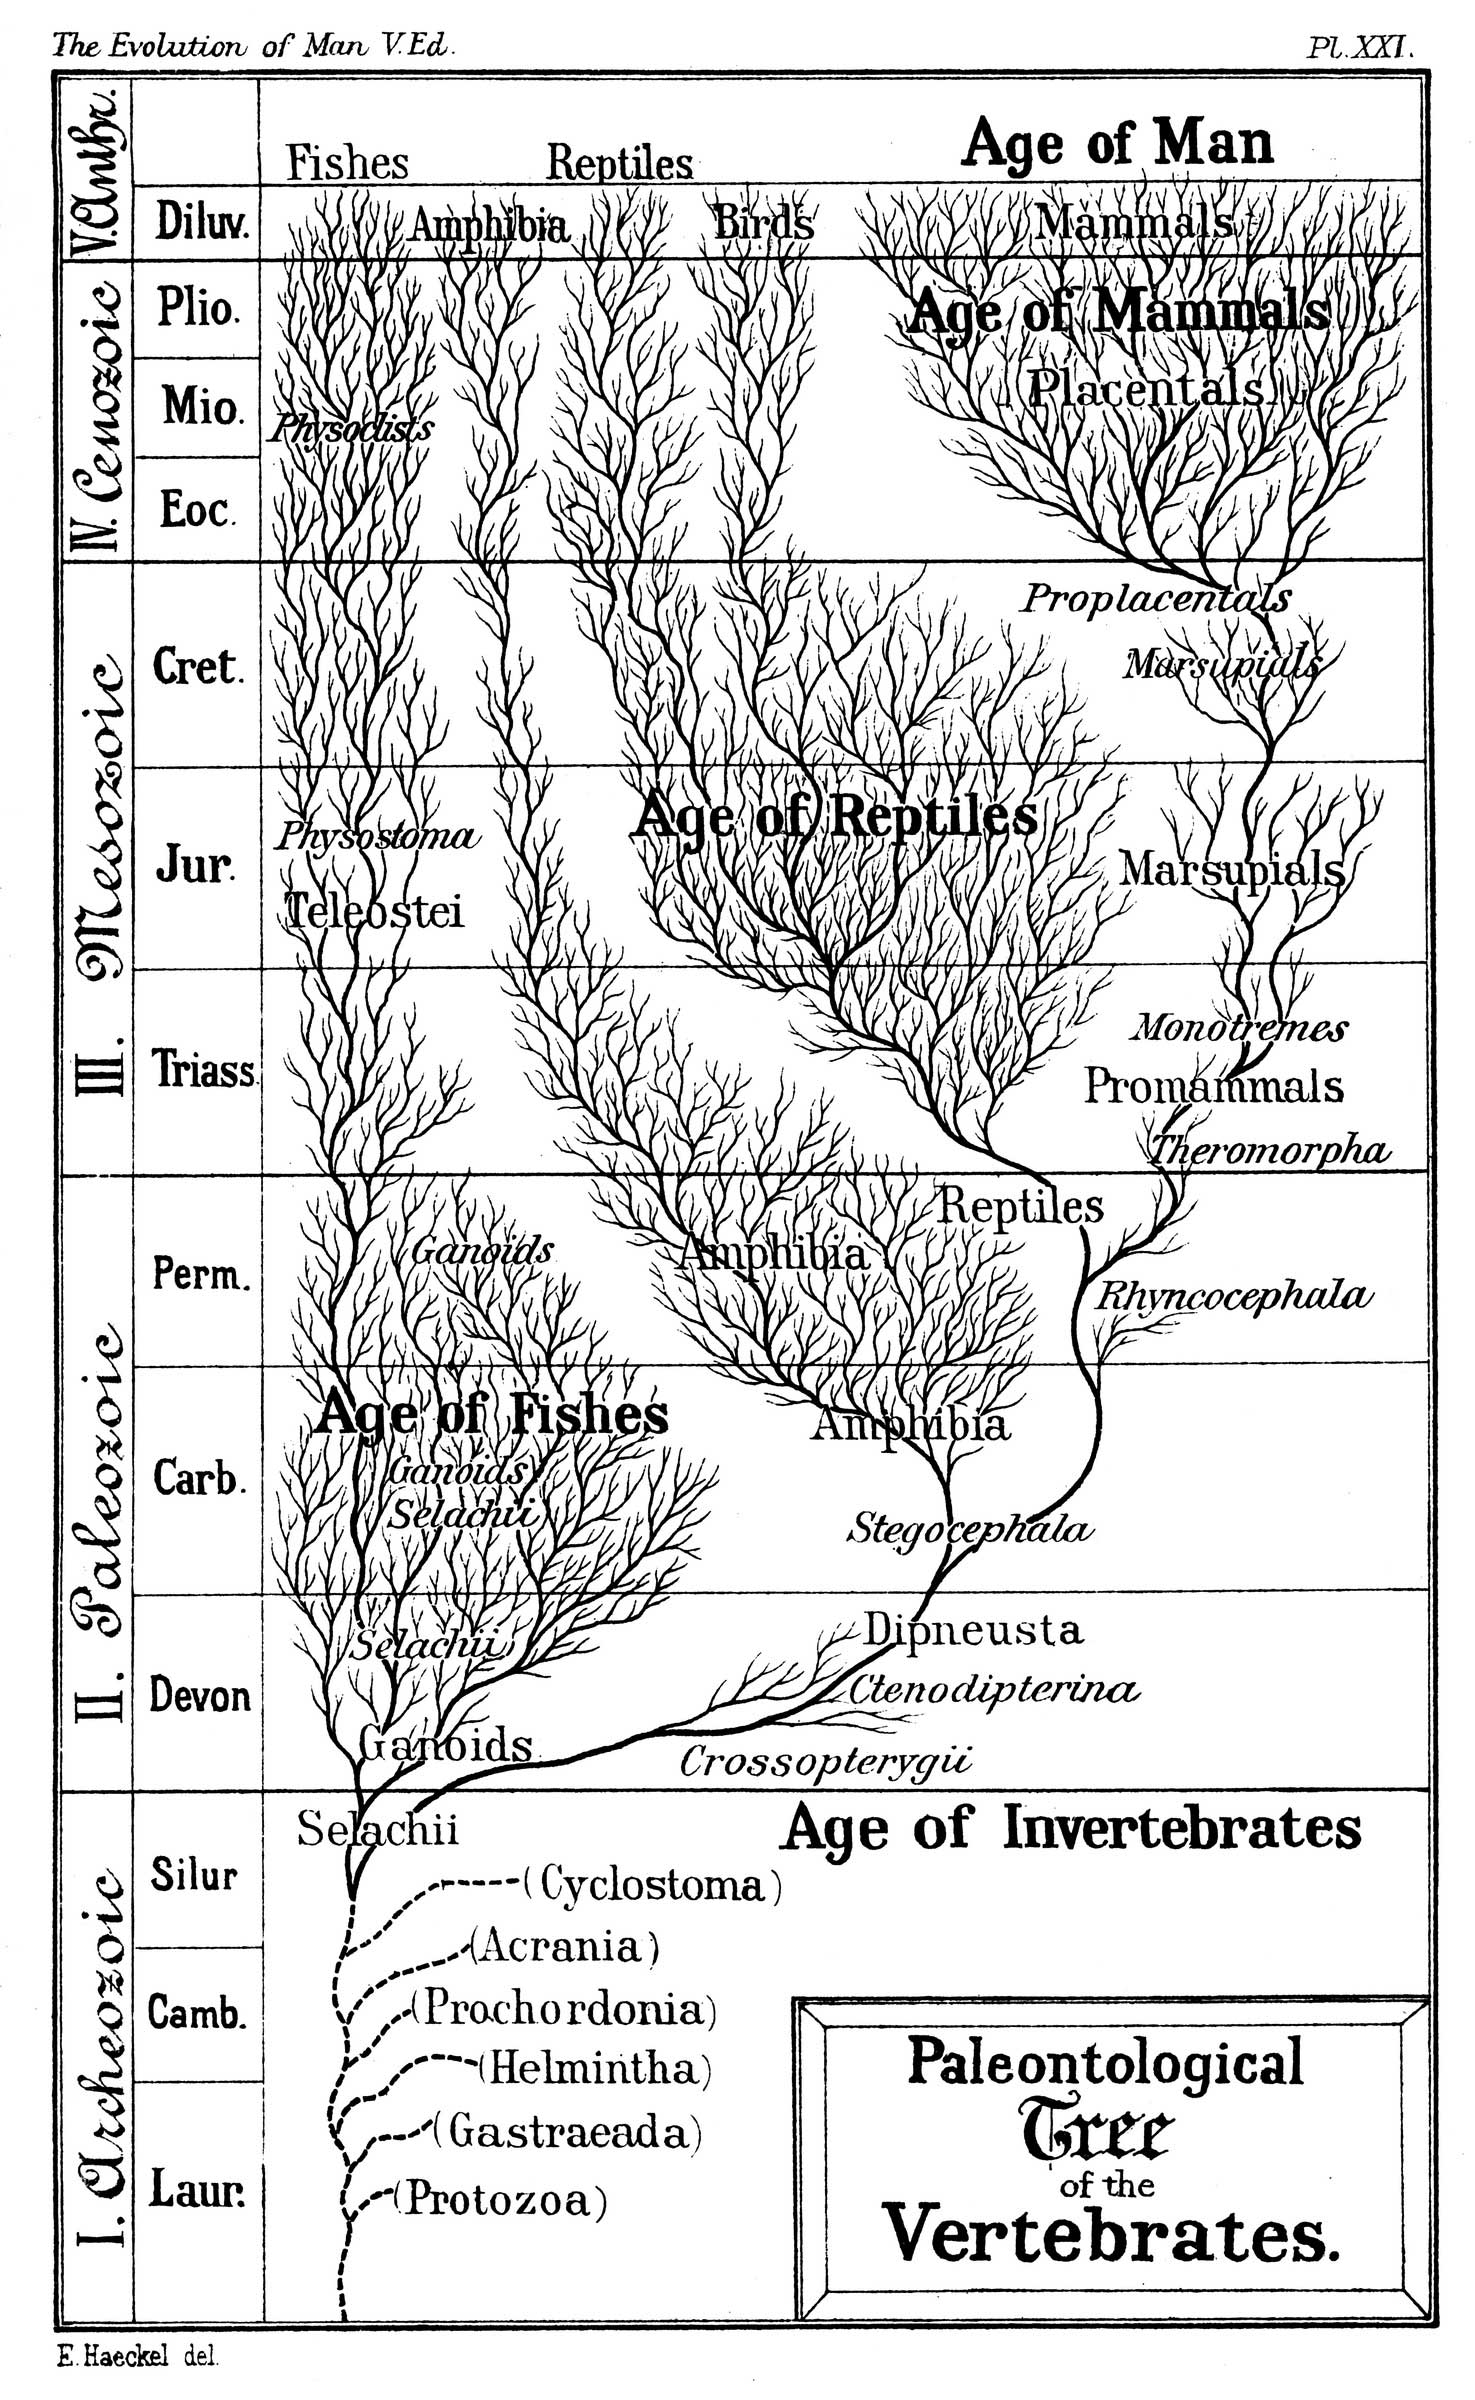
And this version, which appeared in the fifth edition of his Evolution of Man, printed in London in 1910:
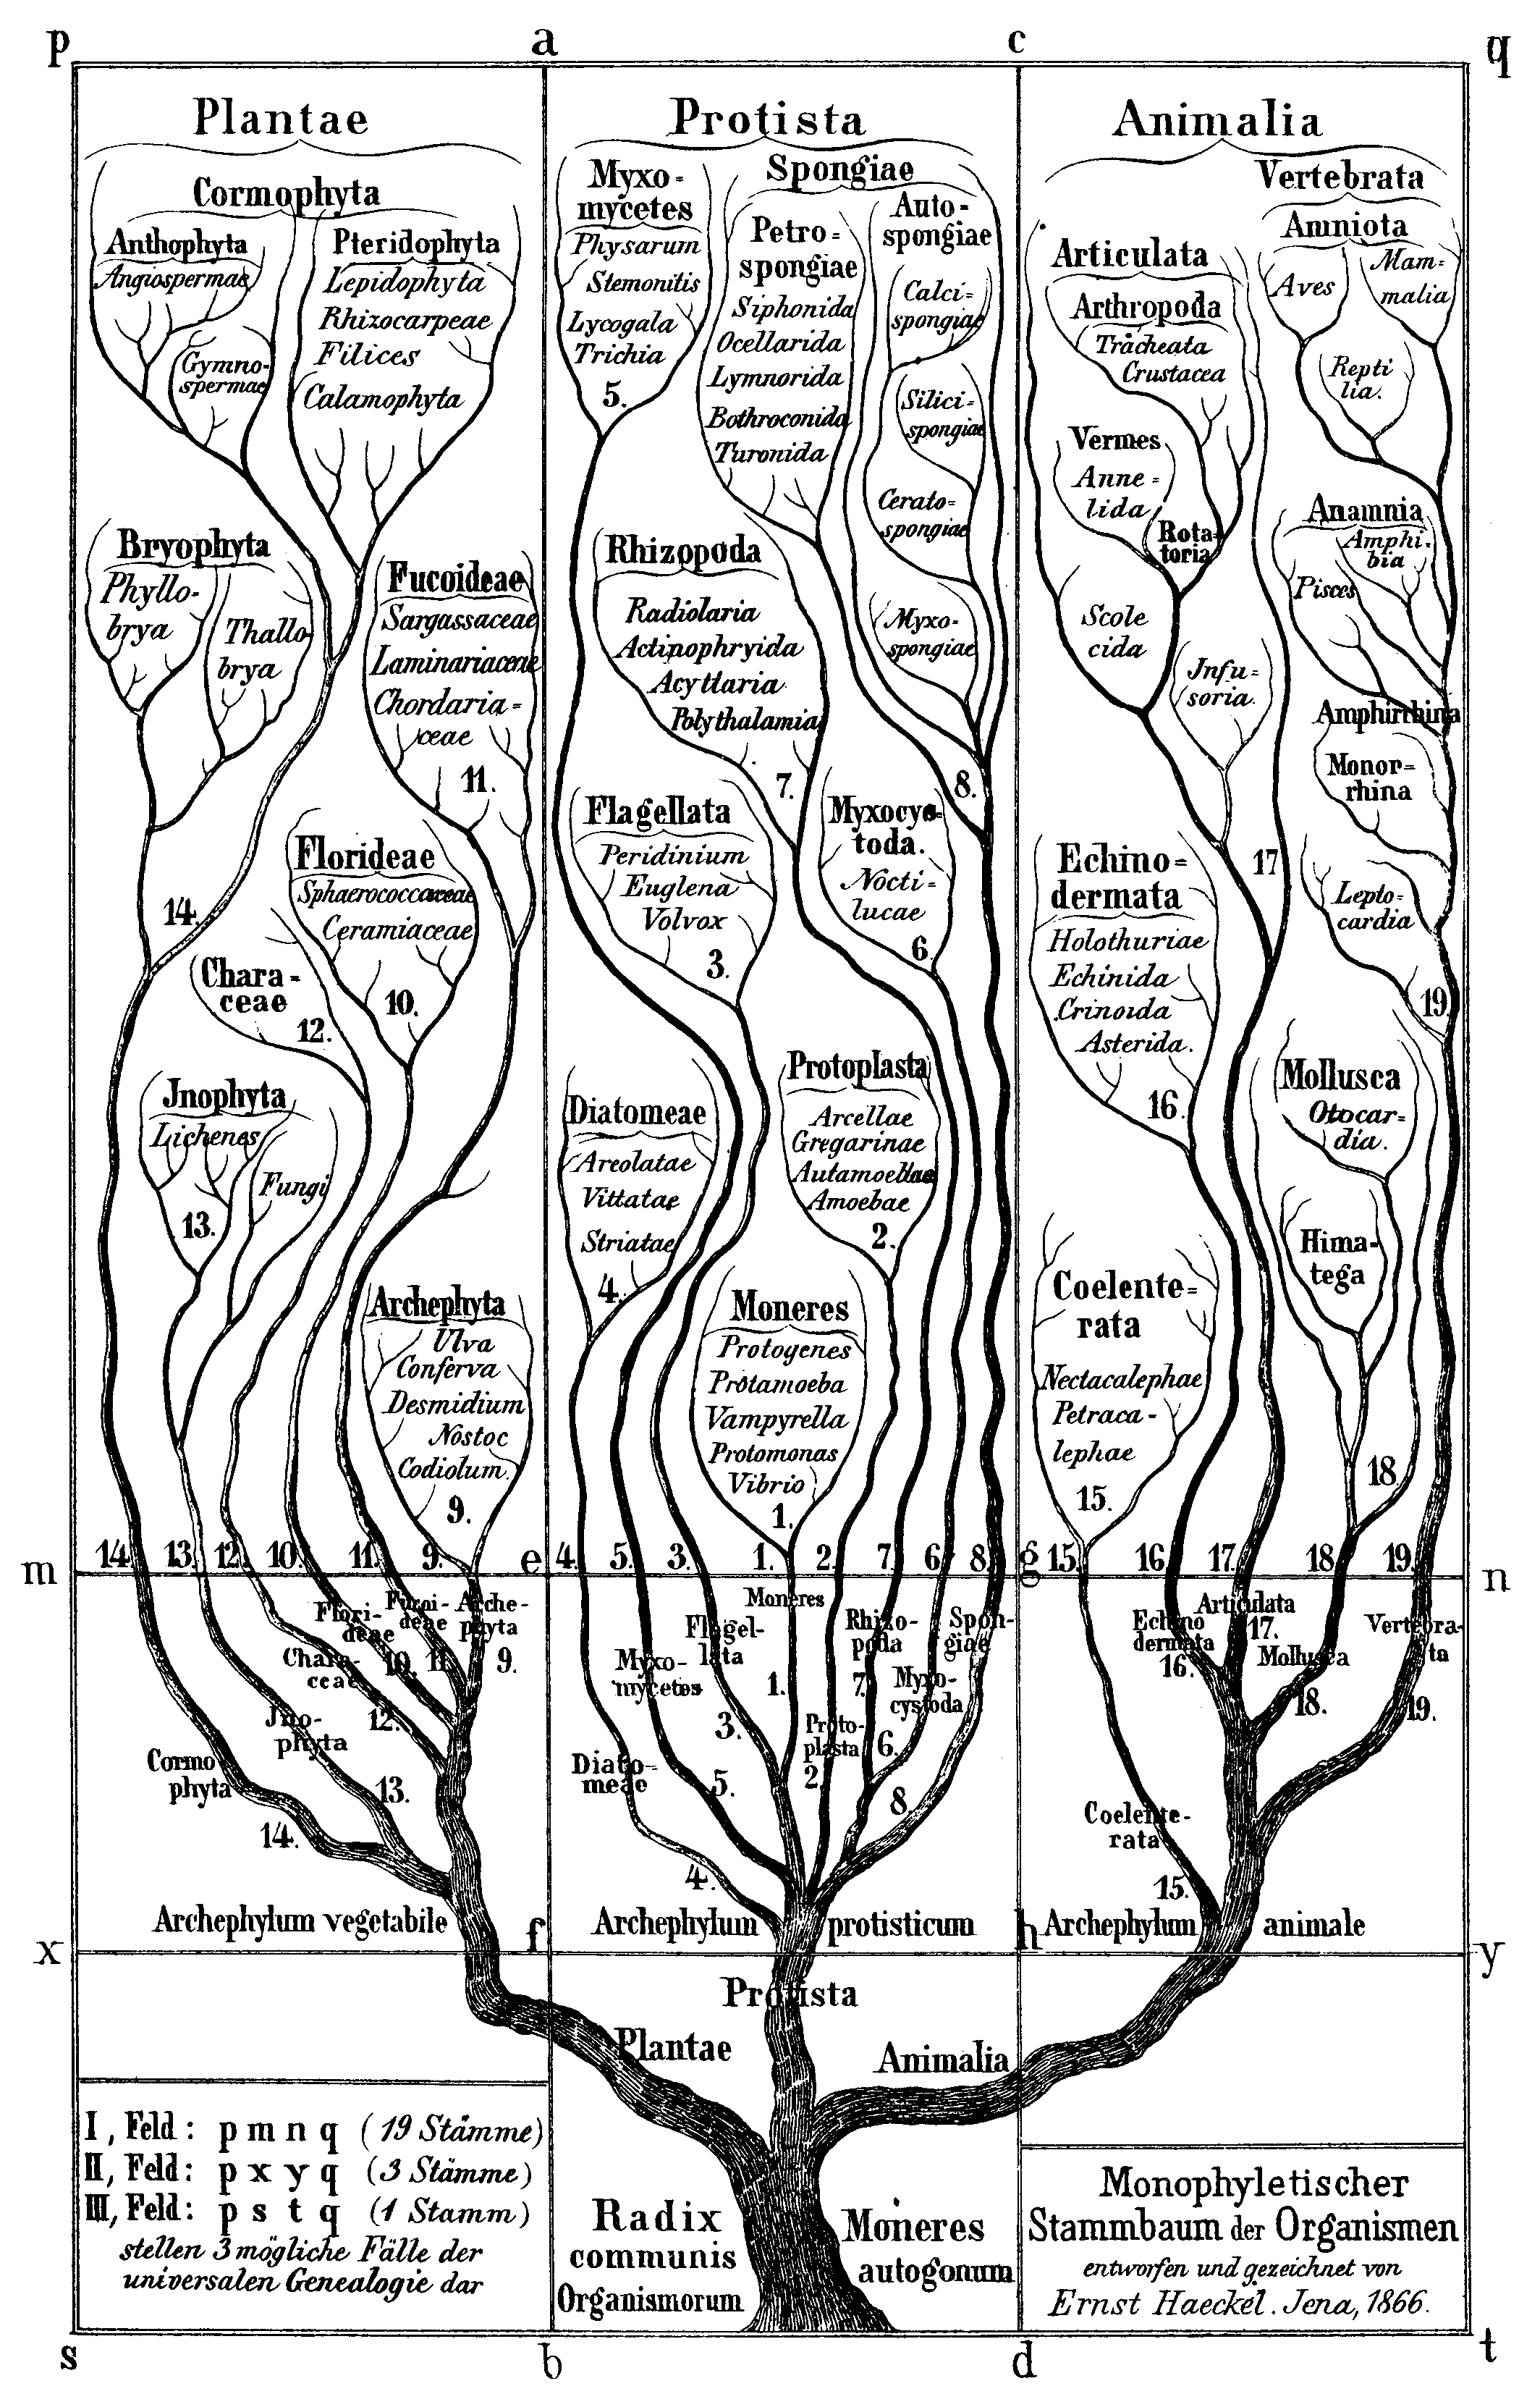
And yet another, this one much earlier, in 1866: