A Daily History of Holes, Dots, Lines, Science, History, Math, Physics, Art, the Unintentional Absurd, Architecture, Maps, Data Visualization, Blank and Missing Things, and so on. |1.6 million words, 7500 images, 4.9 million hits| Press & appearances in The Times, Le Figaro, Mensa, The Economist, The Guardian, Discovery News, Slate, Le Monde, Sci American Blogs, Le Pont, and many other places… 5000+ total posts since 2008.

History of Squares: Squares Big and Little in Infographics, 1890

JF Ptak Science Books   Quick Post


Follow Me on Pinterest


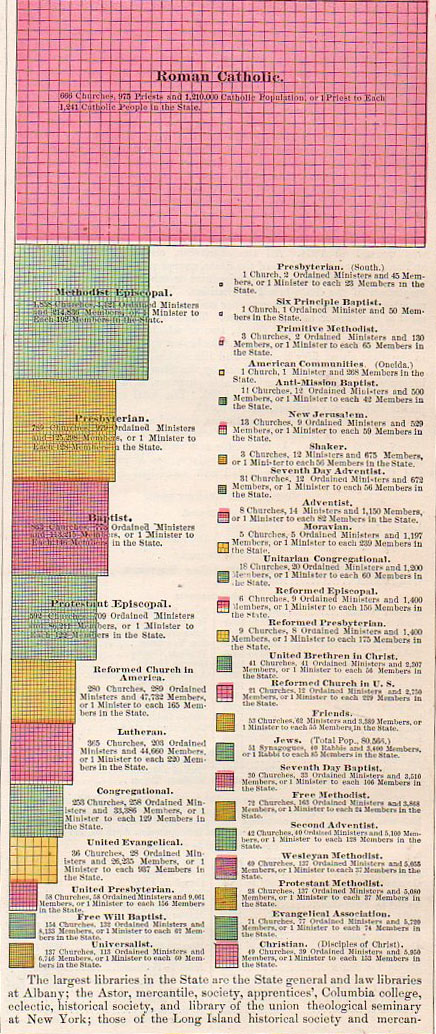
This display of quantitative data appeared in the Rand McNally atlas of 1890, and details the various religions as practiced and reported in New York state for the census of 1880.  The work certainly gets it point across.  See also: Fantastic Sqaure(s), 1840 and the blog series, Quantitative Display of Information.

Information--religion006
This is the most detailed detail in the detail of the full infographic:
Information--religion005

Recent Posts

Archives

Categories