JF Ptak Science Books
“Do You Want to be a Whale or a Eagel?”[sic]
Walking down the hall of my daughter Tess’ school today I came across these absolutely brilliant displays of information tacked up on bulletin boards. The kids polled their classmates on whether they would rather be a whale or an eagle. The designs of the survey results were staggering to me, purely brilliant reasoning and expression.
The results here are magnificently displayed, elegant and crisp, and of course with a child’s beauty.
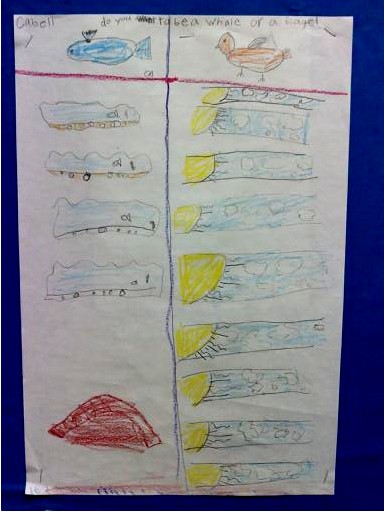
Another astonishing work of private clarity–I really do need to interview the statistician to find out the deep depth of what is being presented here. It is just beautiful.
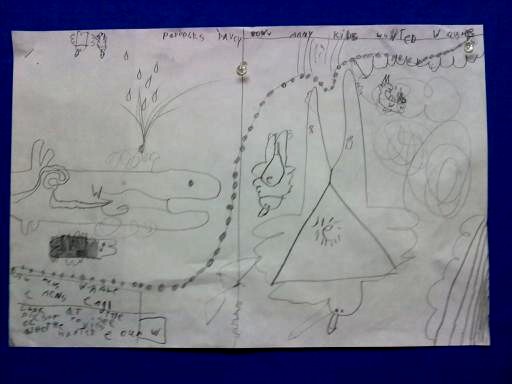
And even though I don’t quite follow this one, there is a LOT of effort in it: perhaps the kids were asked to raise their hands for a whale and to stand to be an eagle. Those hands though I have seen drawn in books and manuscripts going back to the 12th century–they have stayed basically the same for 800 years.
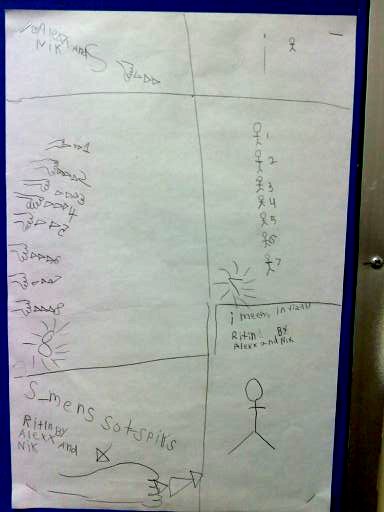
My best wishes and congratulations to these children at Isaac Dickson School, Asheville, North Carolina.