JF Ptak Science Books LLC Post 661
These original sheets were, it seems, prepared for an illustrated (1973) talk on a statistical model for the detection of anti-submarine warfare threats—unfortunately I’m at a loss to distinguish much of importance here, though I’m sure that someone who is the least bit familiar with defense modeling and simulation would instantly and easily interpret theserelatively simple images. I’m presenting them here because they are to me an example of excellent presentation, design and logic—a fine symbol for the presentation of graphical information in a pre-PowerPoint past.
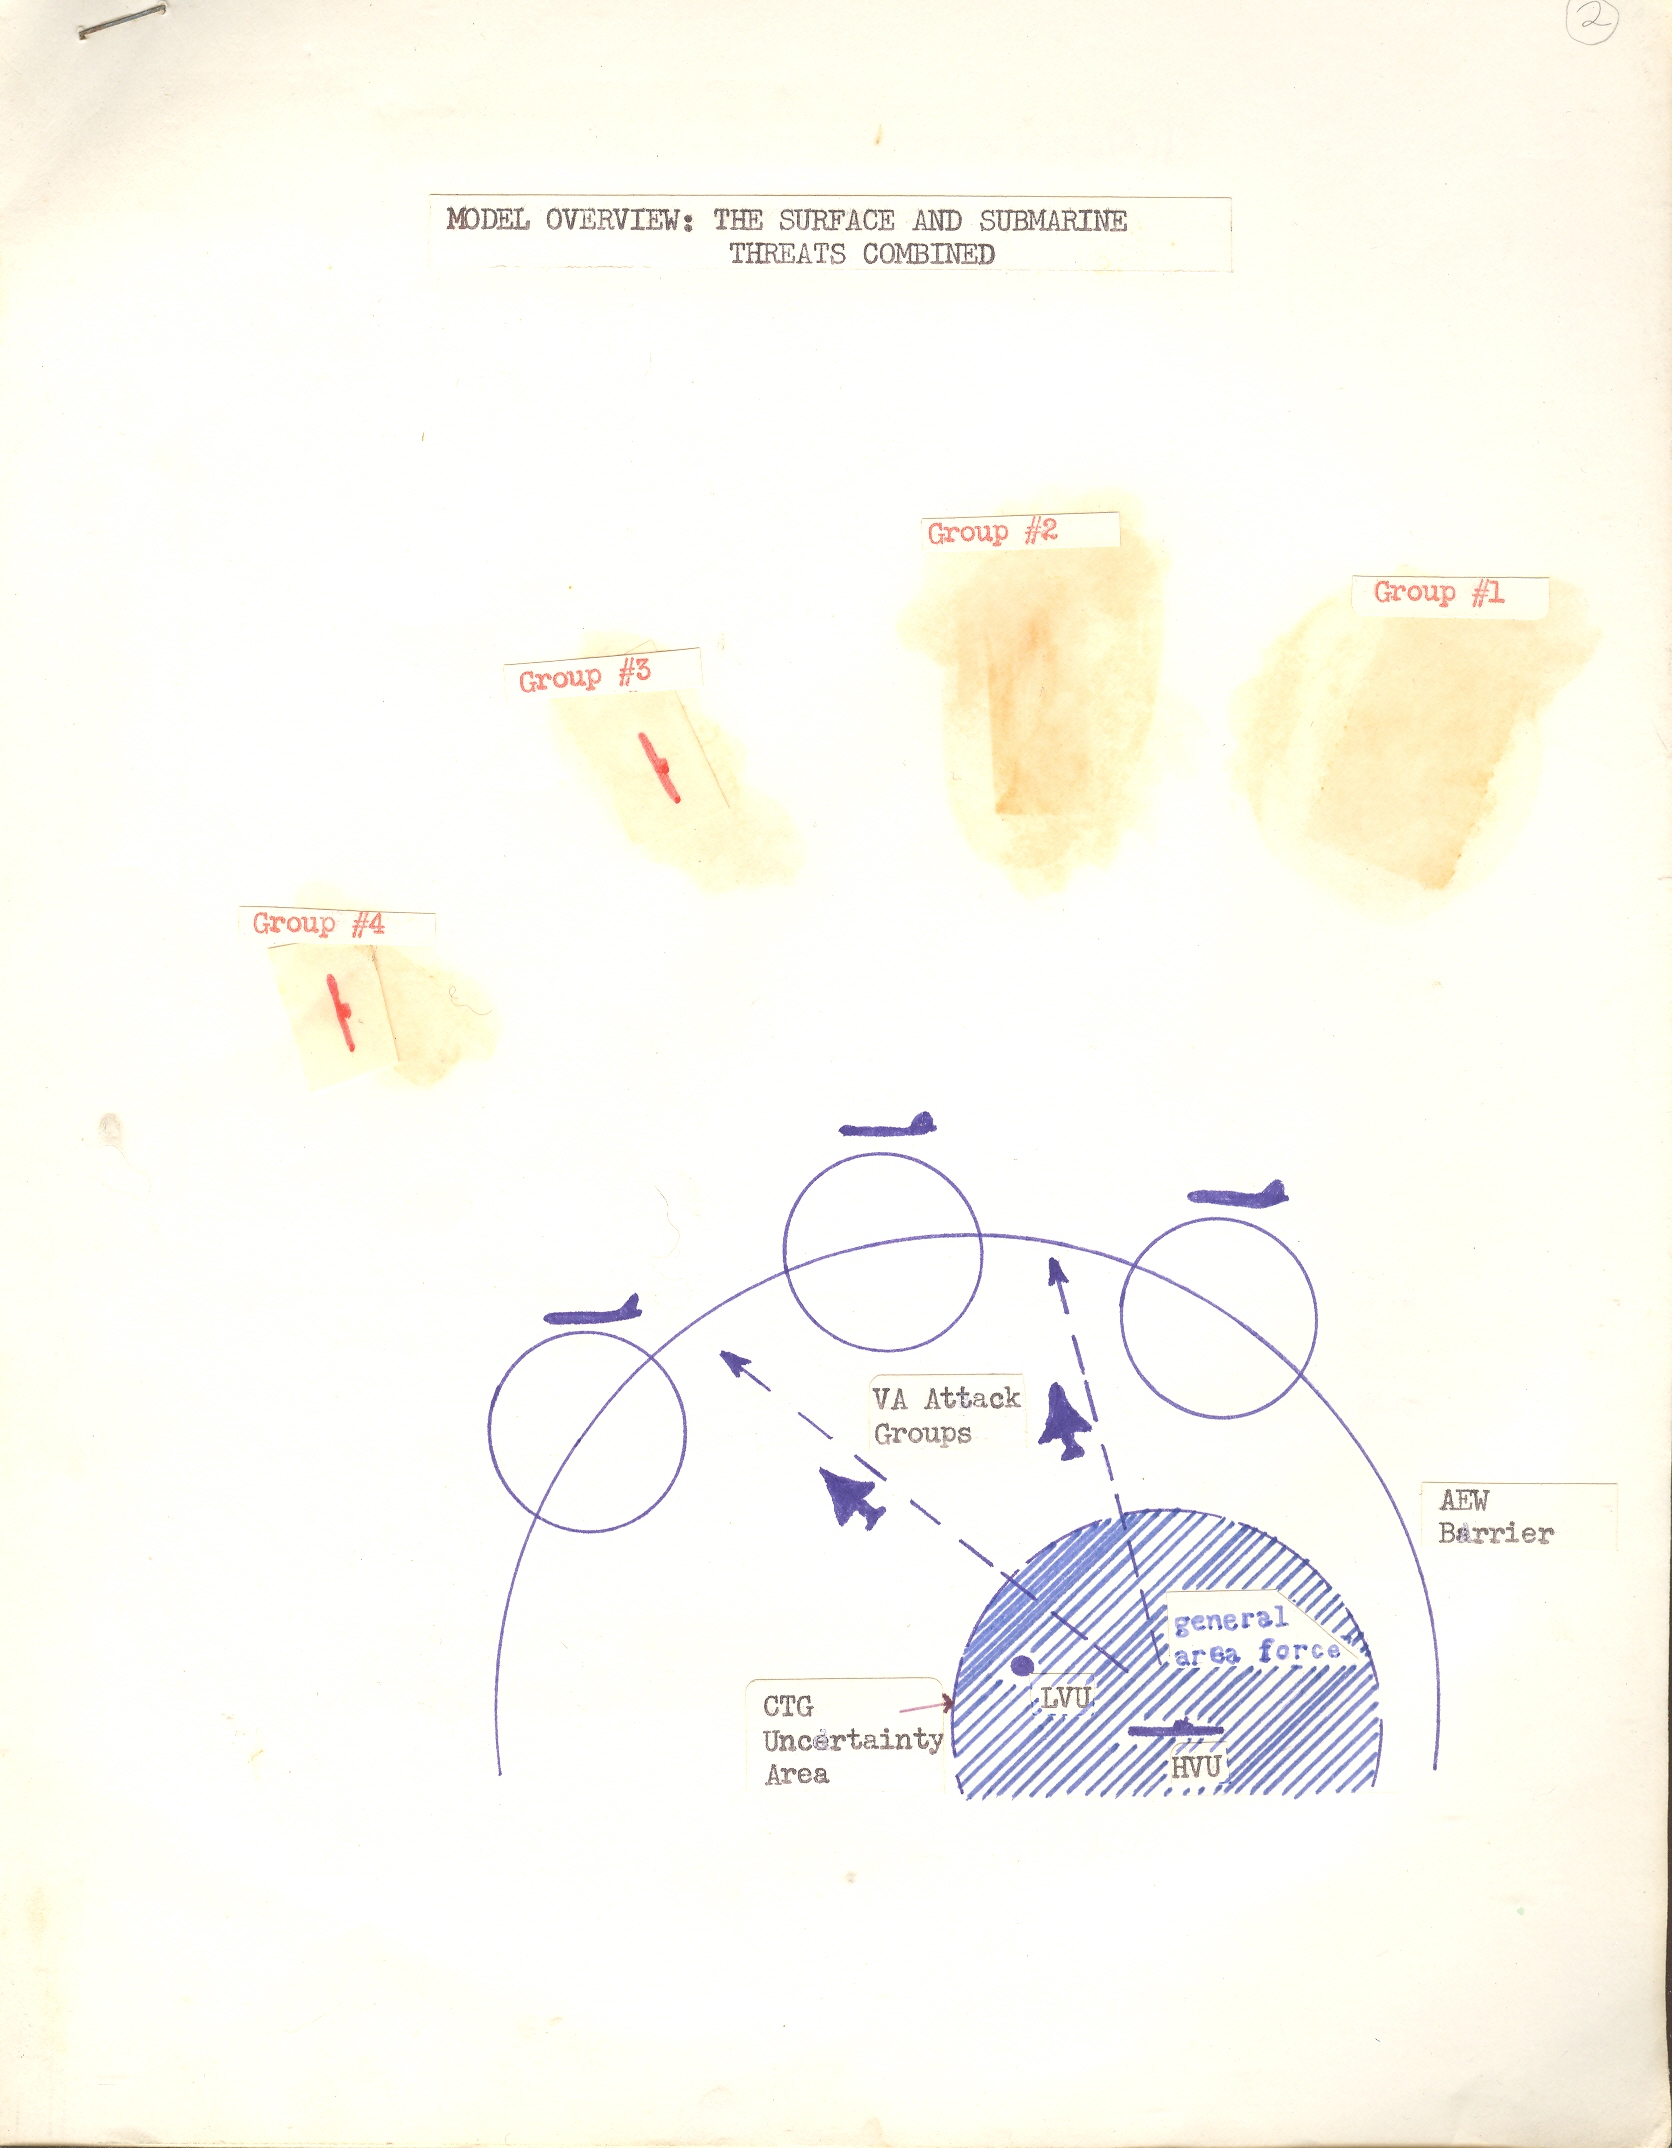
The work is that of [redacted], an analyst who seems to have worked in the 1960’s and 1970’s for the thinktank John D. Kettelle Corp of Alexandria, Virginia, a defense contracting firm. (I’ve included titles and abstracts of some of his published works in the “continued reading” section, below.)
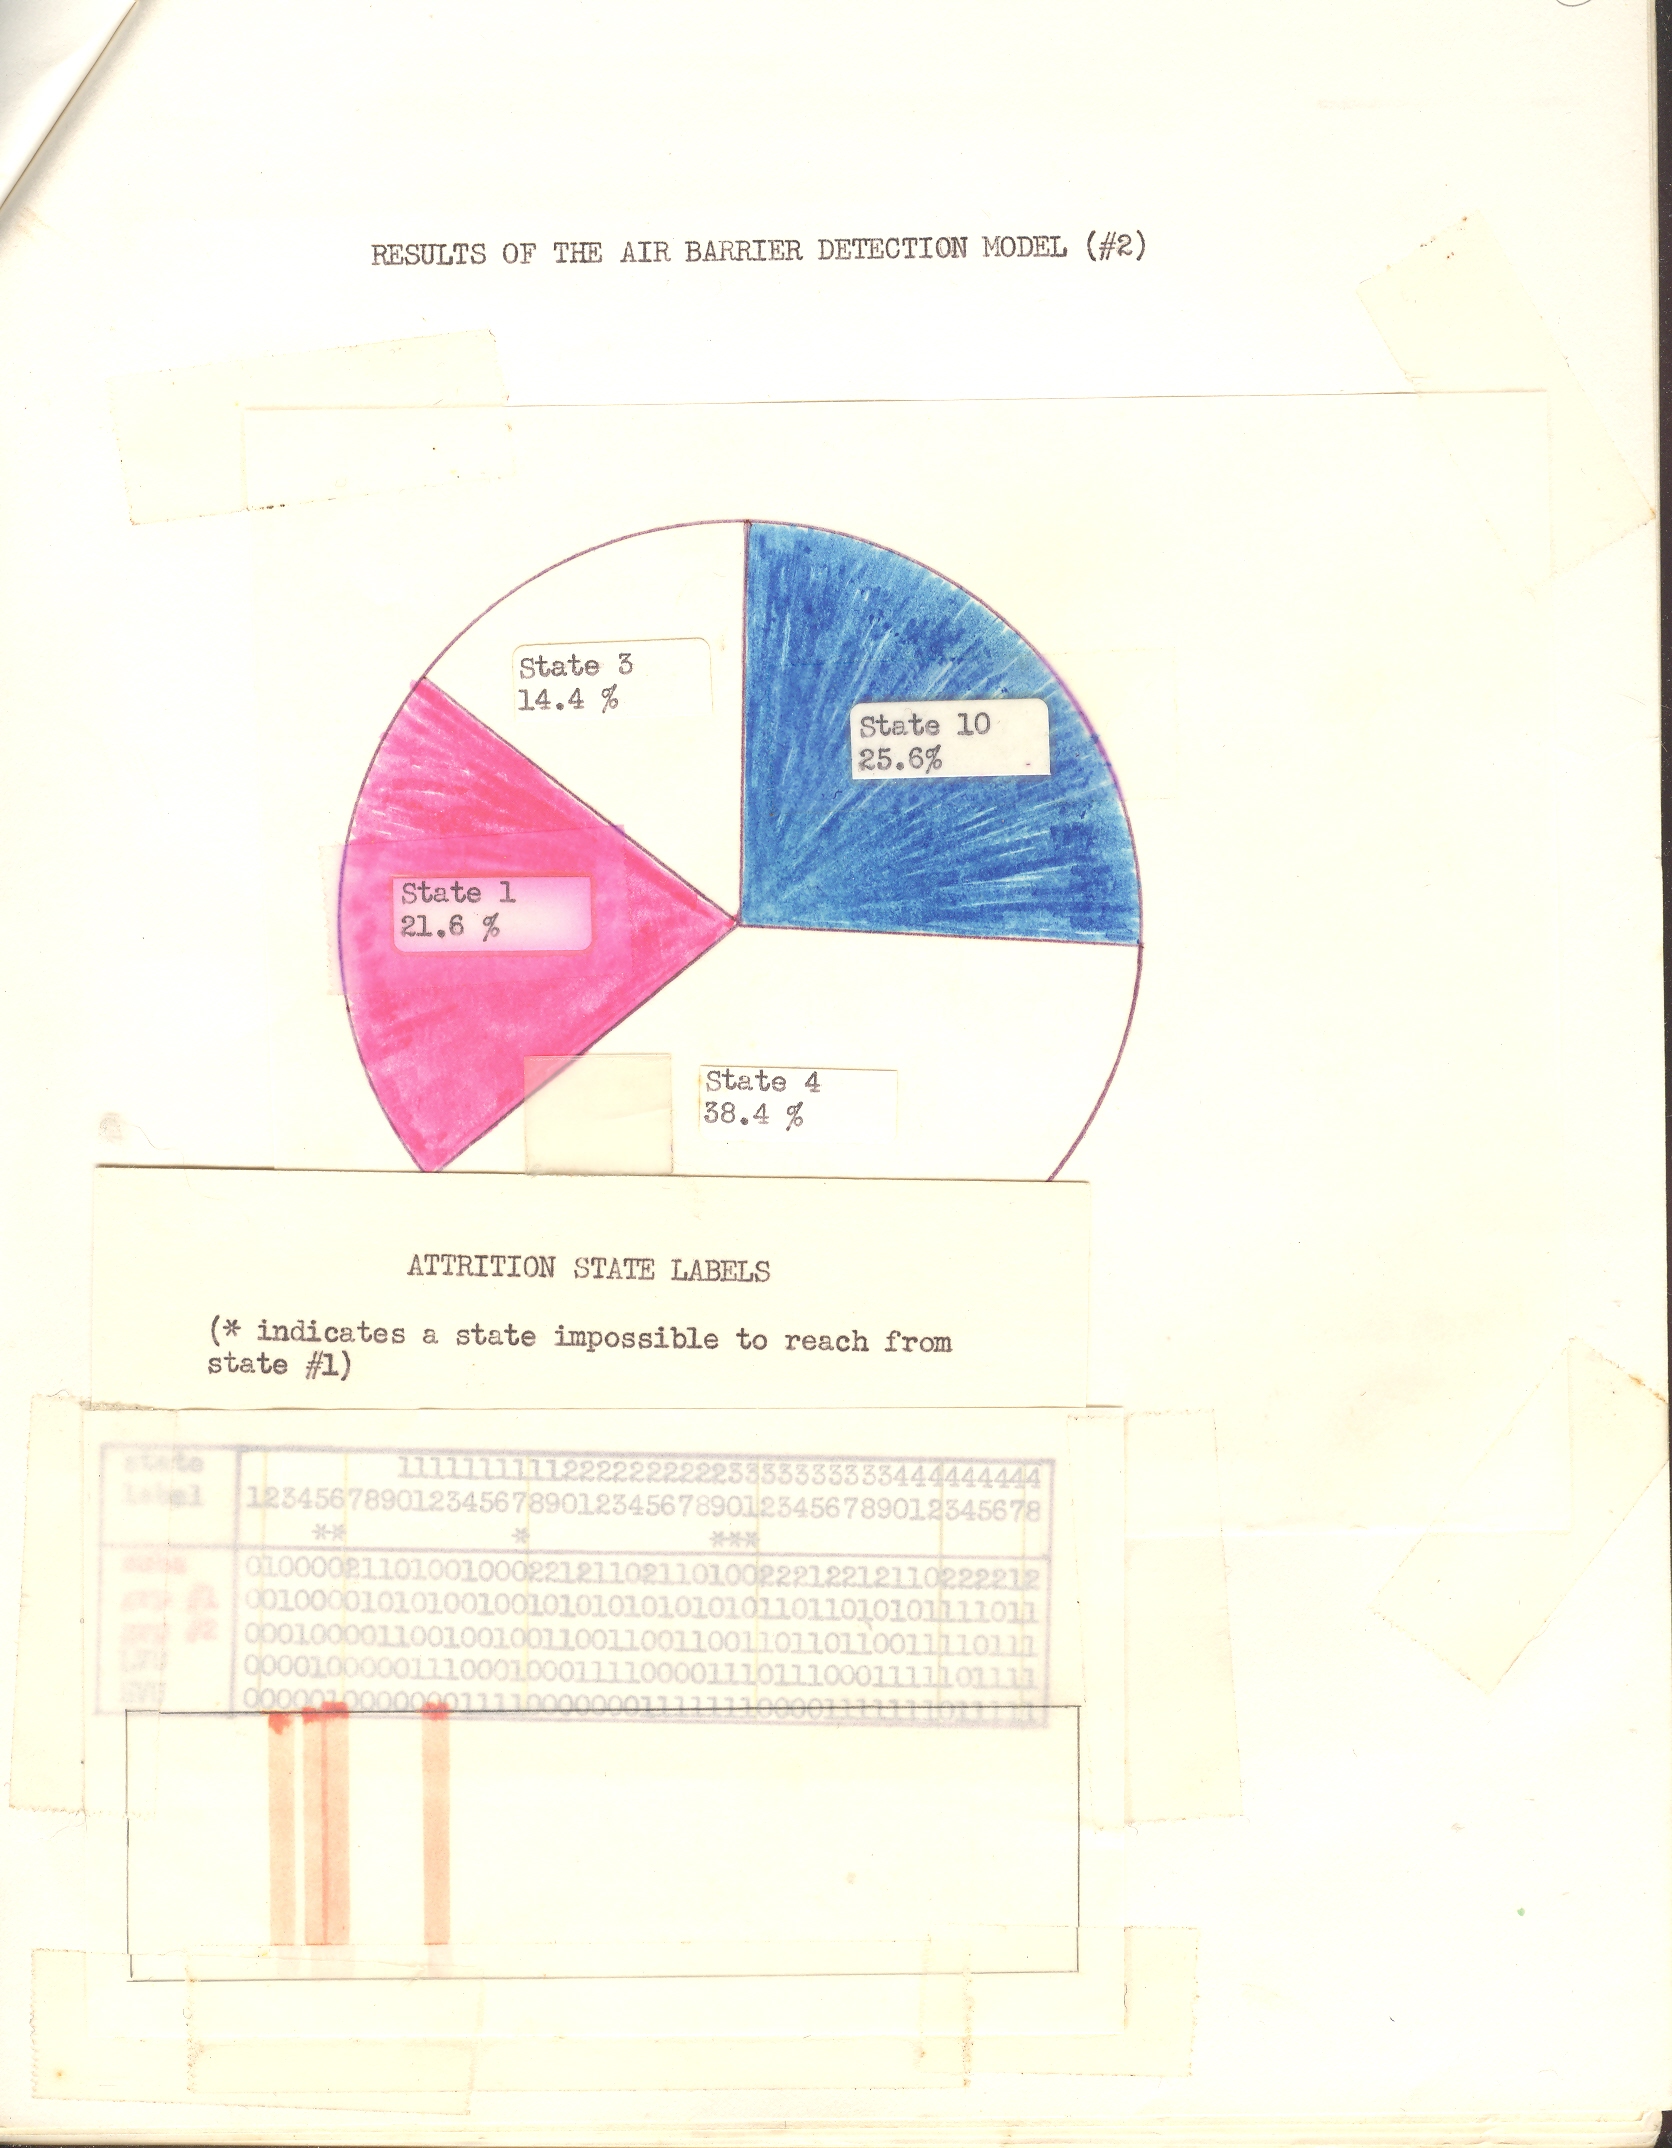
These seem to comprise something like author/speaker’s notes for overhead illustrations for a presentation on a computerized system for the receipt and processing (and summarizing?) of tactical intelligence data on the enemy’s intent on locating and destroying submarines.
What strikes me is the number of cut-outs and paste-ups and such that are part of each slide–every data point, and virtually every notation on each page has been pasted in. There’s much more to this but these certainly give you a decent idea of the analyst/statistician/programmer/engineer bent over his desk doing surgery on his data.