JF Ptak Science Books LLC Post 179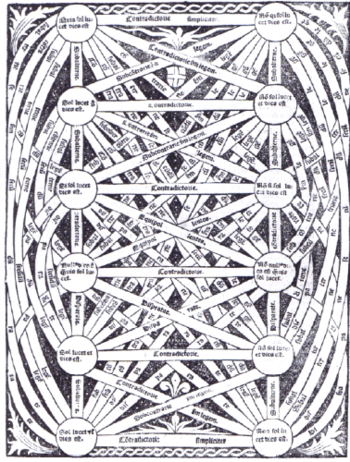
Following up on a post from 21 July about an early graph showing difference over time (state populations,
1790-1860, US Census), I’m thinking that the claim may still be basically true
in it most restricted sense. Doing some
more thinking on how information has been represented and the history of graphs
in general, I think that this is still the case even though there may be some
close associates that reach back hundreds of years into the past.
advanced, morphed, untranquilized version of the square of opposition. A general, basic square of opposition begins
with the four Aristotelian propositions: universal affirmative (symbolized as A, “Omne S est P”. or “Every S is P All S is P”; universal negative (symbolized as E, “Nullum S
est P” or “No S is P All S is not P”; particular
affirmative (symbolized as I, “Quoddam S est P” or Some S is P Some S is Pl
and particular negative (symbolized as O,
“Quoddam S non est P” or Some S is not P
Some S is not P. The parent graph of this inherently perplexing and beautiful logical relations table is below, taken from the Murray State site (and if you follow the link you’ll have a concise and clear explanation of how this works):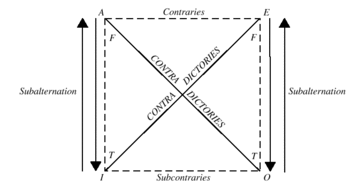
The square of opposition does in a way resemble another interesting graph-like description of an old-school (ancient) mathematical problem: the Knight’s Tour. This is a problem setting forward a chess piece knight on a trip across the chessboard (8×8 square) during which he must touch every square and touch every square but once. (Here’s a way-above interesting [read “obsessive” and lovely] site that gets the issue across in a big, mathematical, artistic manner.)
One solution for the Knight’s Tour as follows (from here)…yes, I know it has nothing to do with what we’re talking about, but it does bear a resemblance to the logical decision maps, which I think is uncommon. 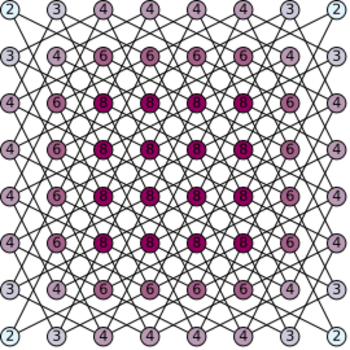

For a wonderful summation of the visualization of data and bearing heavily upon the Renaissance see James Franklin’s Diagrammatic reasoning and modelling in the imagination:the secret weapons of the Scientific Revolution and his website.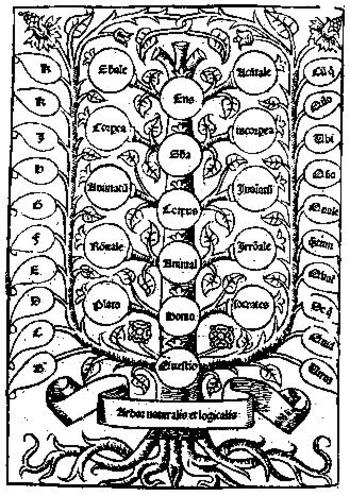
Wandering off the path a little more leads us to the decision scheme known as Porphyrys Tree, a hierarchial organizer based upon the then Aristotlean categories (substance, quantity, relation, quality, doing, undergoing, place where, time when, position and having). These would really form the roots of the Porphyryn Tree, and which, “if they were worked out fully, would contain all the species of the things what are in the world” (from Eleonore Stump Boethius, Cornell; Boethius was the “Last of the Romans”, killed in ca. 526, but whose writings and influence lived on to make him perhaps the greatest tutor of the Middle Ages).