JF Ptak Science Books Post 158 (2008)
This interesting presentation looks to be a lot more useful than it really is—an example of a lovely graphic display of quantitative data in which the information displayed really doesn’t live up to the effort that went into its display. It is pretty, though.
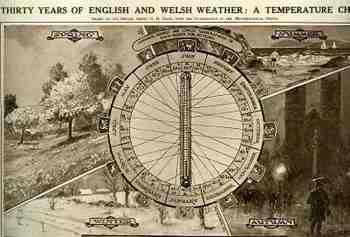
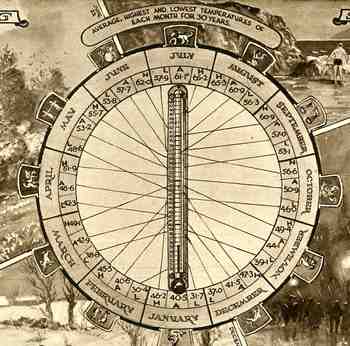
What the chart displays is the average, highest and lowest temperatures for each month over thirty years (1918-1948)—it would’ve been much more effective, and easier, to use even a simple list to display this data. It is nice, however, that you can scale up and down the thermometer to find your months, though the results would be surprising to almost no one.
The descriptive text on the bottom of this page (appearing in the Illustrated London News for 8 January 1949, describes the climate of Britain “though variable. To be one of the most salubrious in the world”, which is a description for the island that you don’t often see.
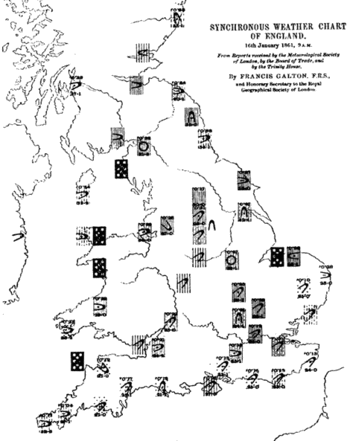
Given the amount and distribution of weather data it is of course a highly problematic issue in displaying it all—Francis Galton (the man for all seasons’ chart is below) tried this in 1881 (the same year that he published what is recognized as the first paper on synesthesia) with mixed results. There are earlier efforts that deal with world and continental weather types but these maps gave a broad view of global weather types. Don’t get me wrong, looking at a world weather map in 1861 was still a very big deal in the control and display of data.