JF Ptak Science Books Post 1173
Although maps showing the depths of the oceans existed from about the mid-19th century (through the pioneering work of the American father of oceanography, Virginia’s Matthew Fontaine Maury1) few casual readers would have ever seen a more approachable representation of information than what appeared in the Illustrated London News for 8 October 1910. Although Maury’s maps are elegant, they didn’t receive nearly as wide a distribution as this ILN image–also they weren’t nearly quite as relational as the 1910 version.
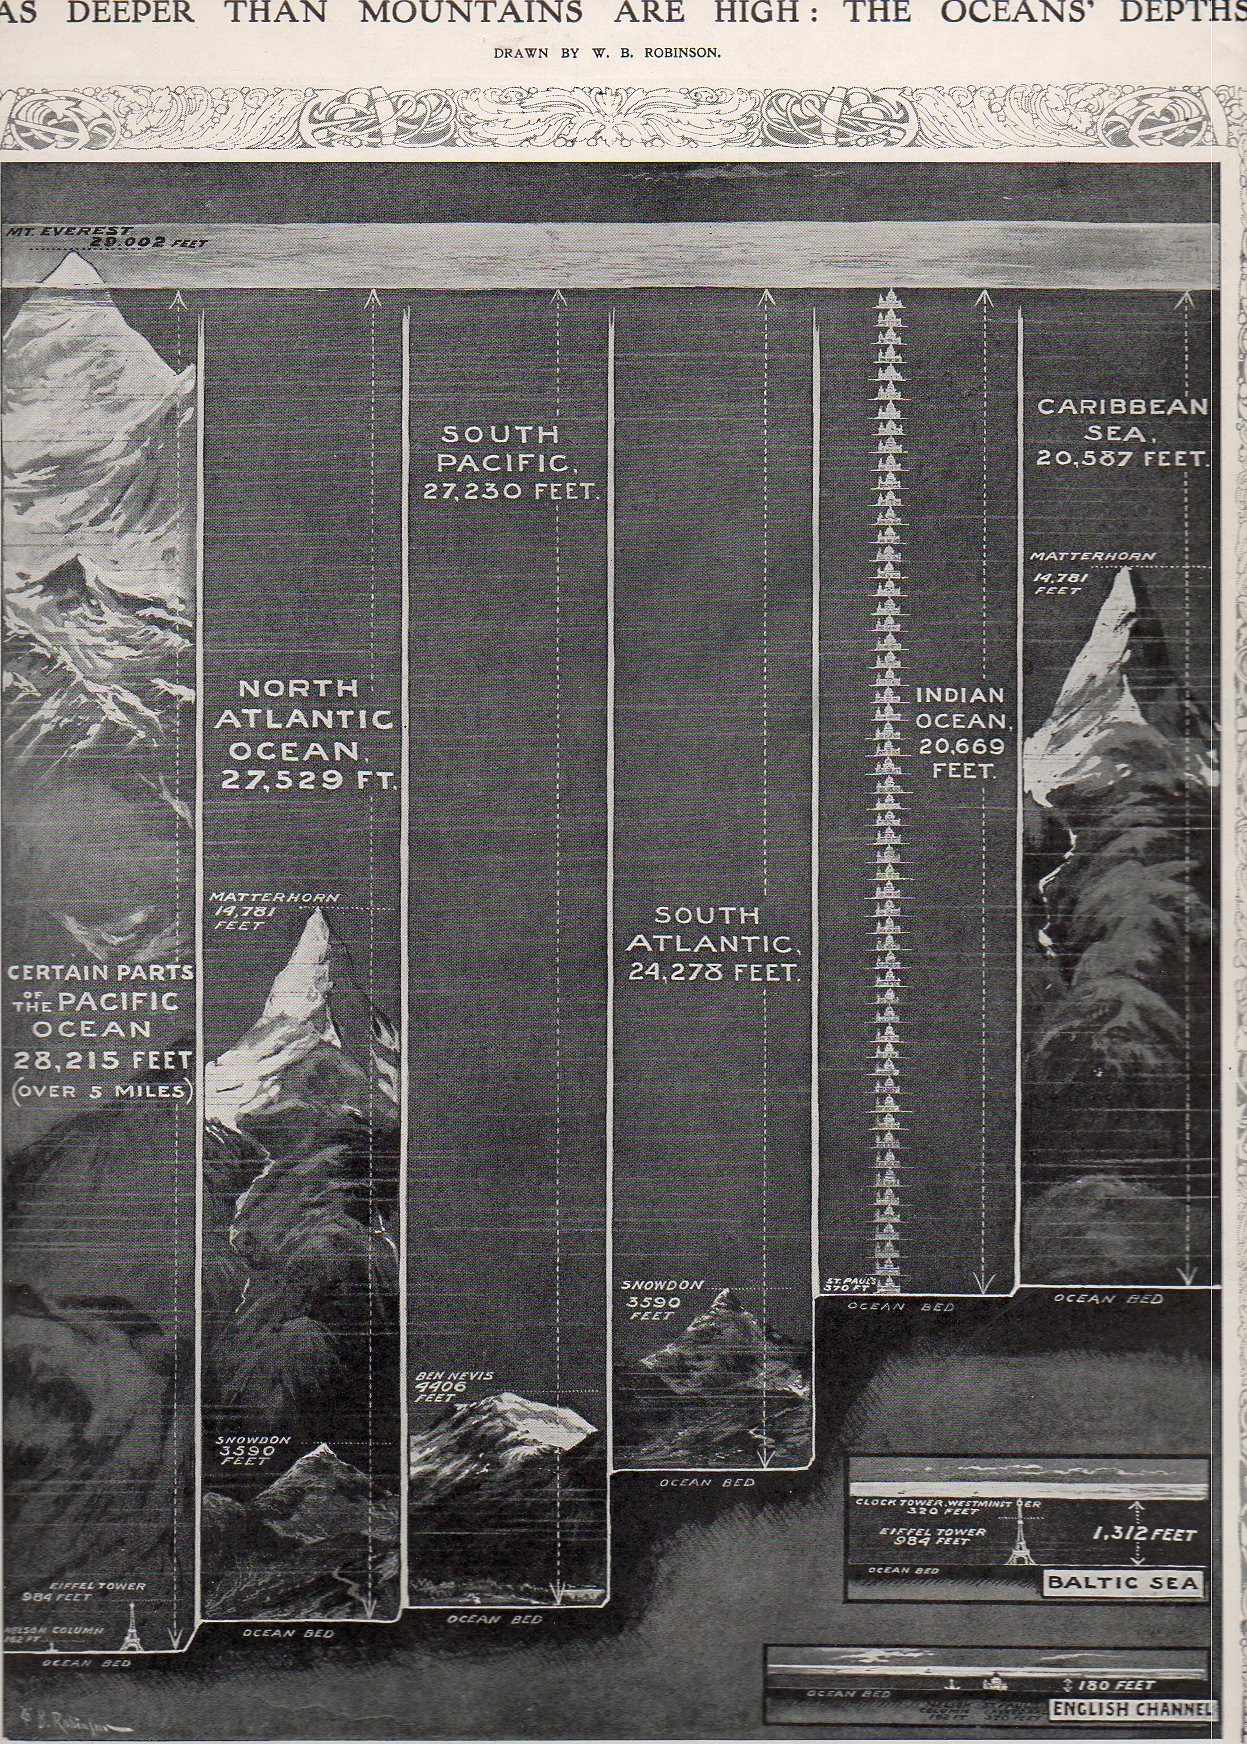
Granted, the 1910 comparison chart only displays one statistic–the supposed greatest dept of five oceans, two seas and the English channel–it does so in such a way as to make those numbers immediately approachable to any reader, which is always an issue in relating scientific information to the general reader.
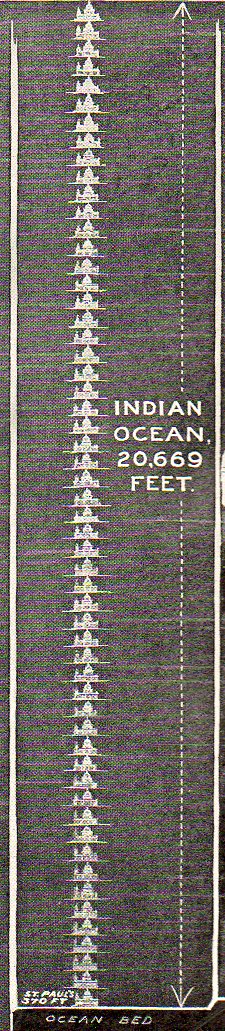
 {One of the standard unit of measurement for the purpose of this display was St. Paul’s Cathedral.]
What W.B. Robinson presented was a way of looking at an invisible entity through very visible means–comparing depth to the heights of things that everybody in 1910 knew: the Eiffel Tower (relatively newly constructed out of 18,000 prefabricated highly-engineered pieces) and St. Paul’s Cathedral. So rather than stating that the Pacific Ocean is 28,000 feet deep, Robinson chose to replace feet with Nelson’s Column–174 of them. Or 29 Eiffel Towers. The 20,000-foot deep Indian Ocean was actually 56 St. Paul’s deep, while the Baltic Sea was deep enough to not quite cover one Eiffel Tower with one Westminster Bell Tower on top (ha!); and the English Channel at its deepest wouldn’t quite cover St. Paul’s.
This is really the way to display data in my book, especially to kids. This is one of the few ways of making the information accessible and understandable across almost all age ranges.
Notes:
1. Actually the work goes back a century before Maury with Buache, who produced this map of the English Channel in 1737–the data points are veyr numerous, but this is the very first time that such information was available on a map.


And Maury again with this first map of an oceanic basin, published in 1853:

And in 1752, Philippe Buache produced this fantastic and first-of-its-kind map for the depths of the English Channel:

Here’s an extraordinary cross sectrion of a part of the ocean floor produced in 1857 by the HMS Cyclops in preparation for laying the Atlantic Cable:

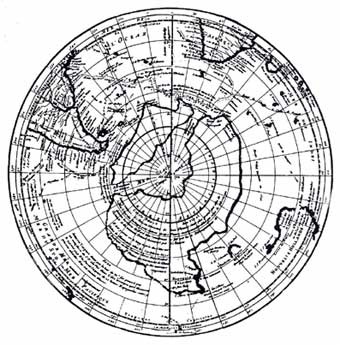
Its also interesting to note here Buache’s work on this map of Antarctica, published in 1737. Buache put together all of the known (to him) information about the mass in the South, bits taken from other maps, and accumulated them into what was the best-possible guess on what was down there in the Antiopode. Pretty good detective work given the amount of material that he could work with.