JF Ptak Science Books Quick Post
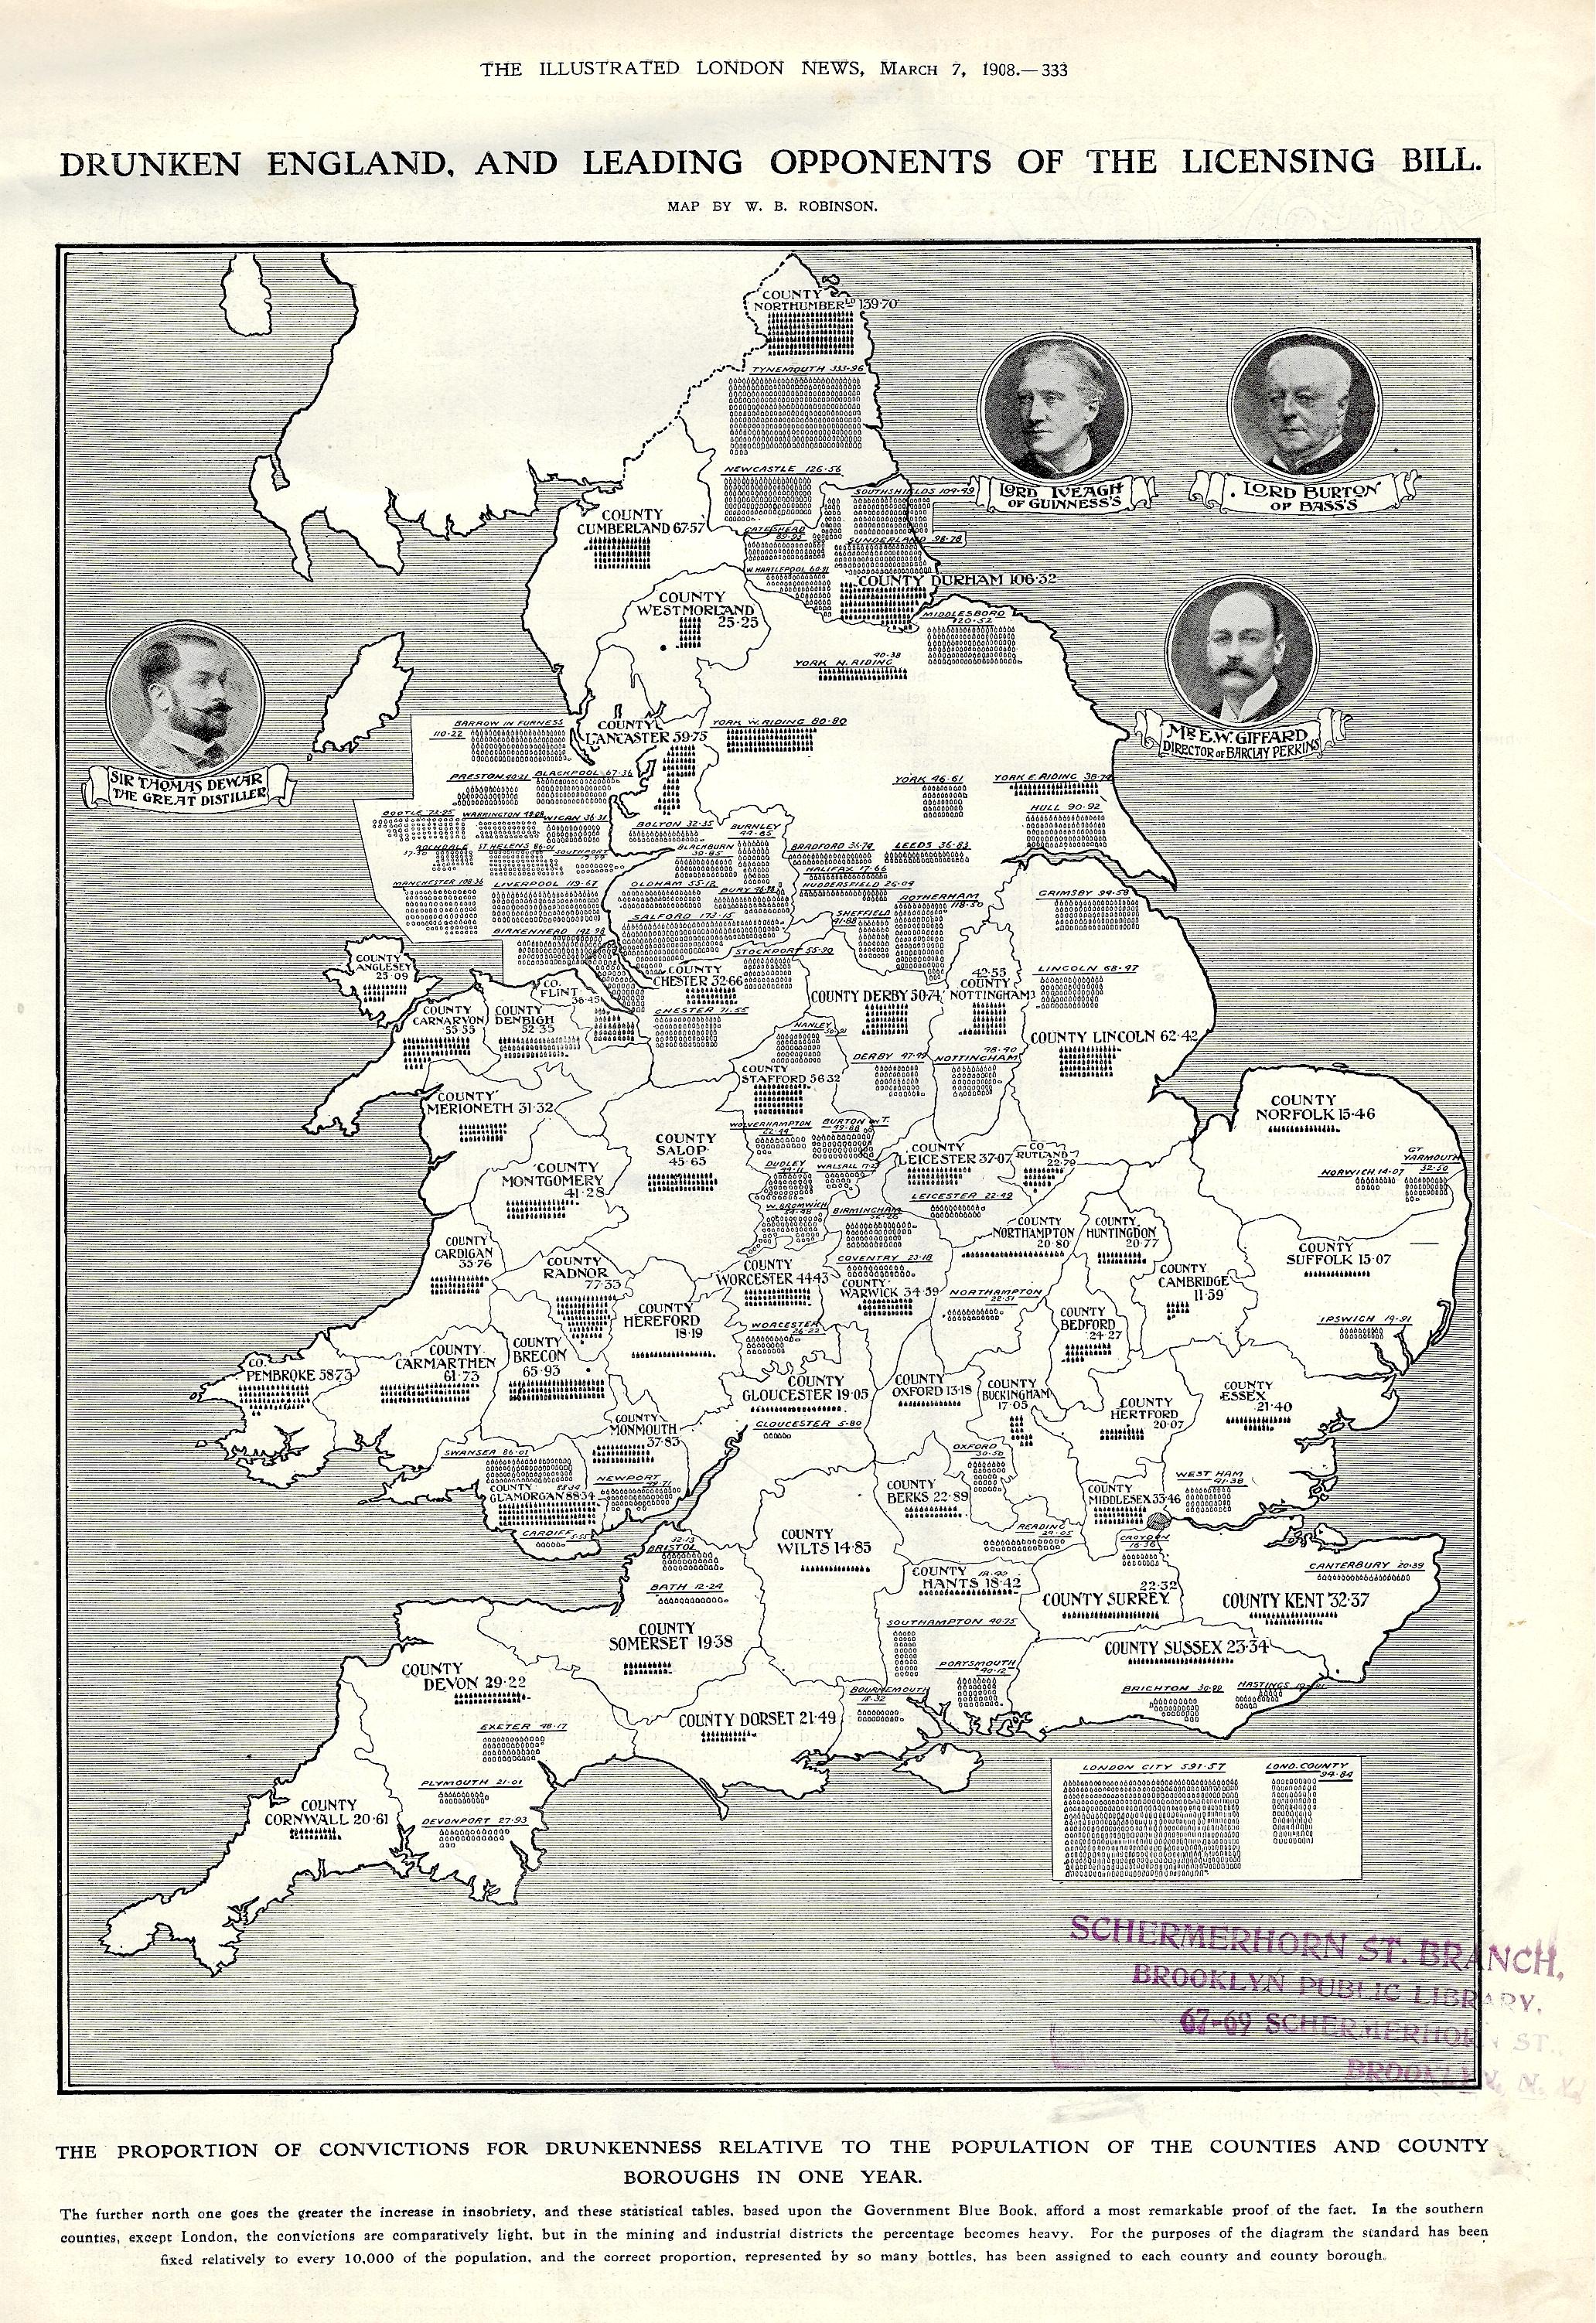
And so, here we are, my first ever encounter with a map of drunken England, printed in the Illustrated London News om March 7, 1908. As a data visualization element in a pretty buttoned-up periodical printed during a pretty buttoned-up period, it carries a provocative title using “Drunken” and “England”.
The subtitle reads: “the proportion of convictions for drunkenness relative to the population of the counties and county boroughs in one year”. It continues: “the further north one goes the greater the increase in insobriety, and these statistical tables, based upon the Government Blue Book, afford a most remarkable proof of the fact. In the southern counties, except London, the convictions are comparatively light, but in the mining and industrial districts the percentage becomes heavy. For the purposes of the diagram the standard has been fixed relatively to every 10,000 of the population, and the correct proportion, represented by so many bottles…”