JF Ptak Science Books LLC Post 383
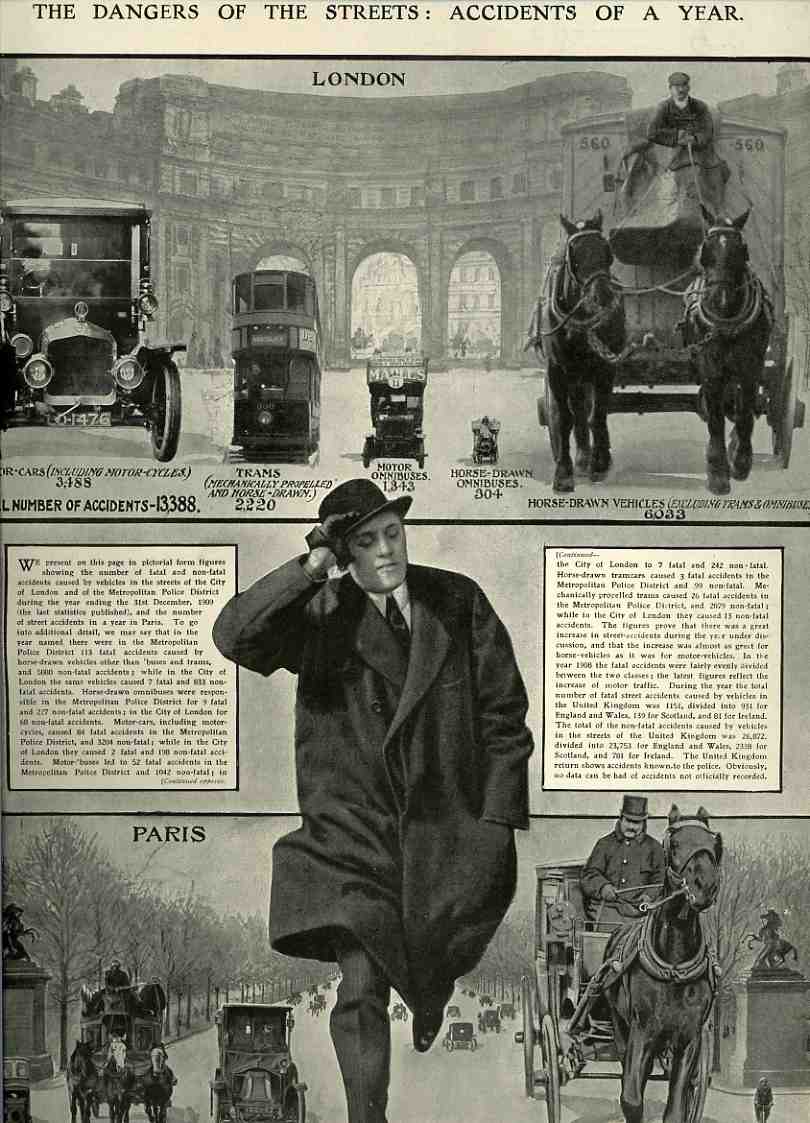
Aside from looking allot like something that Max Ernst could’ve produced (at about the same time), this graphic from The Illustrated London News for 11 March 1911 simply but powerfully portrays street accidents (for the year 1910) in london and Paris. Beautiful and compelling, it is somewhat an empty gesutre, because as much as it describes the various types of accidents it fails to give us the total number of vehicles in use for each category; so, we can compare gross figures only, which is a little vacant. We learn that the majority of accidents were caused by horse-drawn vehicles; in London, the number of “accidents” for this category was 6,033; for the same period the motor-car (“including motor-cycles”) was 3,488–we have no idea about how many of these were actually on the streets not involved in accidents, or the amount of usage, and the like. My guess is that there must’ve been–still–many multiples of horse-drawns vs. cars. So, if there were ten times the number of horse-drawns on the street, these figures would tell you how dangerous the cars actually were (producing half the number of accidents with one-tenth the number of vehicles); also, the horse-drawns were probably logging more street-time per unit in general, so the “danger” aspect of the motorized vehicle grows further still.
The other bothersome apples vs. oranges bit is the comparison of Paris and London; again, we don’t have the total number of vehicles, or the populations in general, or pedestrian populations in particular, or the area of the cities, or the miles of raoa, etc. etc. We do see though that Paris had four times the number of accidents than London, though this seems a pretty meaningless stat. Nevertheless, I still like the design quality of the set of images even if the statistical quality is weak. What can I say? It is pretty, and I like the running man…