JF Ptak Science Books Quick Post
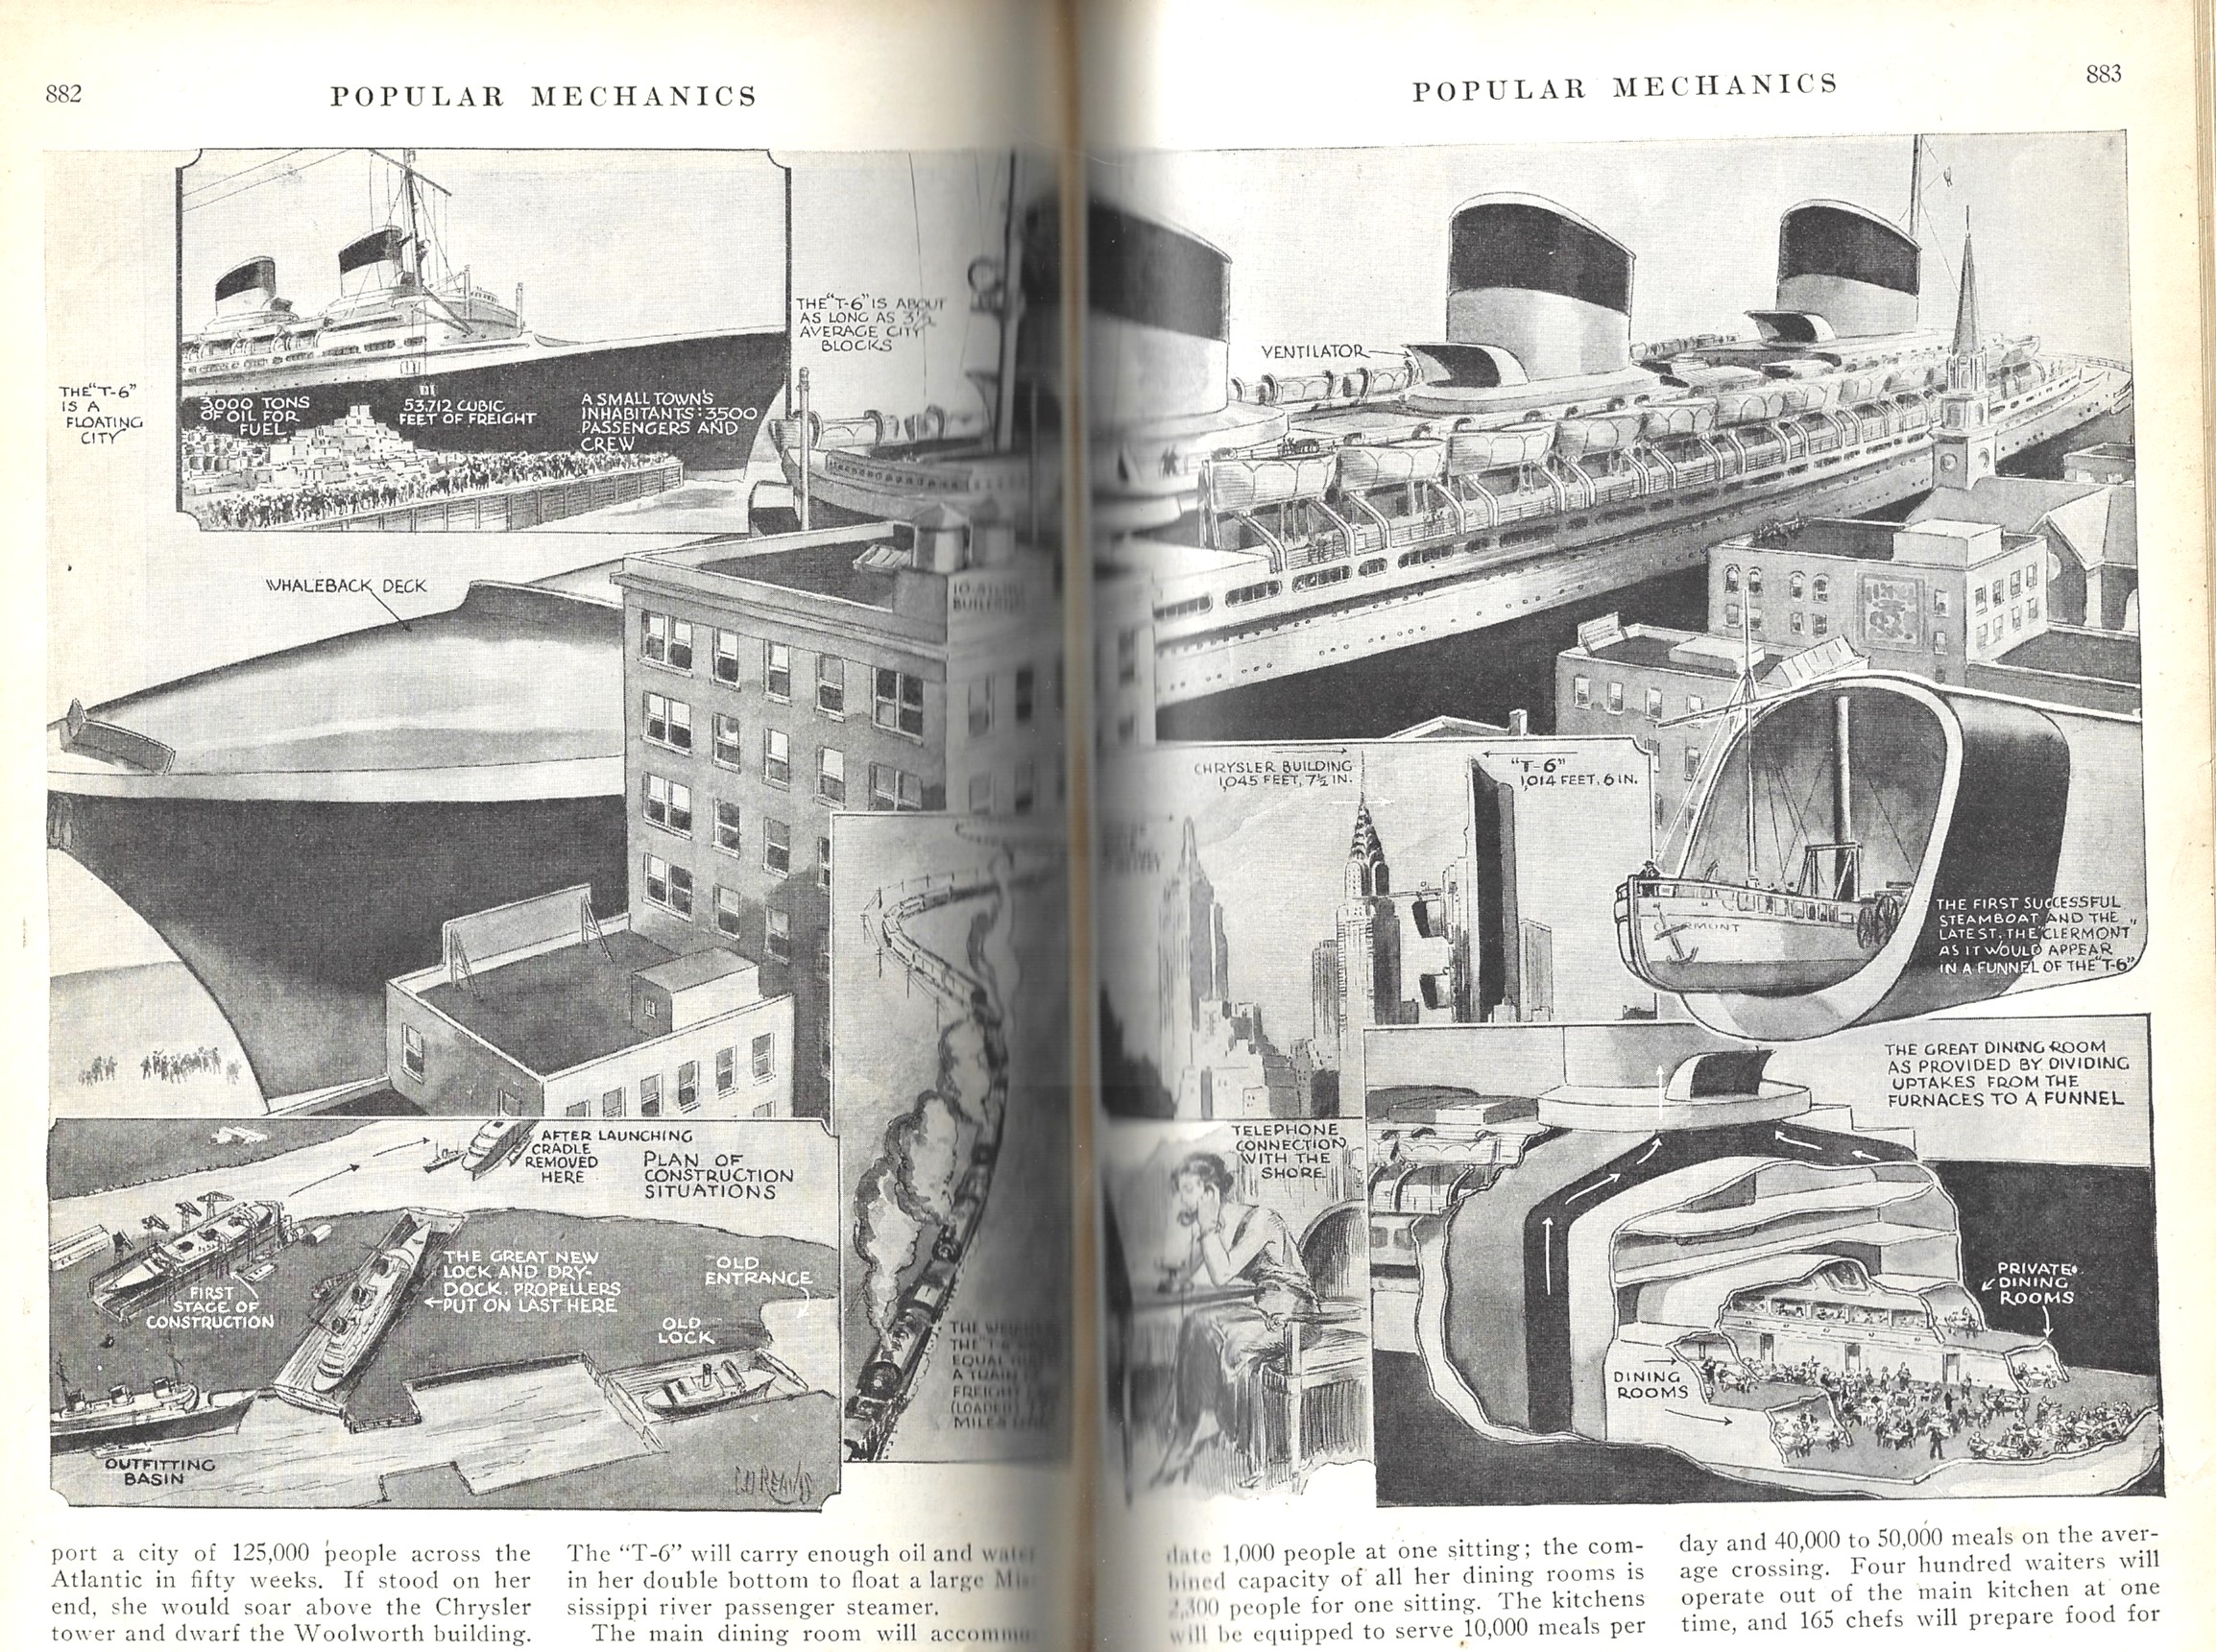
There are a number of posts on this blog looking at how data is visualized, some of which use ships and skylines and waterfalls and pyramids to compare their relative sizes. This article (“T-6 The Latest Giant of the Sea” by D.N. Glass in Popular Mechanics, December 1932) uses illustrative means to display the statistics of the luxury liner Normandie (at the time known as the T-6) one of which employs the comparison of the ship to a skyscraper–actually, the comparison uses two skyscrapers, the Empire State Building and the Chrysler Building.
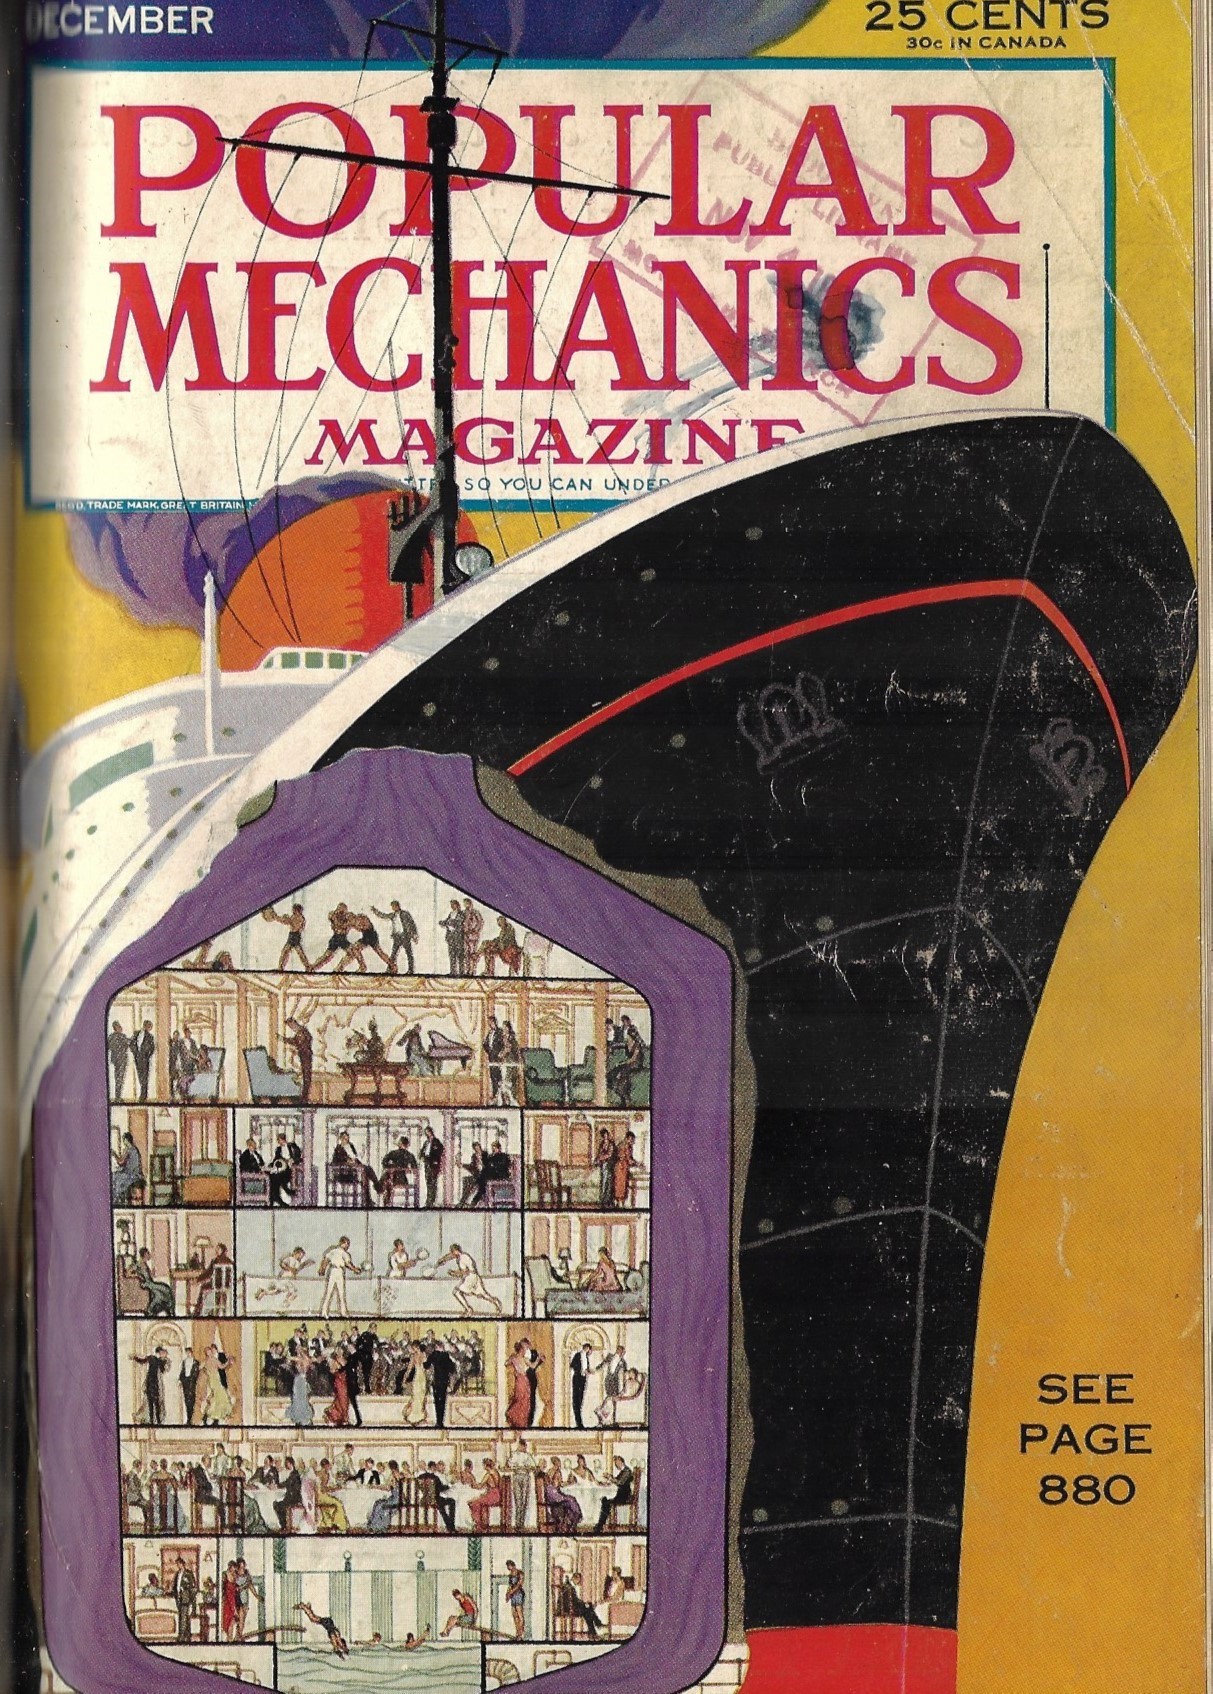
The cover of this issue uncommonly features a cross section: