A Daily History of Holes, Dots, Lines, Science, History, Math, Physics, Art, the Unintentional Absurd, Architecture, Maps, Data Visualization, Blank and Missing Things, and so on. |1.6 million words, 7500 images, 4.9 million hits| Press & appearances in The Times, Le Figaro, Mensa, The Economist, The Guardian, Discovery News, Slate, Le Monde, Sci American Blogs, Le Pont, and many othr places… 5000+ total posts since 2008.

Comparative Naval Strength in an Infographic, 1905

JF Ptak Science Books   Quick Post  (Quantitative Display of Information Series)

Here’s another in a long series of Quick Posts on the artistic display of data: this one shows comparative naval strengths just after the turn of the century around the time of the First Moroccan Crisis, and appears in the 5 July 1905 issue of the Scientific American, home to a great number of these examples of popular numerical presentation.  Rule Britannia:
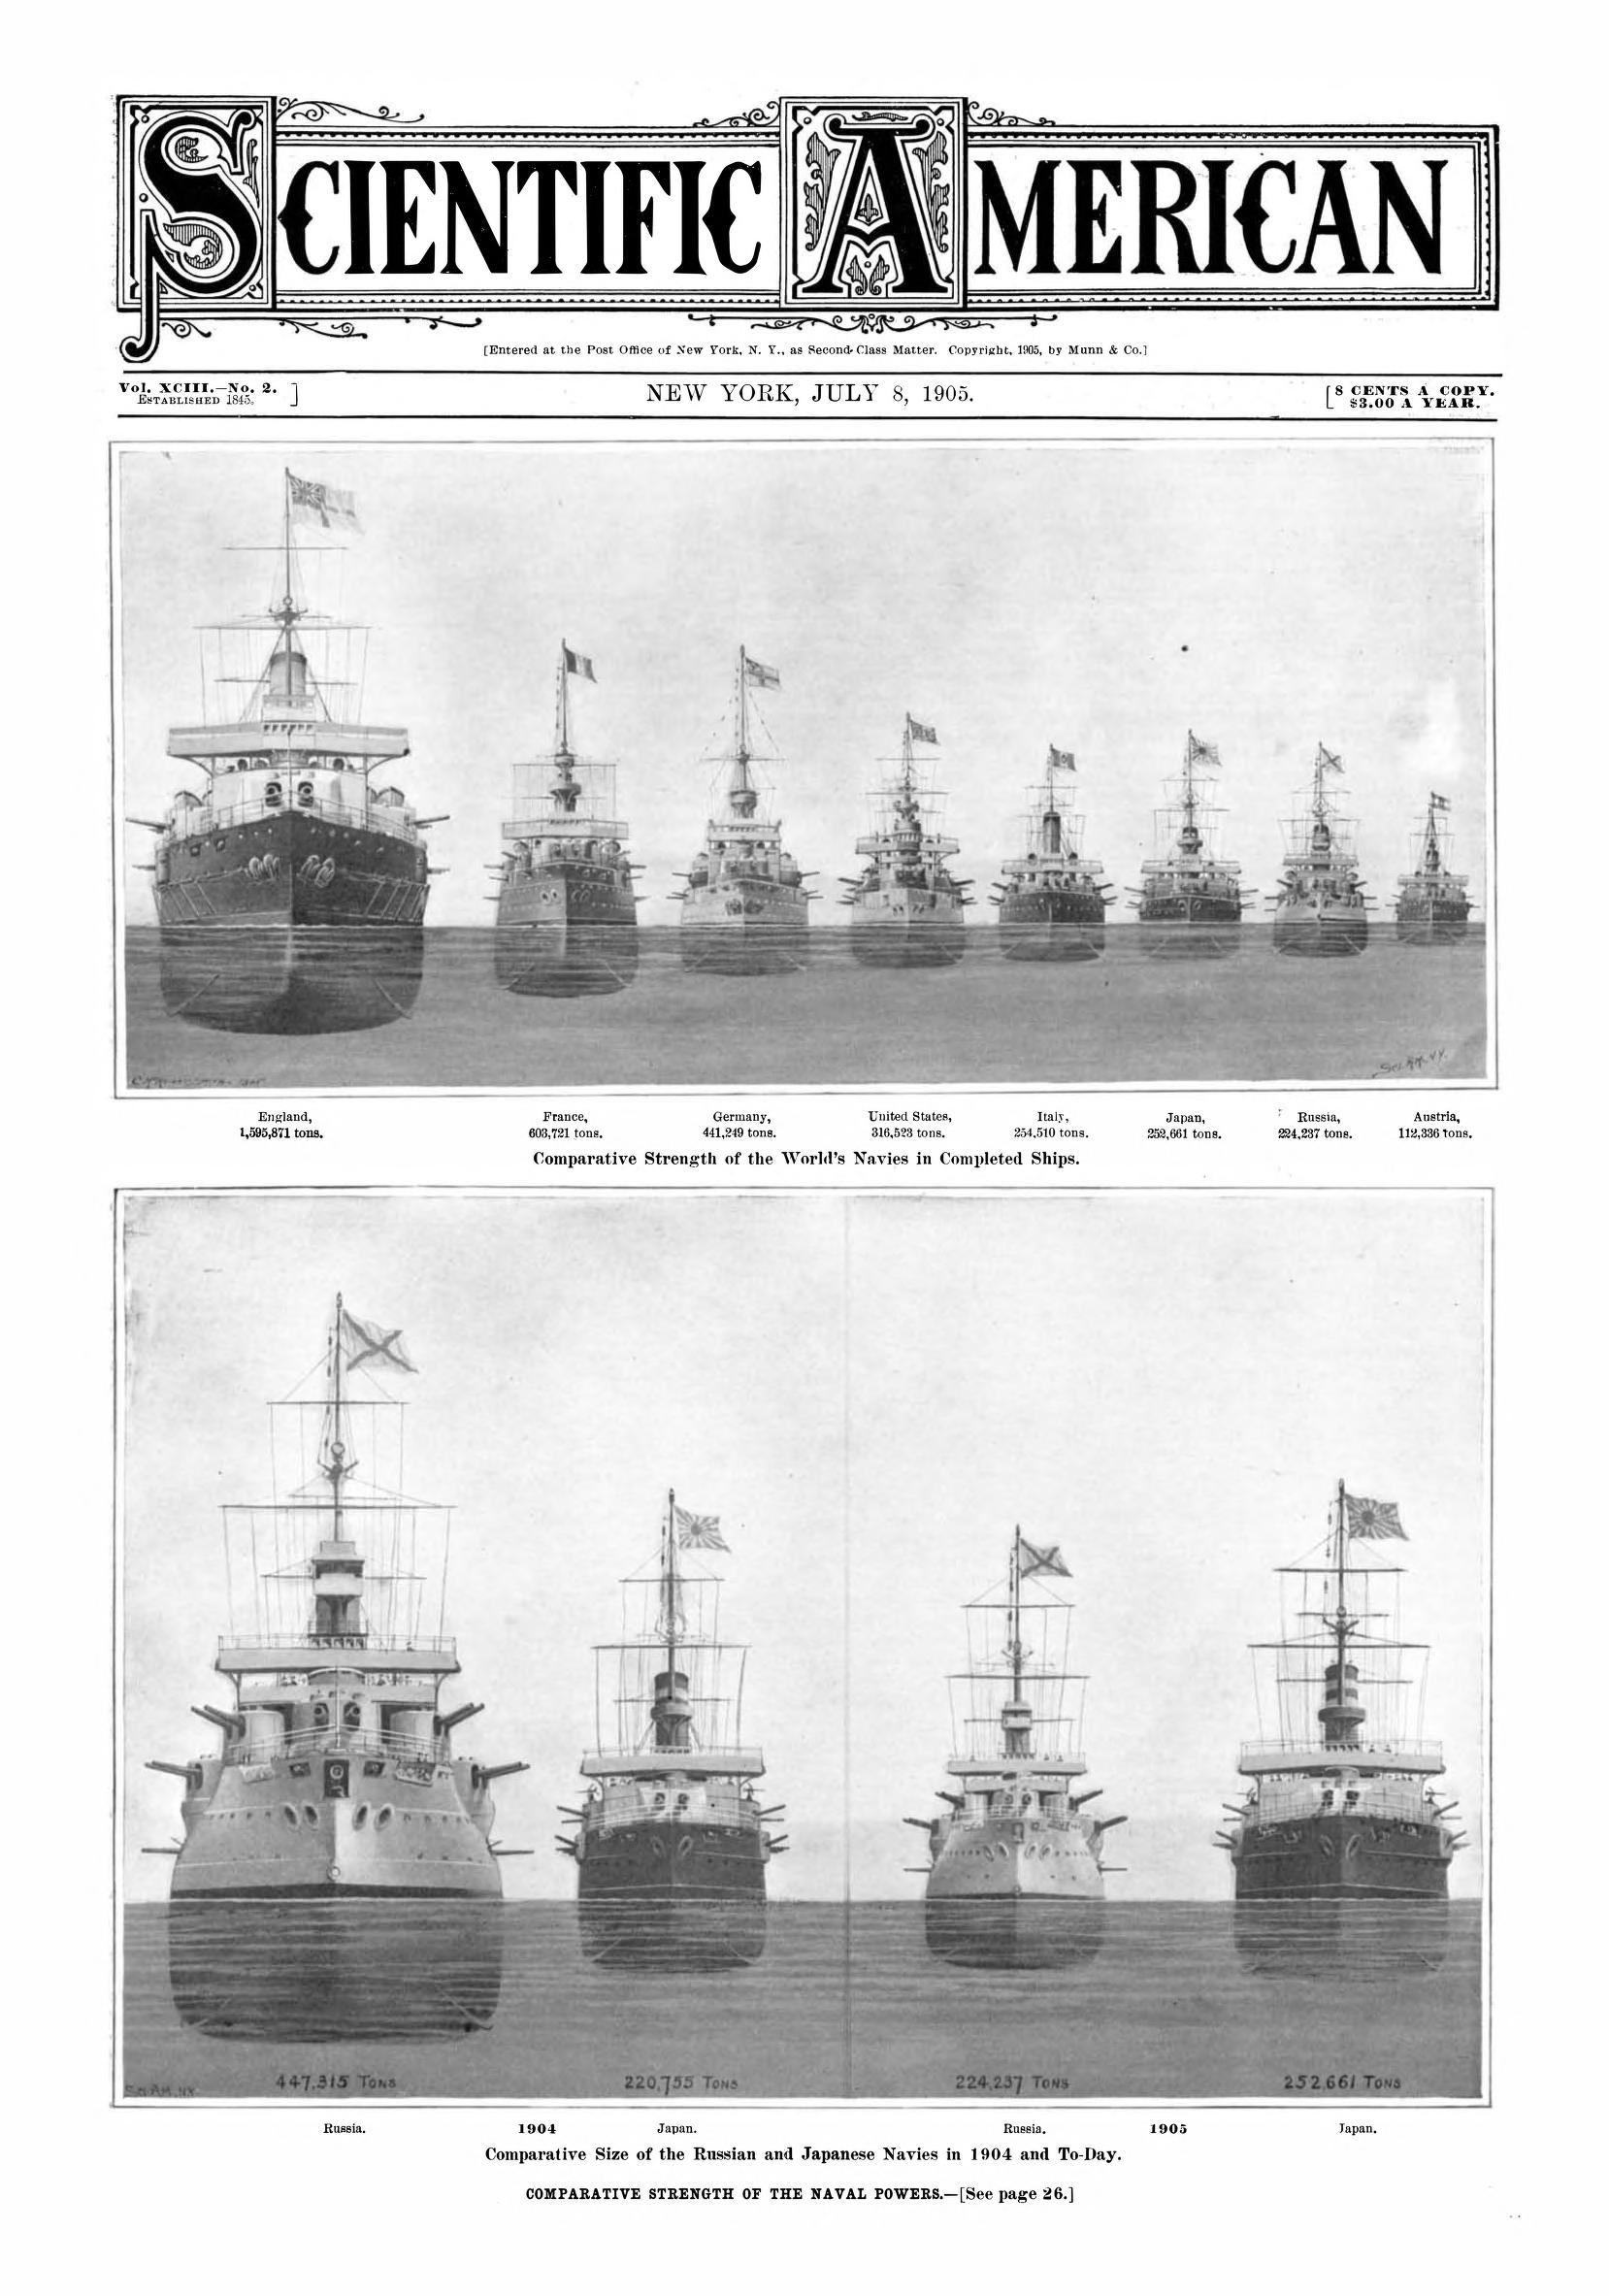
Sci Am 1905 comparative naval strength

Recent Posts

Archives

Categories