JF Ptak Science Books Quick Post Series on the Depiction of Quantitative Data
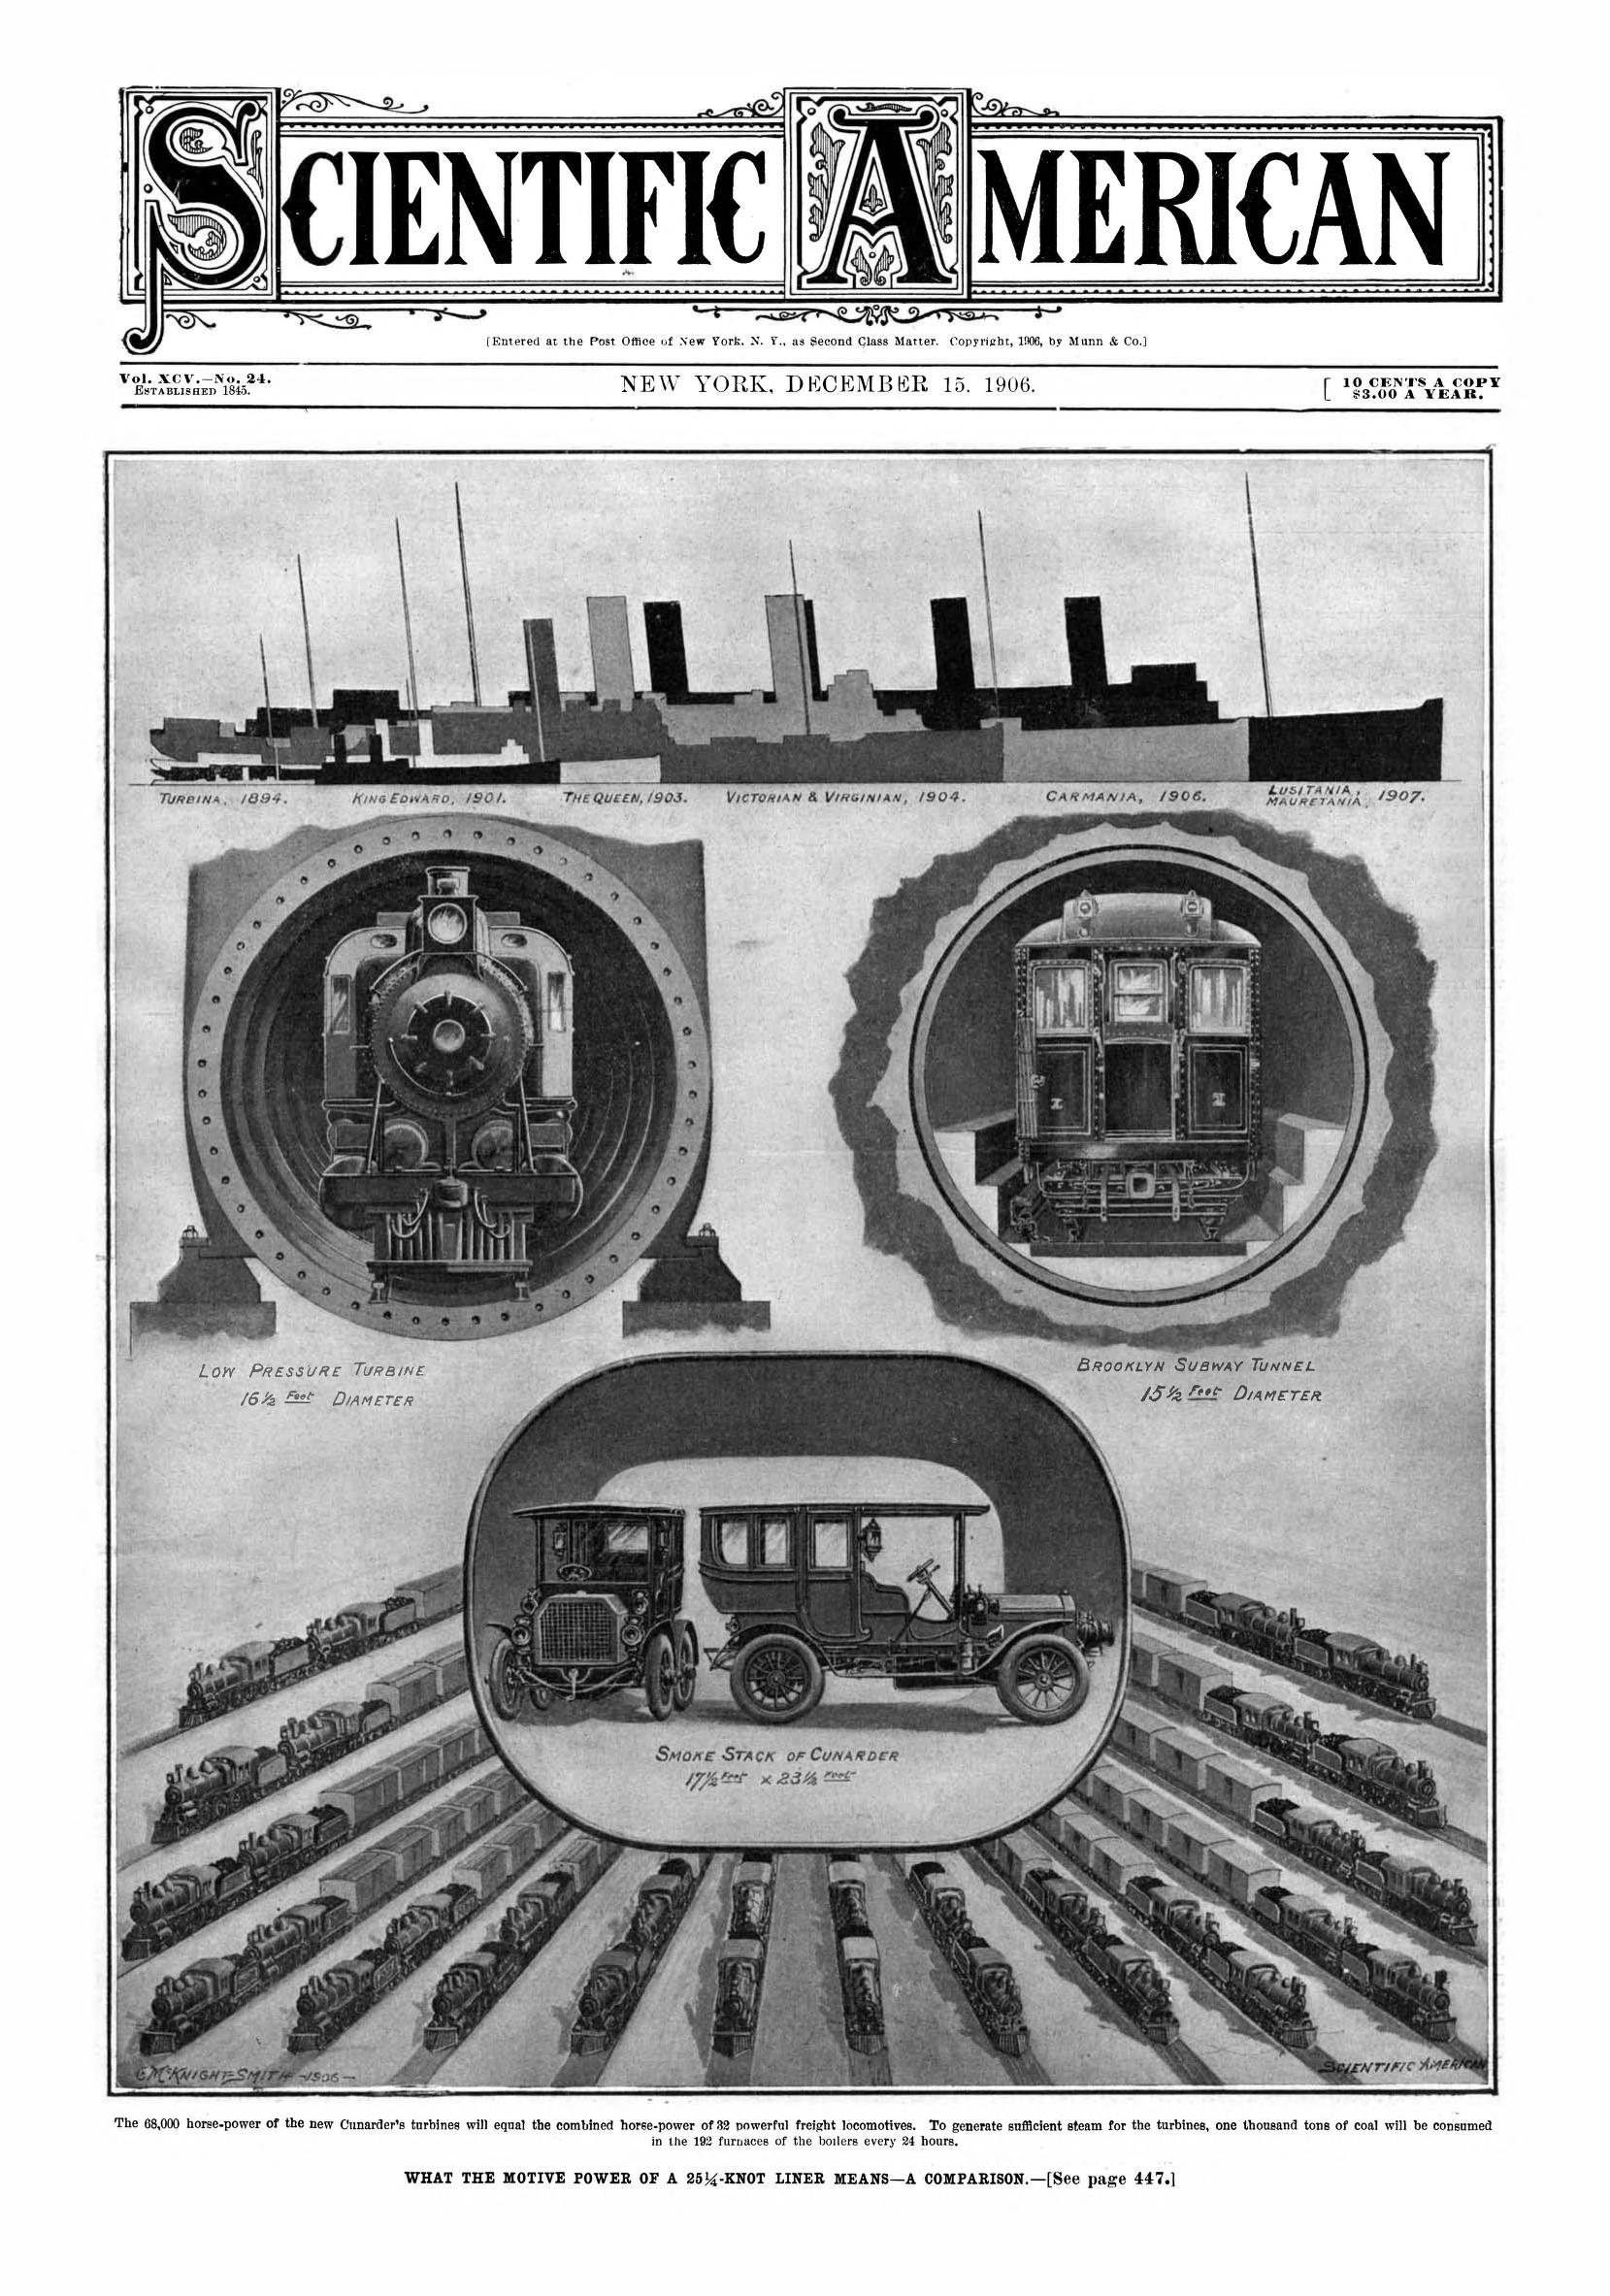
There are a number of entries on this blog on graphical representations using popular and familiar objects to measure some other mostly-unknown object or idea against. For example, the amount of dirt excavated for the Panama canal was measured and depicted in one article in terms of how many Great Pyramids it would fill; the dept of oceans was measured in terms of Eiffel Towers, and the heights of buildings measured with ocean liners. Trinity Church has been used quite a few times, as has the Woolworth and Empire State buildings. In today’s example there are two examples of measuring things in terms of large groups of trains. The first is a visualization of data depicting the energy generated by the power plant of an ocean liner, found in the pages of the great Scientific American for December 15, 1906; the second uses a vast line of trains to depict the amount of mail delivered in the U.S. over the course of one year. Enjoy!