JF Ptak Science Books Quick Post
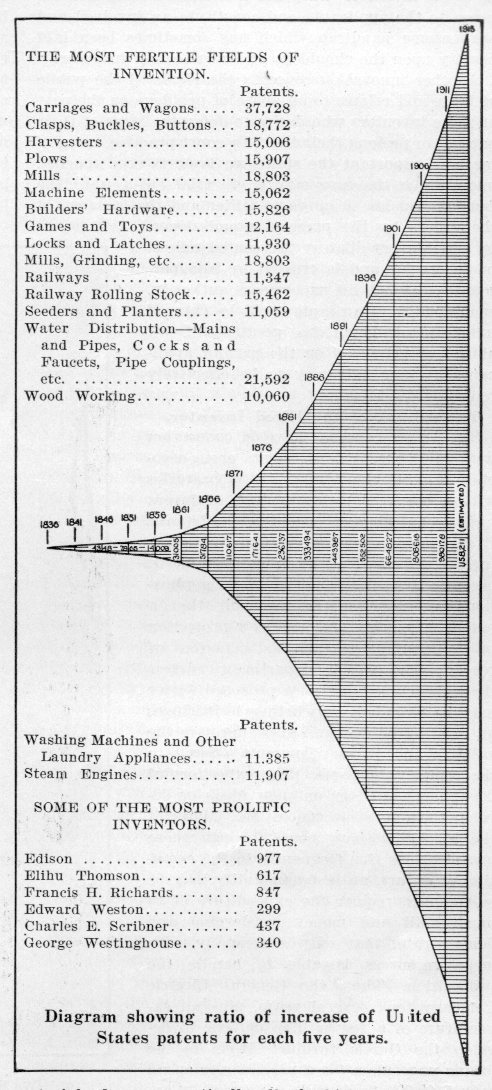
In one of the articles celebrating its 70th Anniversary, Scientific American published these two graphs showing the development of patents from 1836 to 1915. They appeared in the June 5, 1915 issue, and distributed the patents also according to type. It is interesting to note that for decades that the magazine kept one page (or part of it) devoted to displaying newly-recorded patents–that practice was abandoned by the time the 1915 article appeared, which is too bad, because it was enjoyable to dip into the archive and see what was being patented at weekly intervals over the years. In any event I’m not sure that I’ve seen visual displays quite like this, and so I share them: