JF Ptak Science Books Post 2427
This graph shows the growing shadow of The End, the falling curtain, creeping across the the vertical and the horizontal. This was published to show the results of the fatal 1933 election–this was the one right after Hindenburg appointed Hitler Chancellor who immediately dissolved the Reichstag and so necessitated a new election. That election followed months later, and in spite of massive Brown Shirt presence, plus NSDAP intimidation, violence, coercion and son on, Hitler’s party did very well, but perhaps surprisingly not as successful given all of those other factors. He didn’t have control of the government as a result of the election that gave the Nazis 43% of the seats in the Reichstag. It would come to develop that Hitler and the party found enough support to implement the Enabling Act, which would give Hitler the power to enact laws without the support of the Reichstag. Four months later, with the political and power struggle over, there were no other parties in Germany besides the Nazi Party, and that would become Hitler’s ultimate power, and the true beginning of the rotting of Germany and the coming of the deaths of dozens of millions of people.
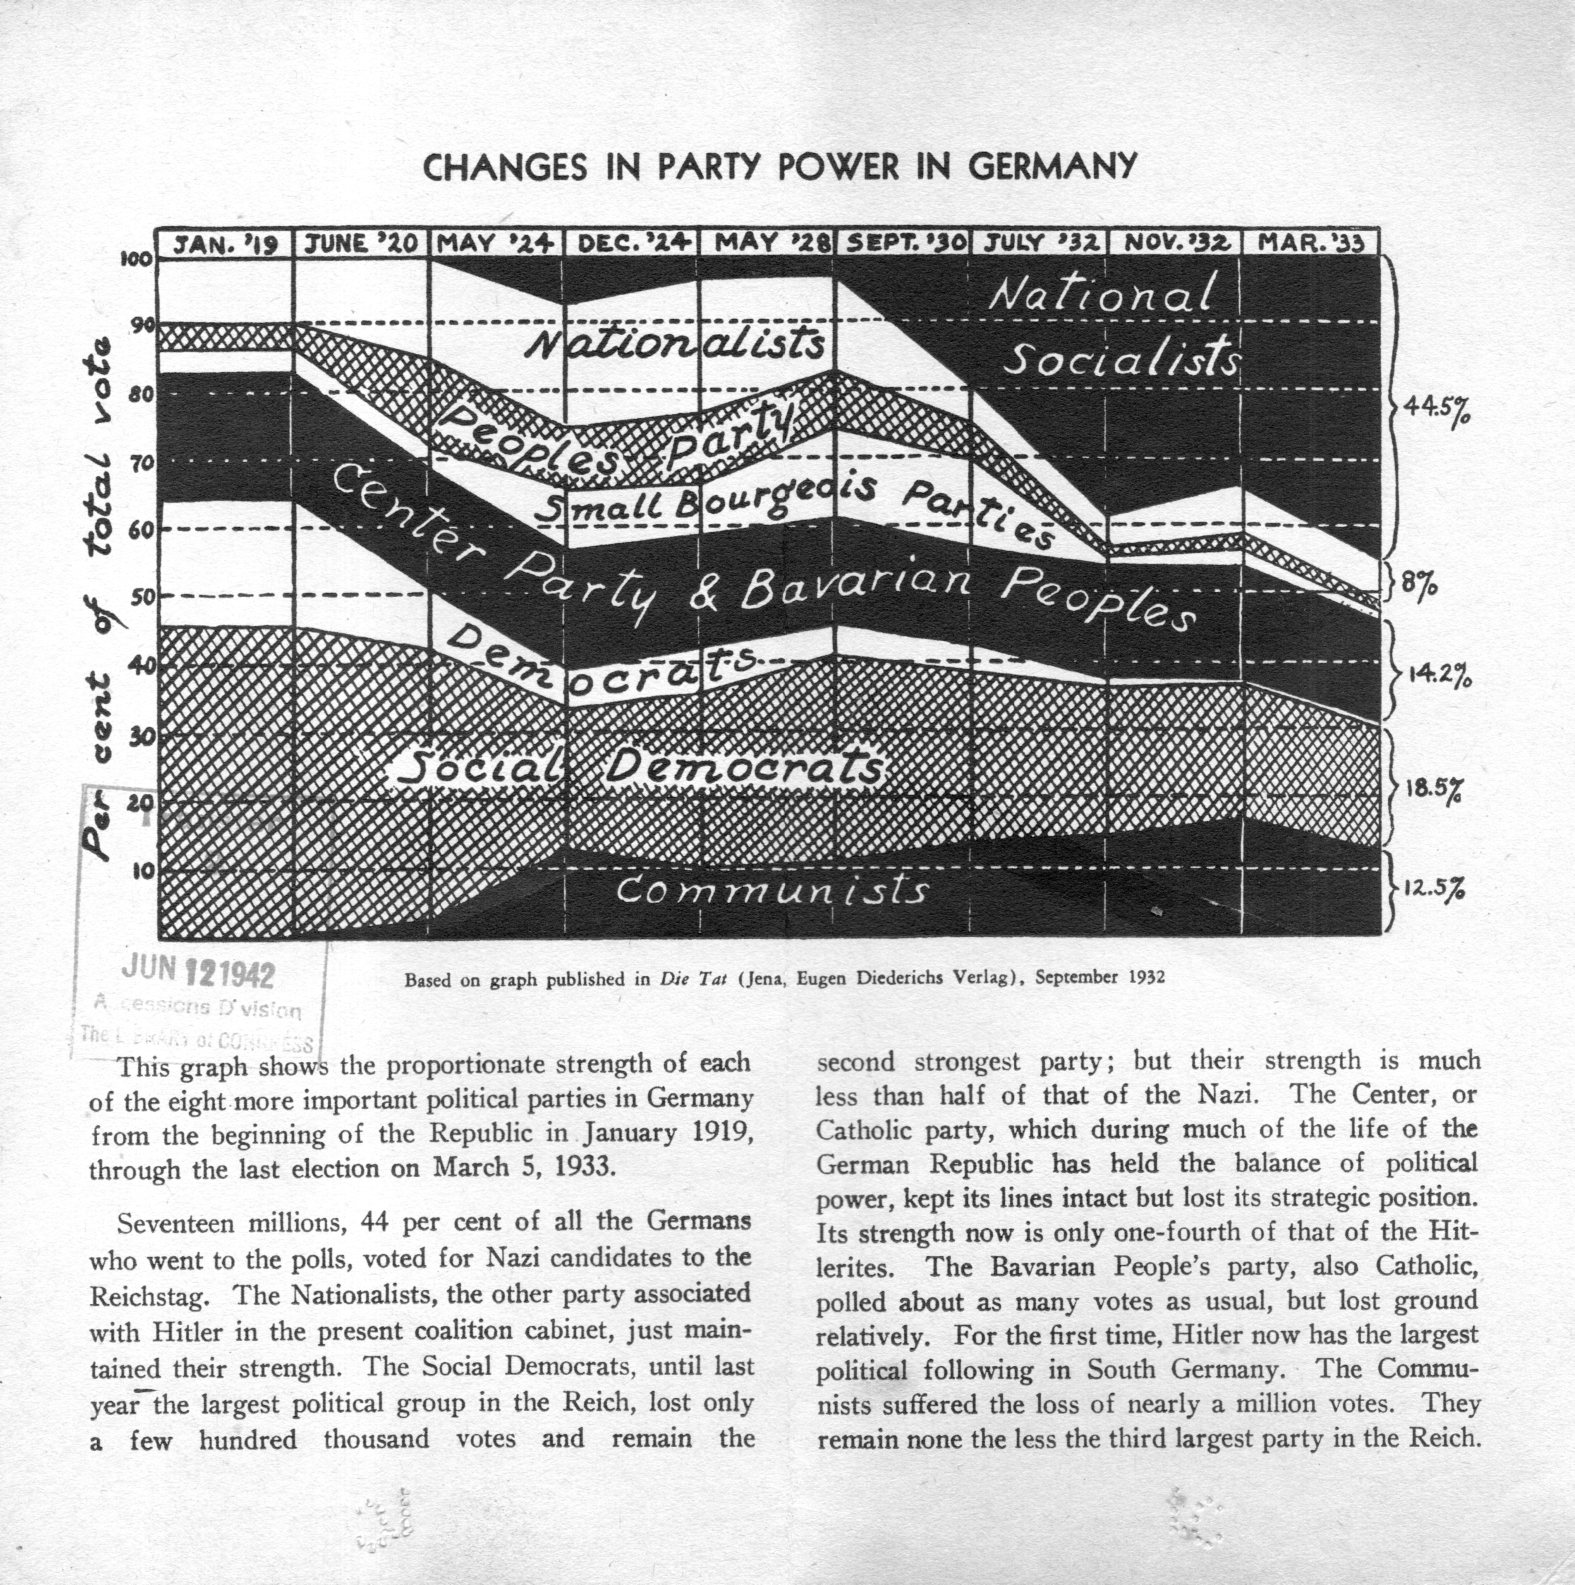
[Source: private, via the Library of Congress from the OSS library.]