JF Ptak Science Books Quick Post
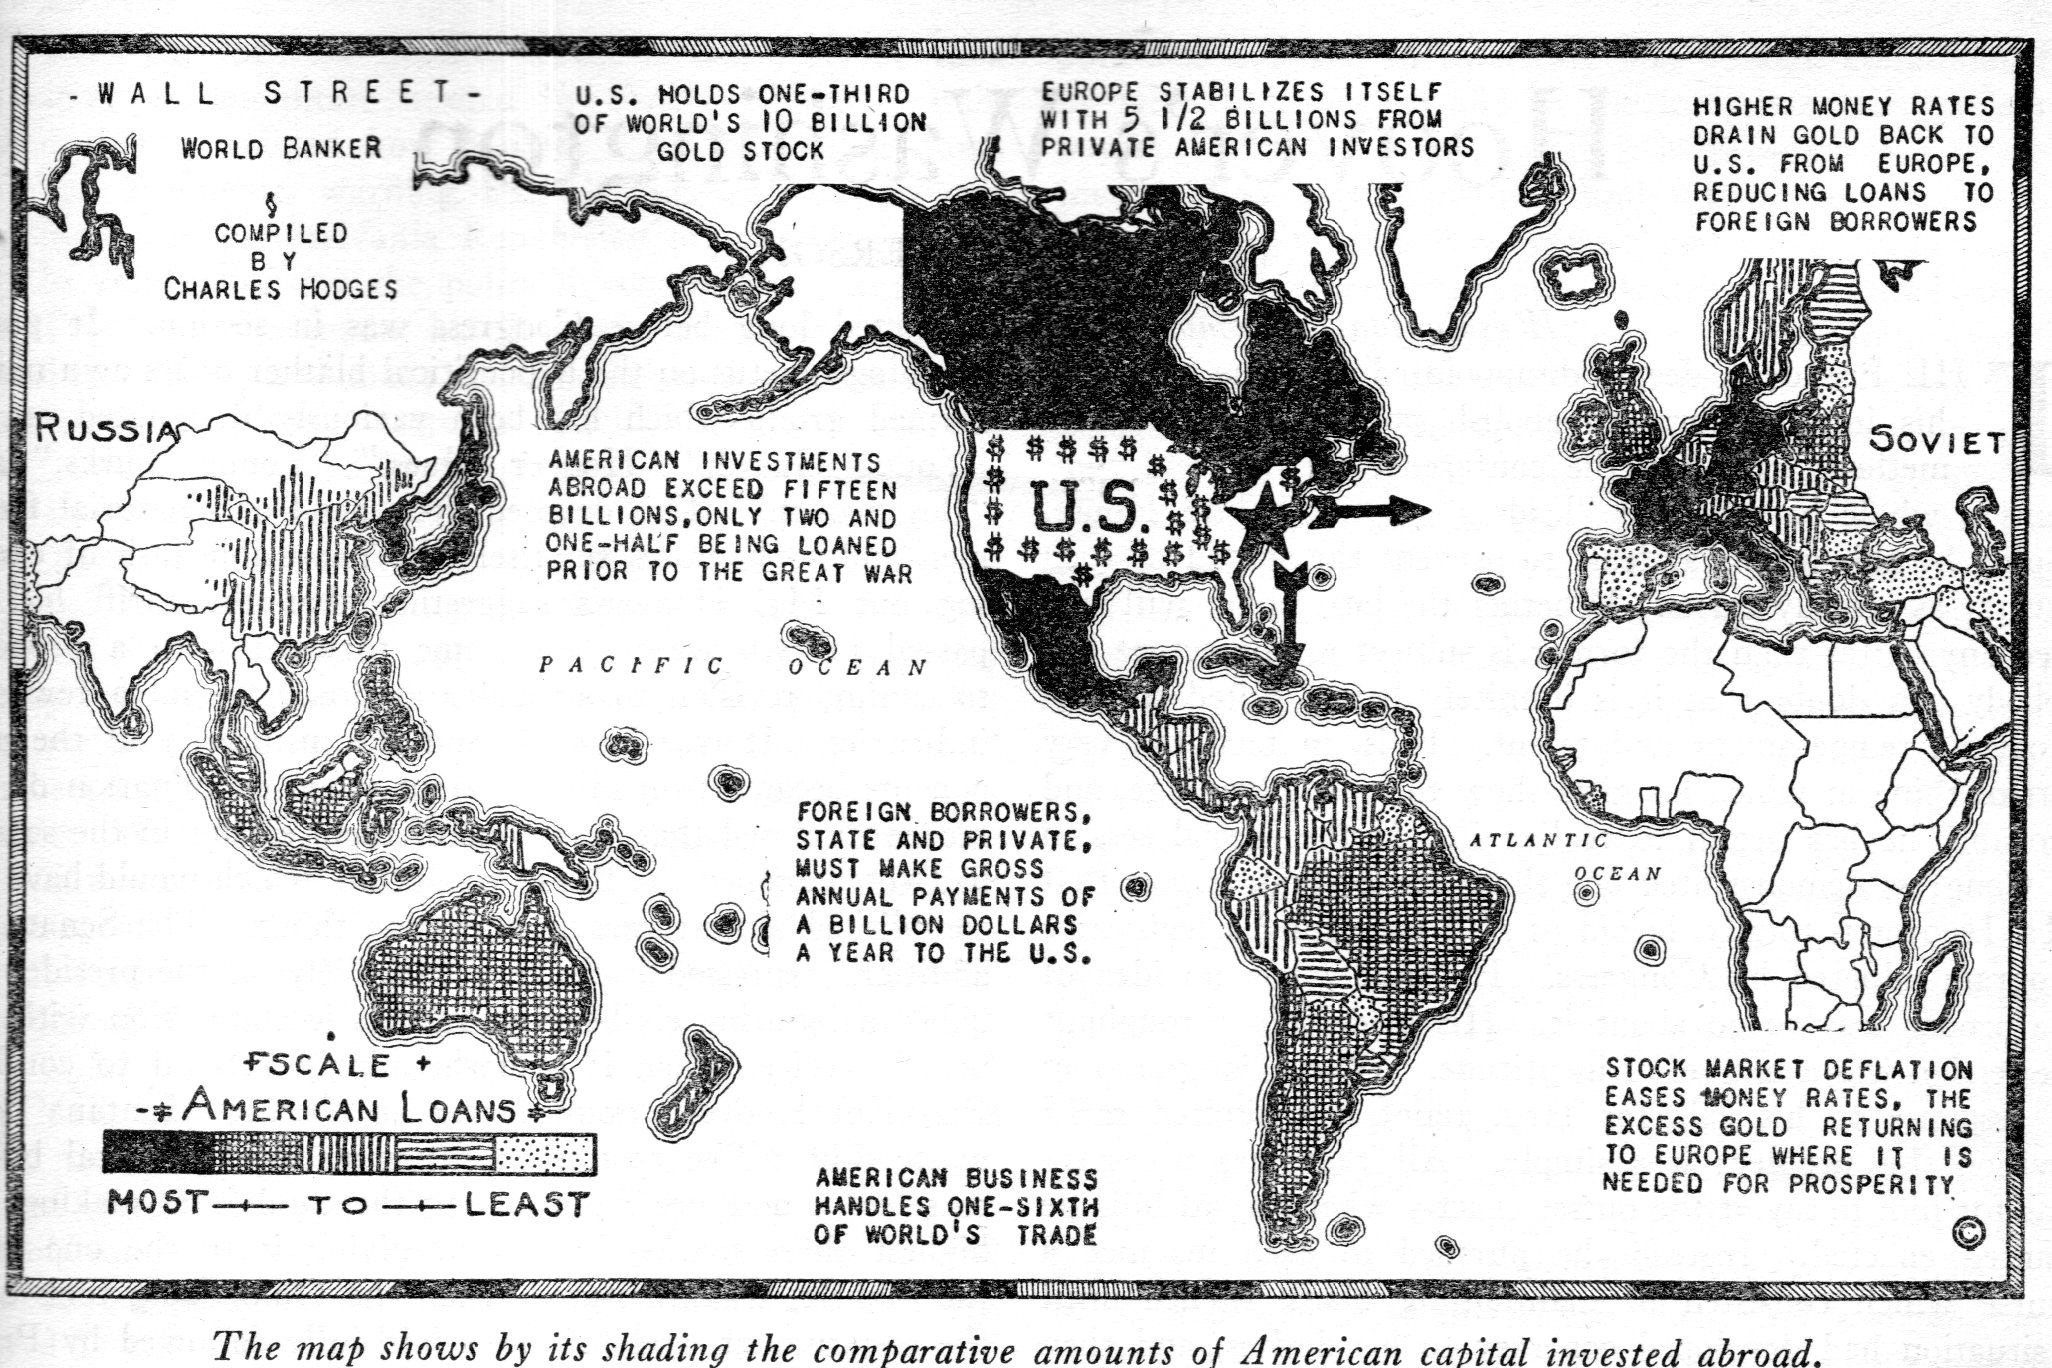
By the time this map of U.S. foreign investments appeared in The Nation on December 4, 1929, the Wall Street Crash was 41 days old. The giant ride to the top had pretty much dissipated by August 1929, and there was the beginning of the decline in September and October. October 24th was the beginning of the Great Crash–the 25th brought a glimmer of hope with buy-backs; but this was followed by Black Monday (the 28th) and then the bottom fell out of the bottom the next day (Black Tuesday, October 29). There were some small fits and starts–at least enough for the columnists at The Nation to declare that the recovery had begum, as seem in a few articles in October–but they were sorely mistaken.
In any event, I haven’t seen this map before, and I thought to share.