JF Ptak Science Books Quick Press
I found this lovely infographic in the August 29, 1914 issue of The Illustrated London News, coming a little more than three weeks after the beginning of WWI. It is one of the earliest issues almost fully dedicated to war coverage, and in its many articles covers the fall of Namur, the fight at Mons, the destruction of the HMS Amphion, and images of long lines of Belgian refugees, the fight at Haelen (and the dog-drawn heavy machine guns), and the first drawing of the BEF in action in France. The image below addresses what was seen early on as the war’s premier issue in military strength, which was seen in the power of navies, and hence the depiction of the relative “strengths” (projectile weight (760-1400 lbs), barrel length, “muzzle energy”, steel penetration) of the big shells:
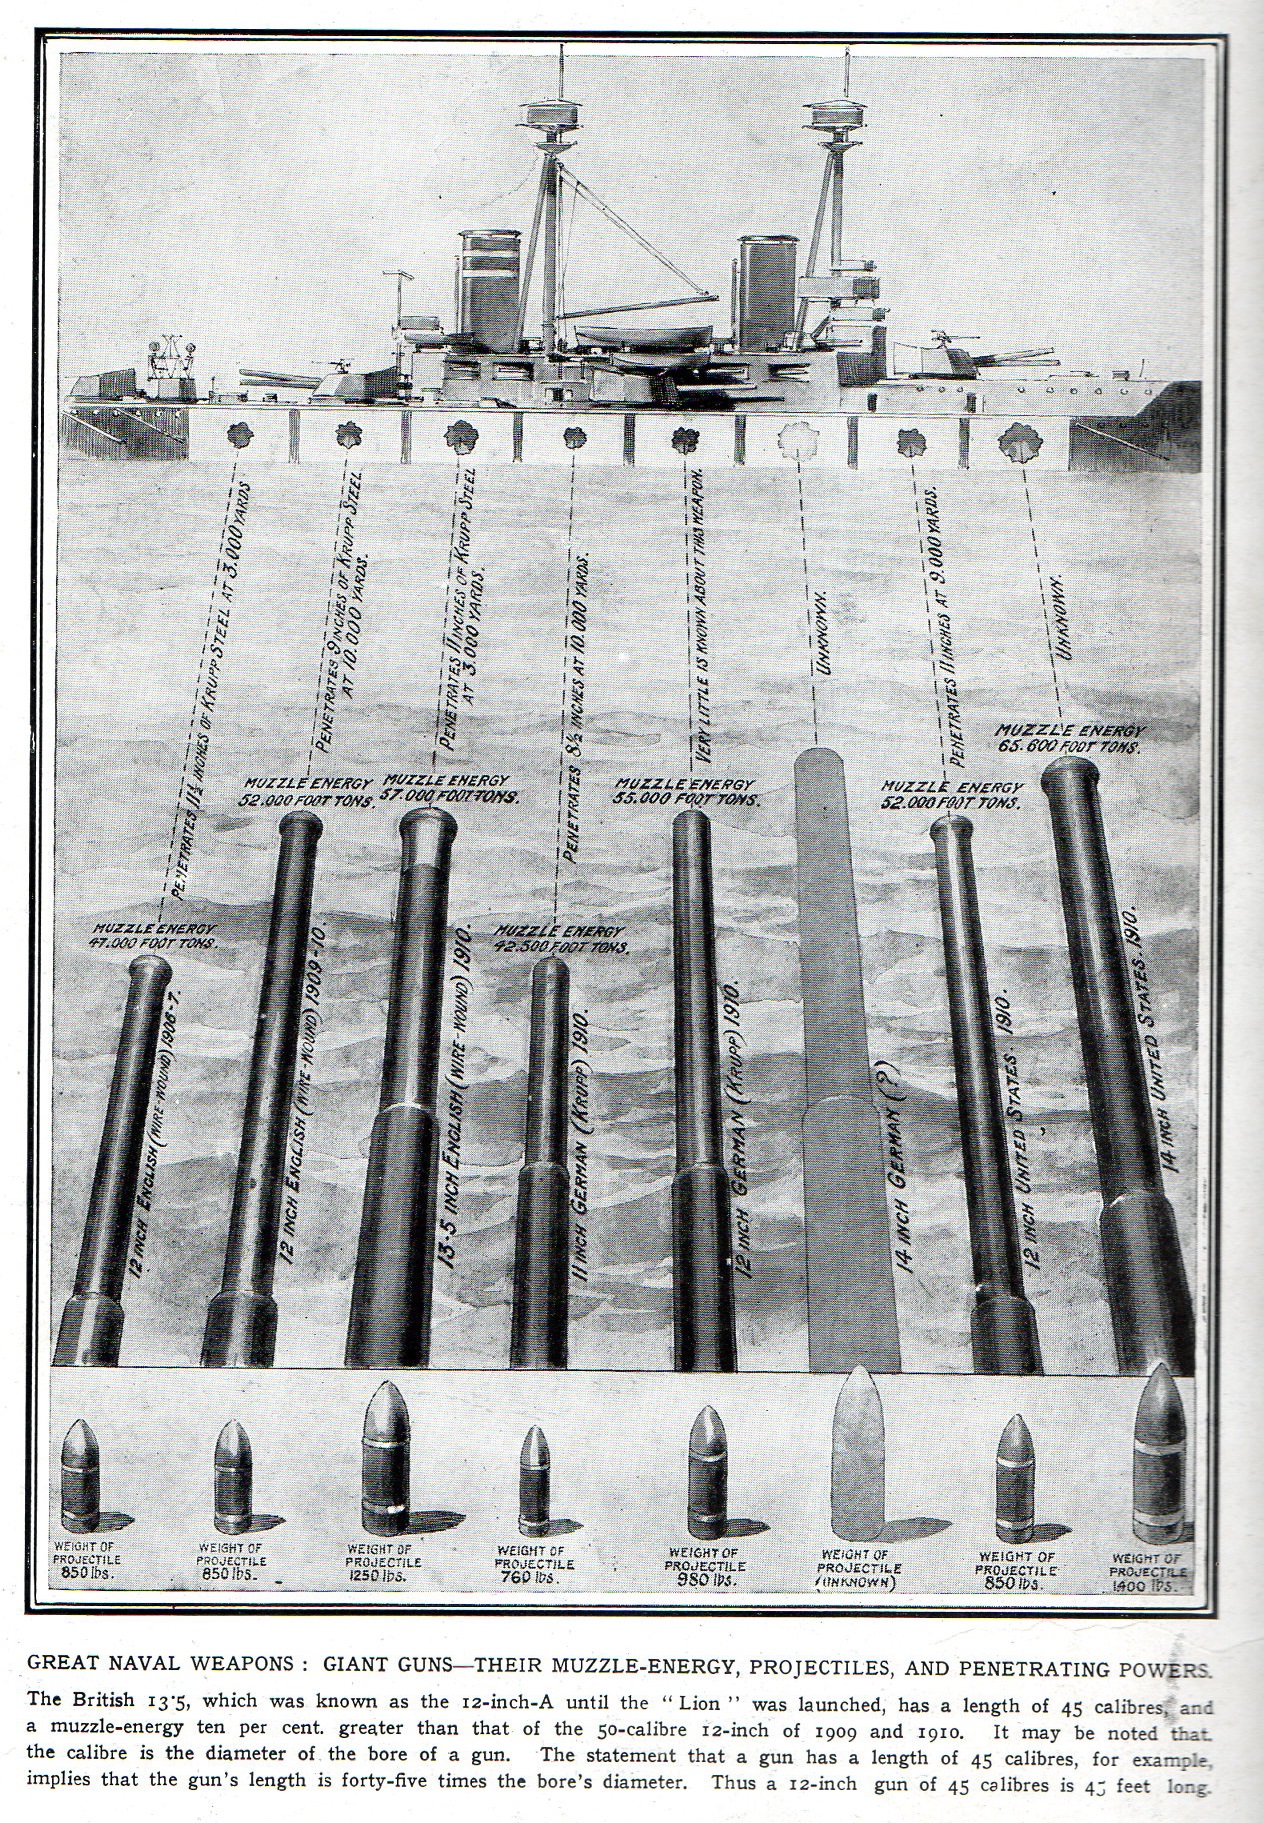
I think I’ve never seen a display quite like this one, before.
And just for the fun of it, “caliber/calibre” from the Oxford English Dictionary: