JF Ptak Science Books Quick Post
Victor Levasseur (1800–1870) was a French cartographer who crippled and broke the modern line about not spending ink on a informational design that did not carry some sort of specific and necessary data. It seems that most of Levasseur’s ink was decorative–but that’s okay, I guess, because the effects today look quite handsome–and also it should be remembered that at the time the man was not exactly awash in detailed data. That said, he produced this beautiful little miniature map showing the comparative heights of mountains, though the detail is more-or-less generally lacking, and frankly I’m comfortable with that.
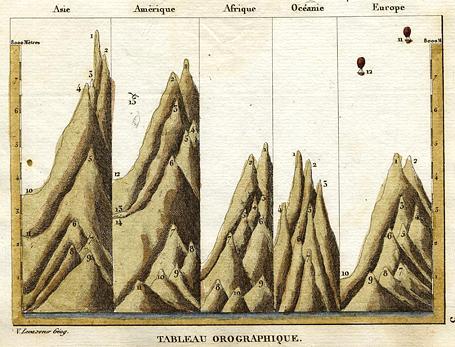
[Source: “Tableau Orographique” a miniature map by Victor Levasseur (1795-1862), published in his Atlas Classique Universel de Geographie …, about 1835]