A Daily History of Holes, Dots, Lines, Science, History, Math, Physics, Art, the Unintentional Absurd, Architecture, Maps, Data Visualization, Blank and Missing Things, and so on. |1.6 million words, 7500 images, 4.9 million hits| Press & appearances in The Times, Le Figaro, Mensa, The Economist, The Guardian, Discovery News, Slate, Le Monde, Sci American Blogs, Le Pont, and many other places… 5000+ total posts since 2008.

Category: Information, Quantitative Display of

  • Window Shopping with Berenice Abbott, 1935

    JF Ptak Science Books LLC  Post 883  Blog Bookstore

    I enjoy antiquarian window shopping, browsing photos or
    engravings that depict goods for sale– especially if the prices are posted. I
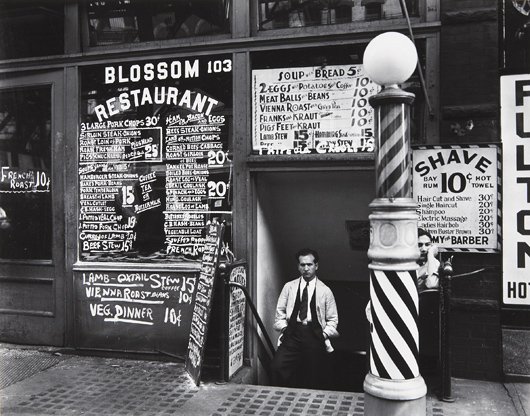
    came back to this deep-in-the-Depression-fantastic photo made in 1935 by Berenice
    Abbott (Springfield, Ohio, 1898-1991). Blossom
    Restaurant, NYC
    was part of Abbott’s effort funded by the WPA, this time as
    a part of her Changing New York Project, and captures the restaurant and
    neighboring barber shop at 103 Bowery. 
    The two businesses actually occupied the first floors and basement
    (respectively) of the Boston Hotel, a standard flop house in a tough and
    distressed part of the city that rented beds by the day, with 249 small
    door-less cubicles offering a decent place to spend the night for 30 cents1. 
    Abbott

    30 cents seems to be the going rate for a bunch of things
    going on in this  picture—30 cents for a
    night in the hotel, 30 cents for the better offers of Morris Gordon’s
    restaurant. 30 cents for a haircut and shave, 30 cents for a “women’s hair
    bob”2 and so on.  Which seems about
    right—a fancy haircut and a decent better-than-average dinner for two will
    probably cost about the same, today. 

    If you were really on a tight budget, 30 cents would buy you
    three vegetarian dinners, or 6 offerings of bread and soup, or three visits to
    the table of meatballs and bans, or pigs feet and kraut. 

    The price of a stick-to-your-ribs meal of sirloin and
    potatoes and a pot of coffee also cost about the same as a gallon and a half of
    gasoline (which cost about 20 cents). 
    The same amount of gas today would get you a serving at McDonalds, or
    something on that order, and perhaps even a happy take-away for the kids.
    Perhaps the two even out. 

    30 cents might get you a loaf of bread, and wouldn’t quite get
    you a dozen eggs.  Now this is
    remarkable, because if you adjust all of this according to modest CPI measures,
    the average cost of a dozen eggs in 1935 was 37 cents, or (according to the US
    Census website generating 1935 to 2009 prices adjusting to CPI) $5.84.  The bread would cost $4.74 in 2009 dollars,
    which means that the staples today—milk, bread, butter, eggs, were more
    expensive in 1935 than today.  Ditto
    gasoline, which cost 19 cents a gallon, or $3 today—actually this would be much
    more expensive in 1935 as the mileage the cars were getting then (and the
    octane) was much lower, so the cost of running an automobile was considerably
    higher.   The cost of the car itself,
    though, still favors the ‘thirties for modest transportation, which came in at
    about 600 dollars, or just over $9000 in 2009 dollars3. 

    The 3-cent first class postage stamp of 1935 was more
    expensive than first class postage in 2009: 
    47 cents versus 44.  When you look
    at the increases and bitty spikes of the cost of a first class stamp over time
    the whole thing looks pretty flat. 

    The average salary for a family of four in 1935 was about
    1500/year, which oddly enough is about the same for the poverty guideline level
    for 2009 established by the Department
    of Health and Human Services (about $23,000). 
    Minimum wage legislation didn’t begin until 1938, but if you take a look
    at one of my earlier posts here on the history of this idea 
    you’ll see that the recent history of legislating  a meaningful level of acceptance for a base
    living wage is mainly disgraceful, with relatively little accomplished (in
    adjusted economic terms) for half a century. 
    (The new minimum wage brings us to about a mid-way point as the highest
    minimum wages paid in the 71-year history of the program.)

    And so I thank Ms
    Abbott again for her beautiful social commentary, and a happy 75th birthday
    to this photograph. 

    Notes

    1.A fantastic website and resource for changing aspects of
    NYC can be found here, at Frank Levere’s Changing New York site. http://www.newyorkchanging.com/

    2. I wrote a little bit about the appearance of women-only
    hair salons in my post “The Staggering Beauty of Barber Shops” https://historyofideasblog.com/thesciencebookstore/2009/02/the-staggering-beauty-of-barber-shops-naive-surreal-department-22.html


    3. Other bits of what stuff
    cost in 1935:

    Flour (5 lbs)     25.3 cents

    Bread (lb)         8.3

    Round steak (lb)  36.0

    Bacon (lb)        41.3

    Butter (lb)       36.0

    Eggs (doz.) 37.6

    Milk (1/2 gal.)   23.4

    Oranges (doz.)    22.0

    Potatoes (10 lbs) 19.1

    Coffee (lb)       25.7

    Sugar (5 lbs)     28.2

    Car: $580

    Gasoline: 19 cents/gal

    House: $6,300

    Bread: 8 cents/loaf

    Milk: 47 cents/gal

    Postage Stamp: 3 cents

  • Mapping the Invasion of America, 1942

    JF Ptak Science Books LLC  Post 873           Blog Bookstore

    [See also Part II of this post, here; and consider a  related post on the Nazi sub-orbital Amerika Bomber]


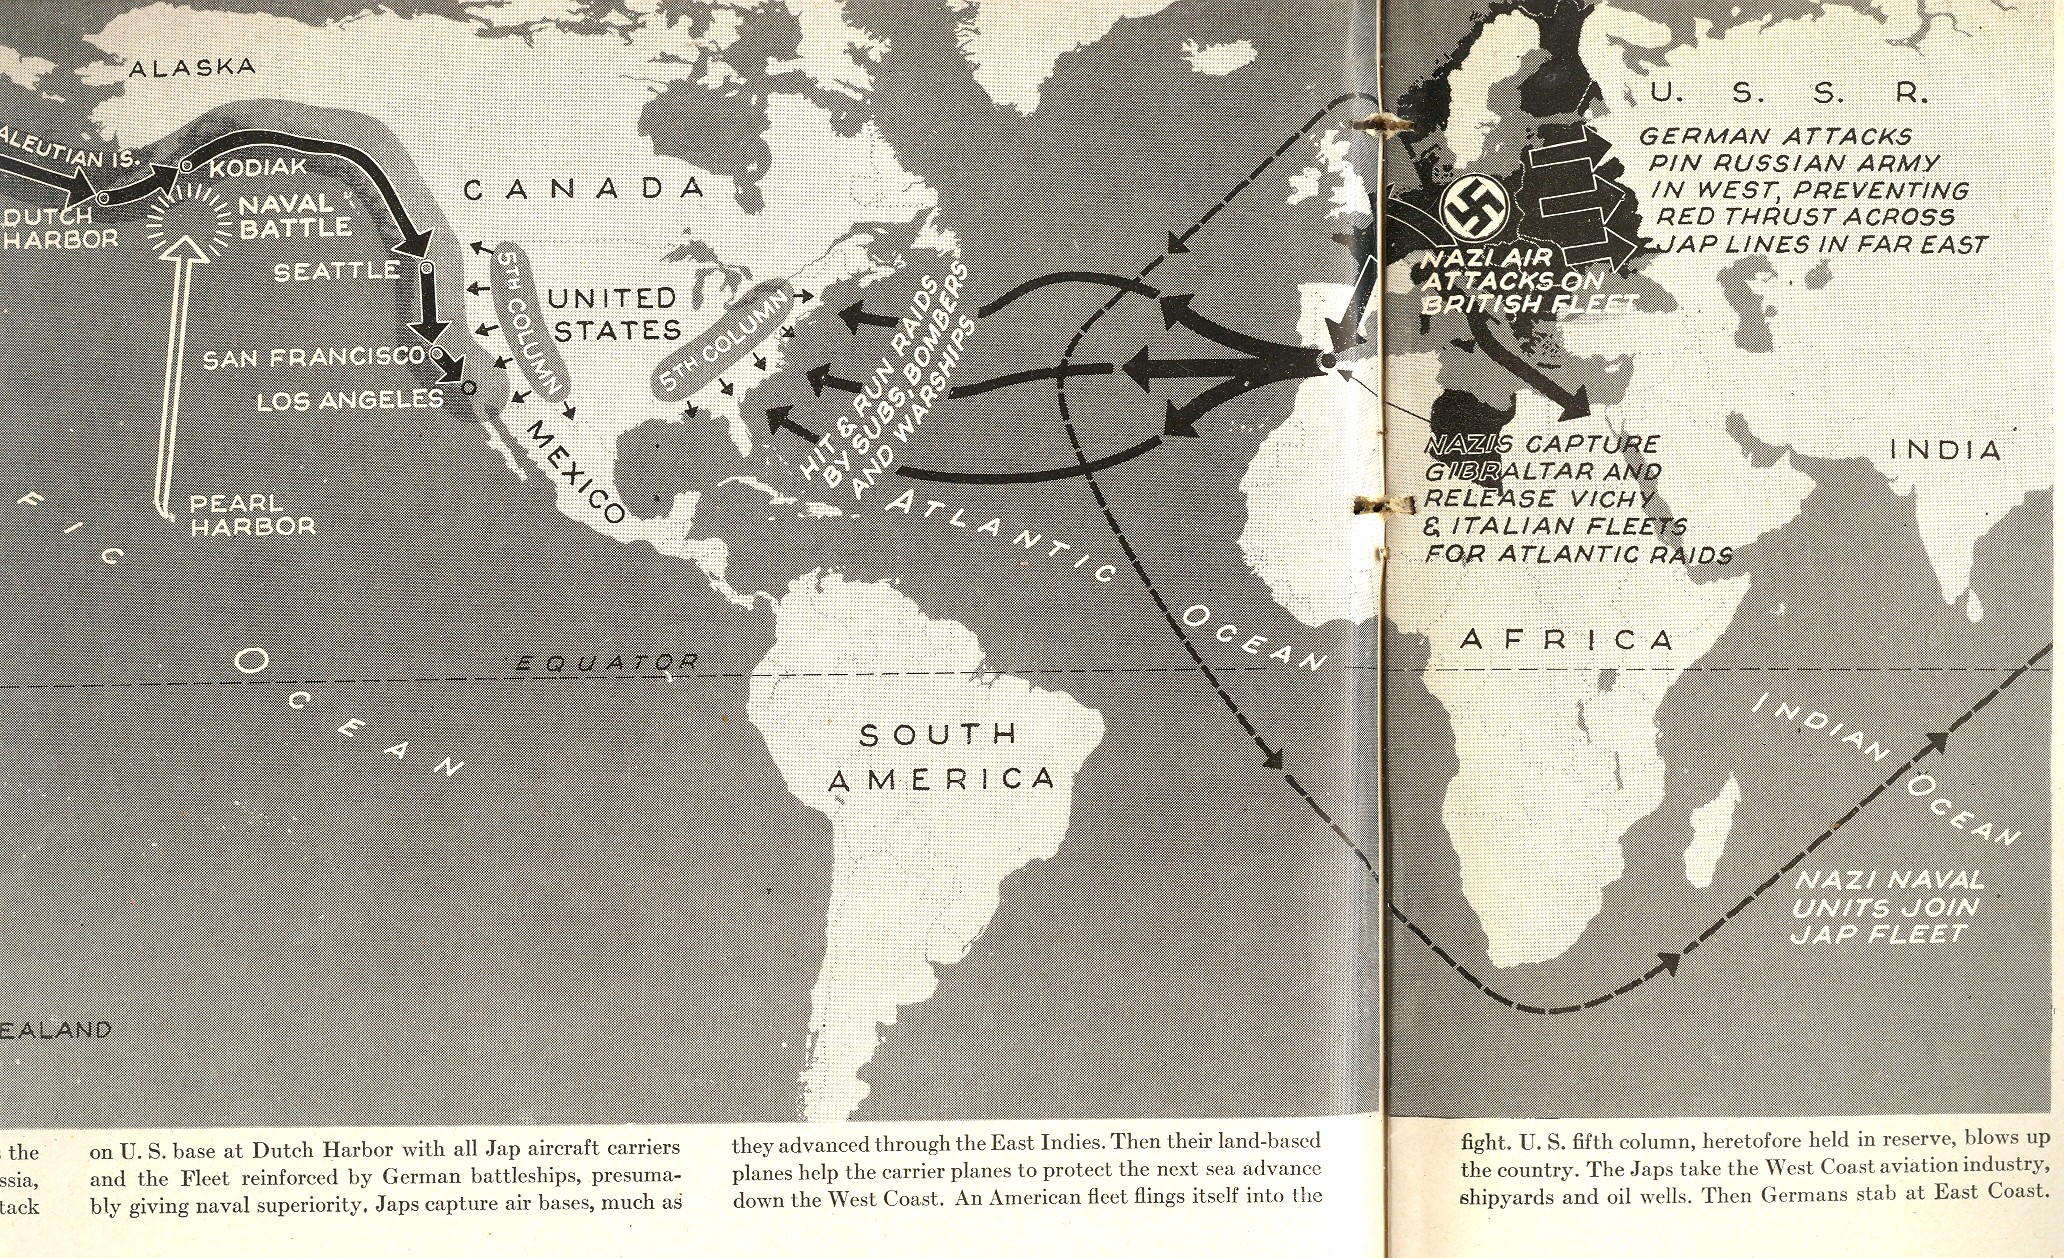
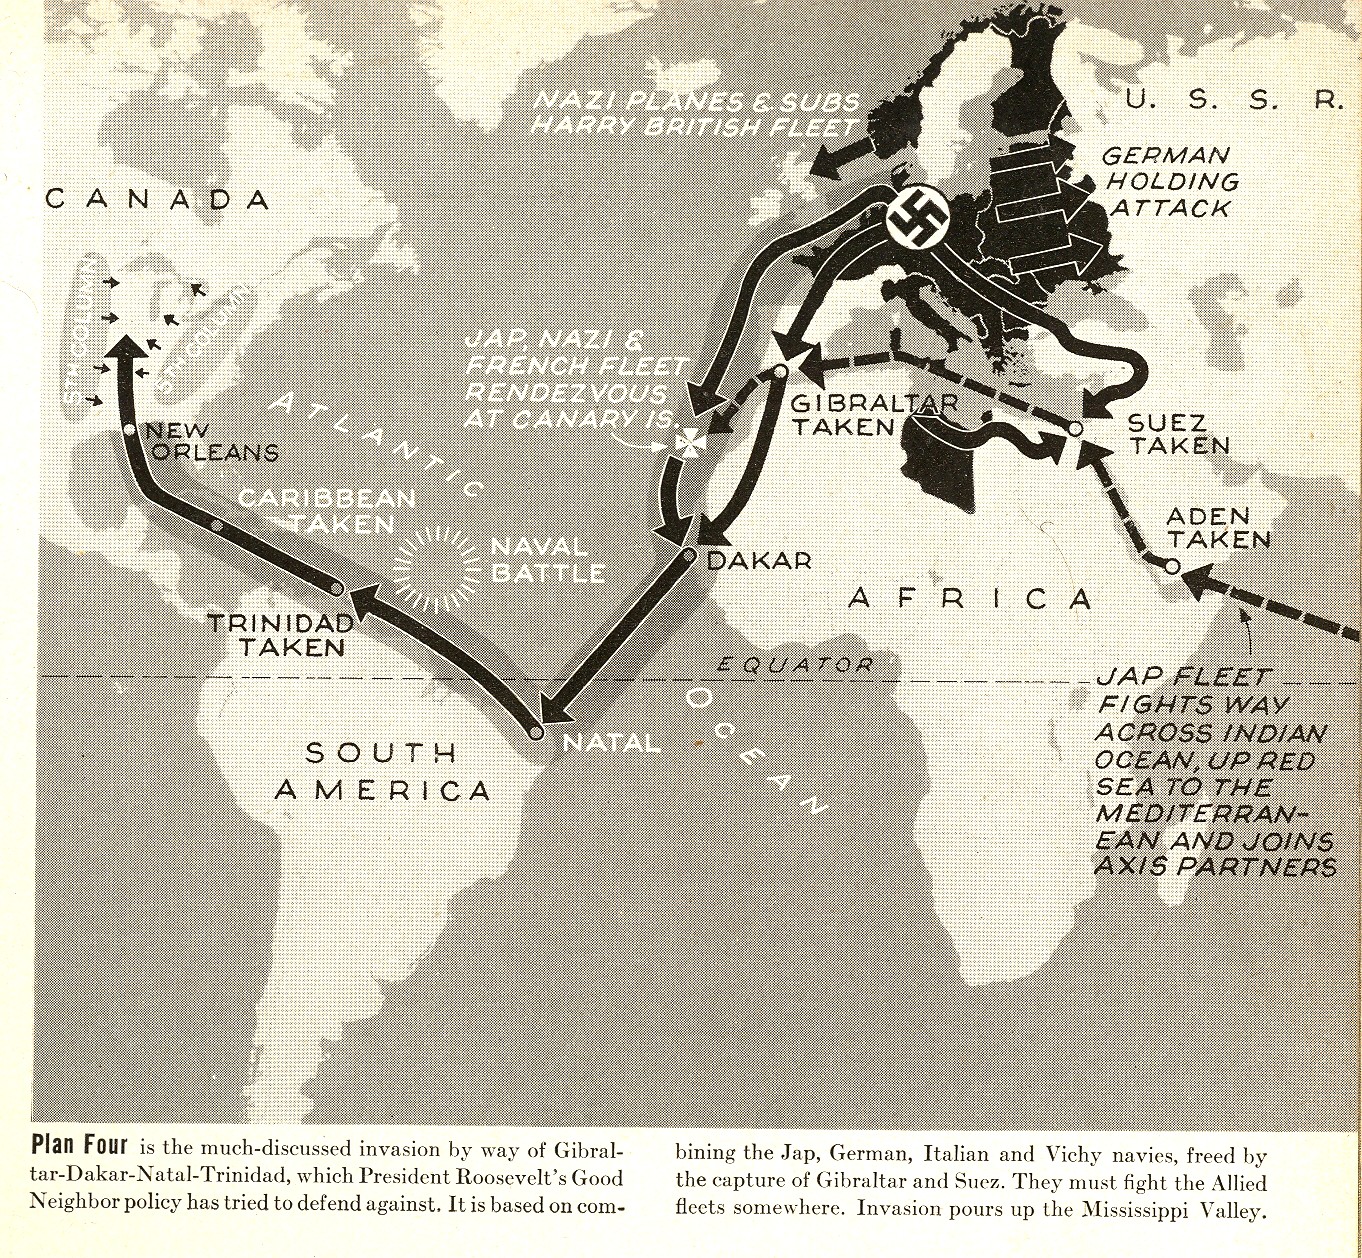
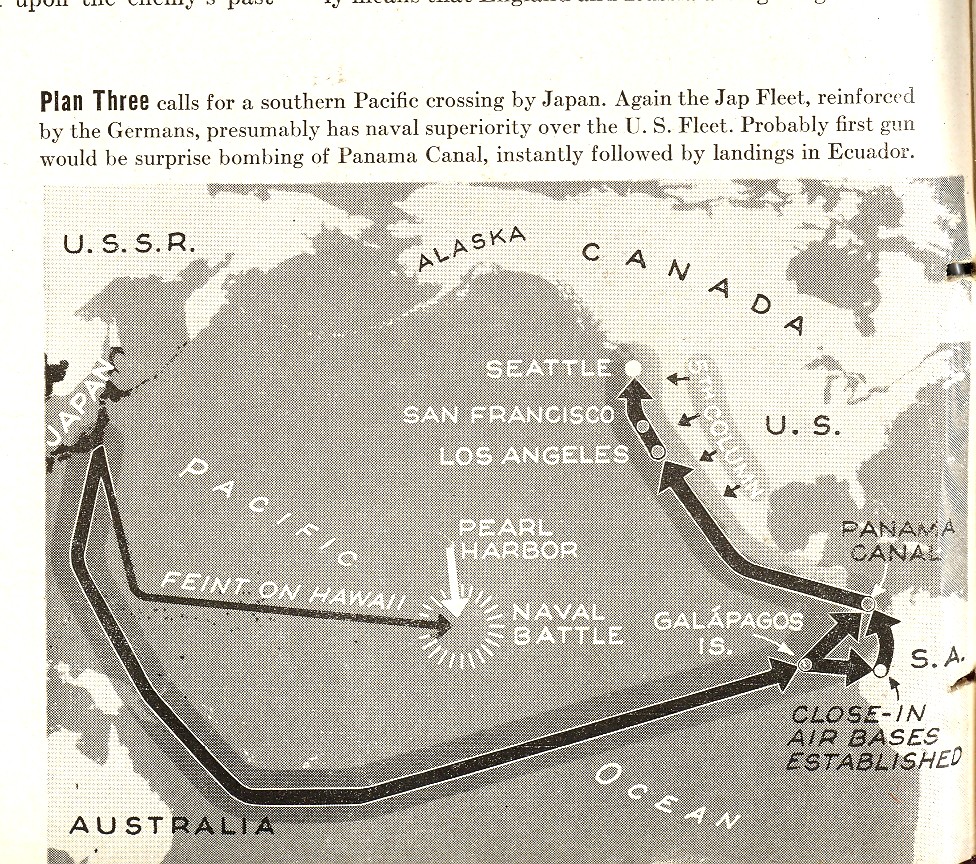
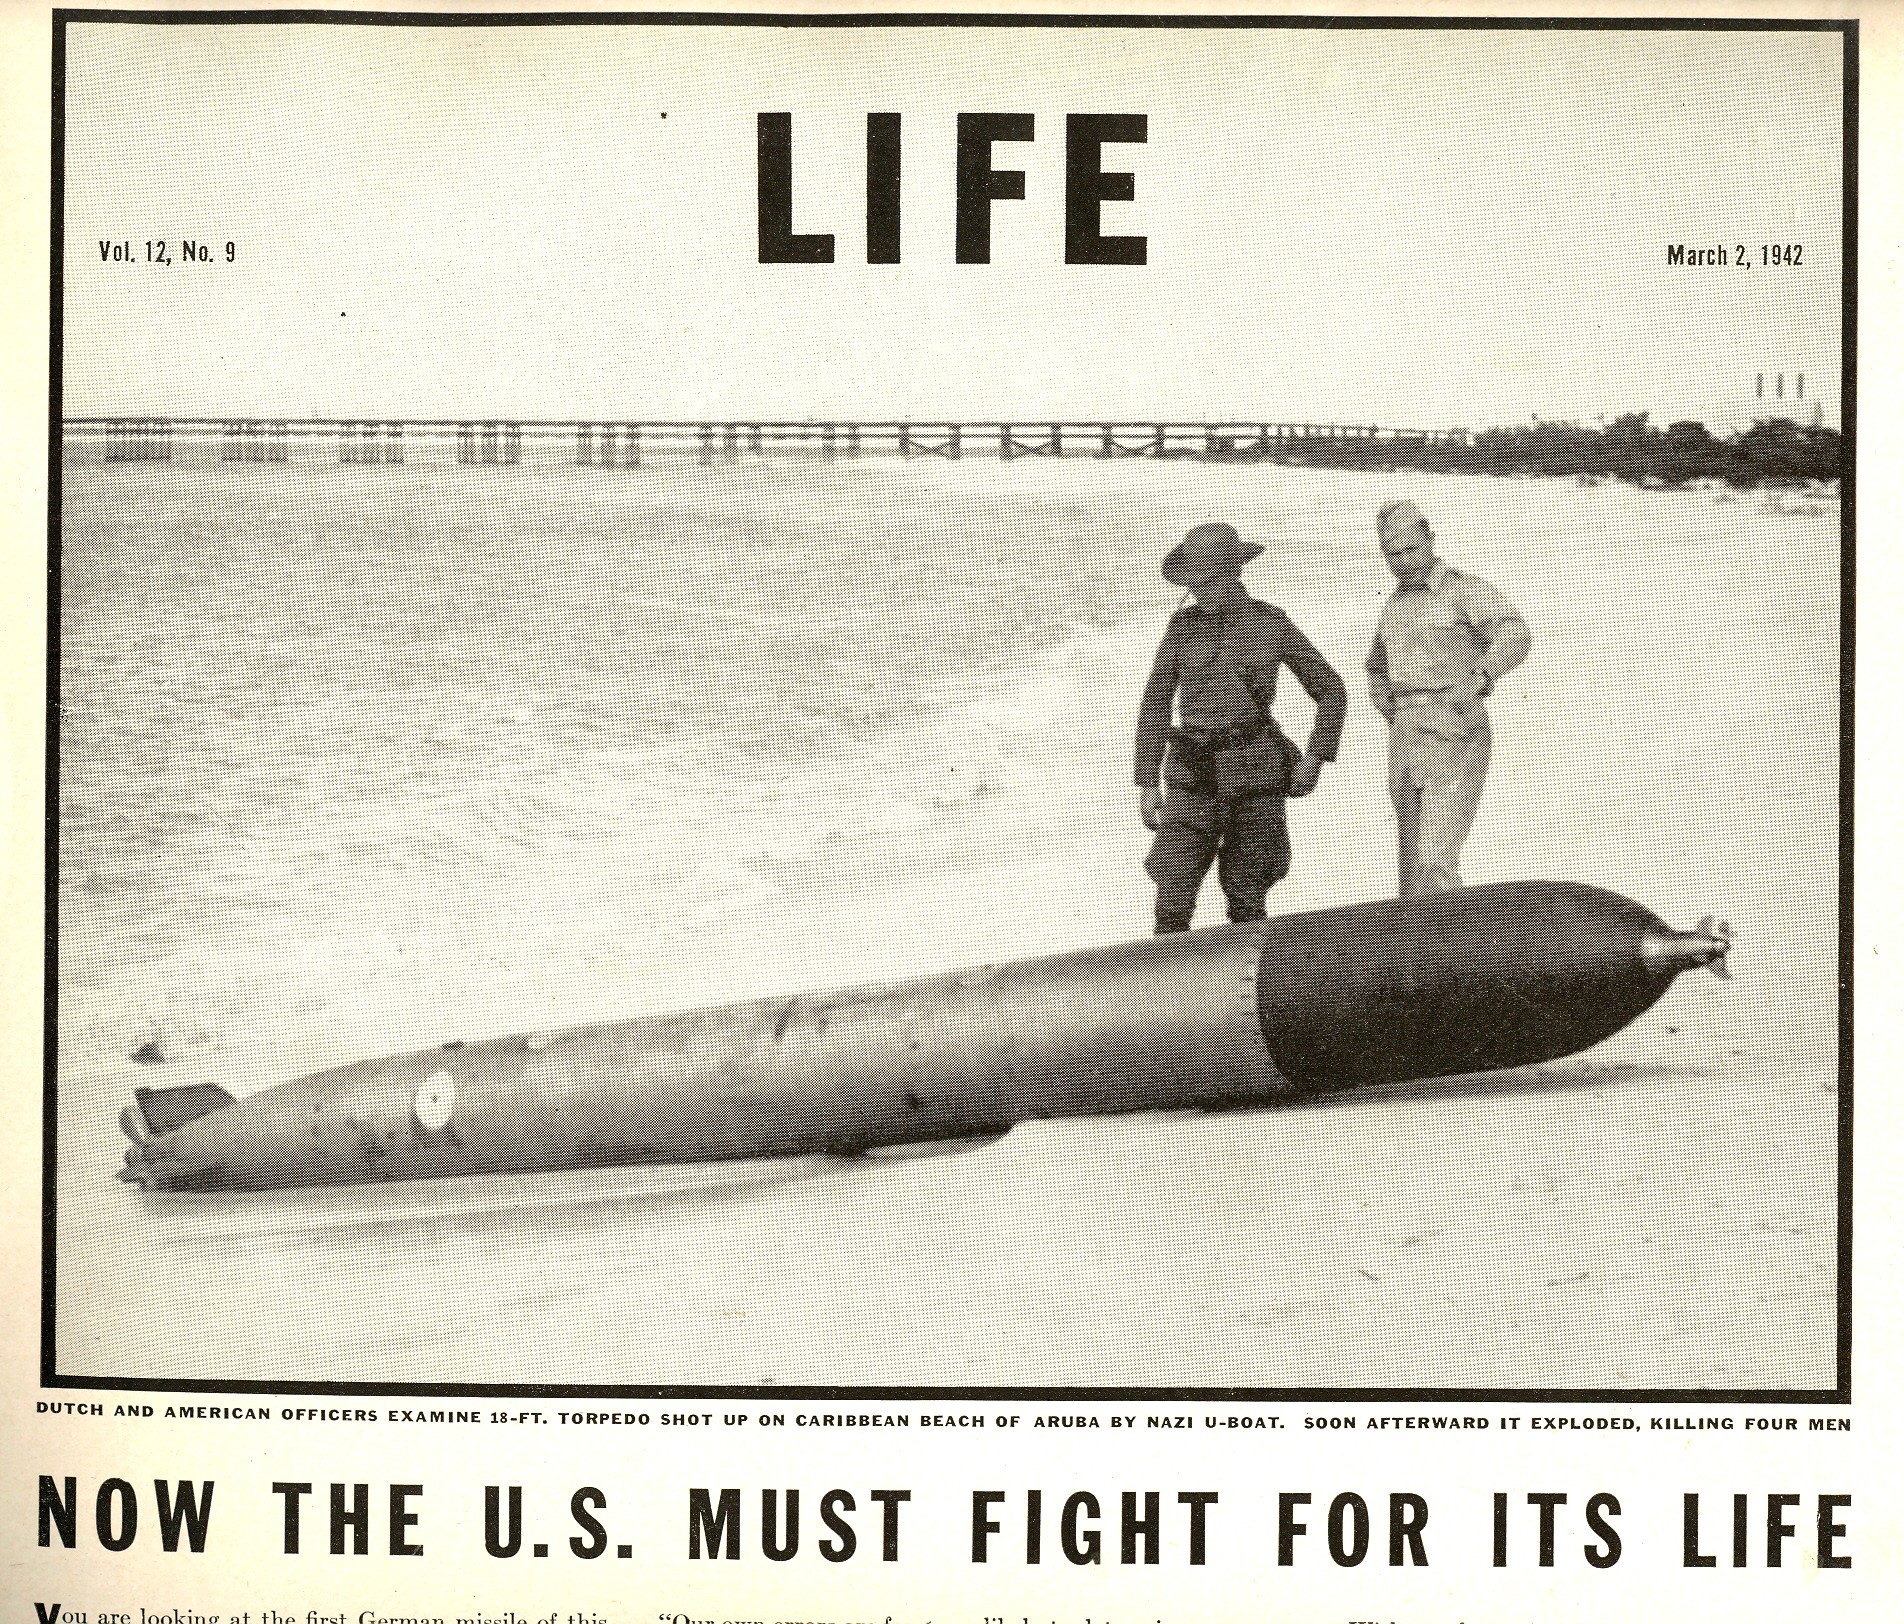
    Blog Dec 12 USA attacked map overview LIFE Magazine issued a wake-up call of sorts to its readership in their 2 March 1942 issue.  I say “of sorts” because even though this hard article (entitled “Now the U.S. Must Fight for Its Life”) must have sorely sobered some of its readers, it started on page 15, following big ads for Listerine, Matrix (women’s shoes, Bell Telephone, Modess, Clapp’s Baby Food, Dot Snap Fasteners, Goodrich Tires, White Horse Scotch, Pompeian Massage  (for shaving), Jack Benny/Carole Lombard’s “To Be or Not To Be”, Colgate, Yardley powder and  Mimeograph, and a few interspersed puff pieces—and a Ginger Rogers cover photo.  But once LIFE paid its bills1, the article got right to business, responding to a February article by sci-fi/novelist Philip Wylie2 on the possibilities of the U.S. losing the war.    

     Blog 12 10 USA map attack 1

    Losing looked like something that could actually happen in pre- war-ready America3.  The war in Europe had been on in earnest since the very end of 1939 (since 1933 in Asia), and the Axis had reached just about the fullest extent of their victories (though there would be more gains in the Pacific to come).  By March of ‘42, we had Bataan, MacArthur leaving the Philippines and the fall of rape of Manila, the siege of Leningrad, Corregidor, Java Sea, the Brits leaving Singapore, Malaya, and so much more.  The Axis powers in Europe were now in control of Austria, Czechoslovakia. Poland, Denmark, Belgium, the Netherlands, Luxembourg, France, Norway, Yugoslavia, Finland, Greece, Lithuania, Latvia, Estonia, and parts of the Soviet Union (Ukraine, Bylorussia, Crimea), and parts of North Africa;  plus the allies of Hungary, Romania, Bulgaria, and Slovakia. There was also Italy, of course, controlling Sicily, Ethiopia and Libya., and of course the Japanese controlled large swaths of China, South East Asia, Indonesia and points in-between.  The overall situation did not look very good. 

    Blog Dec 12 USA attacked map 2
     The following maps appeared in a two-page spread, detailing ways in which the Axis powers could combine their efforts, focus on America, and take over the country.  Maps such as these with arrows being drawn towards America were absolutely uncommon during this time. 

    Blog Dec 12 USA attacked map 3 001

    Notes

    1.This is almost universal SOP for war reporting for almost all media, and which continues today.  The Illustrated London News delivered reports of success and disaster sandwiched between ads for socks and trifles, as did the Illustriete Zeitung (Leipzig and Berlin), the New York Times, and so on.  I remember very clearly as a kid hearing the reading of the daily list of American soldiers killed in Vietnam  on one of the Big-Three networks, somber and intoned, followed instantly by a ad for Coke or Mister Kleen. 

    2 Wylie (1902-1971) was an interesting guy with a wide reach.  In addition to Hollywood-feeding work, interesting fiction, insightful scifi and social commentary, Wylie also provided the inspiration for the creation of Superman (“The Gladiator”, 1930) and Flash Gordon (When Worlds Collide, 1933).

    3.  Once the war machine in the U.S. got into hyper drive I think that it was impossible for this country to be defeated given its population, workforce, industrial capacity, raw materials, and of course scientific superstrucutre.  Also there was also no other country in the world with the necessary (and enormous) components needed to construct an atomic bomb.  This is a simplified statement that seems pretty homespuna dn jingoistic, but the fact of the matter is that the U.S. was the seat of overwhelming  possibilities and capacities. And yes the Nazis had been slowed down mightily with the expense of dozens of millions of Russian lives and the entire British war machine and on and on—I’m just saying that in the end, the U.S. could not have been beaten.  

    MORE maps in the extended section, below:


  • Representation of Quantitative Data: Tree Diagrams

    JF Ptak Science Books LLC  Post 563

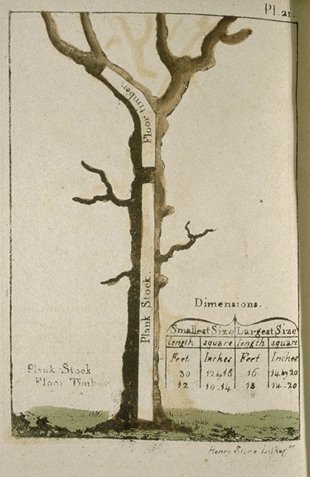
    Tree--timber guillet I’m fond of images of trees, but
    mostly if they are forensic or employed to display relationships between ideas
    or data.  One of my favorites for the
    former is this great image from Peter Guillet’s 
    Timber Merchant’s Guide. Also, a Table, Whereby, at One View, May Be
    Seen the Solid and Superficial Measure of Any Square or Unequal Hewed Logs or
    Plank…1
    (printed
    in Baltimore by
    J. Longrove in 1823).  Guillet was basically
    a tree dissector, a harvester of wood for the construction of naval ships.  His book shows how to make the best—the most
    efficient—use of various varieties of trees, displaying how to employ different
    sections of trees for different parts of a ship. The book must’ve been an
    indispensable handbook down at the mill.  
    At the every least, it certainly introduced a novel way of looking at
    trees.  

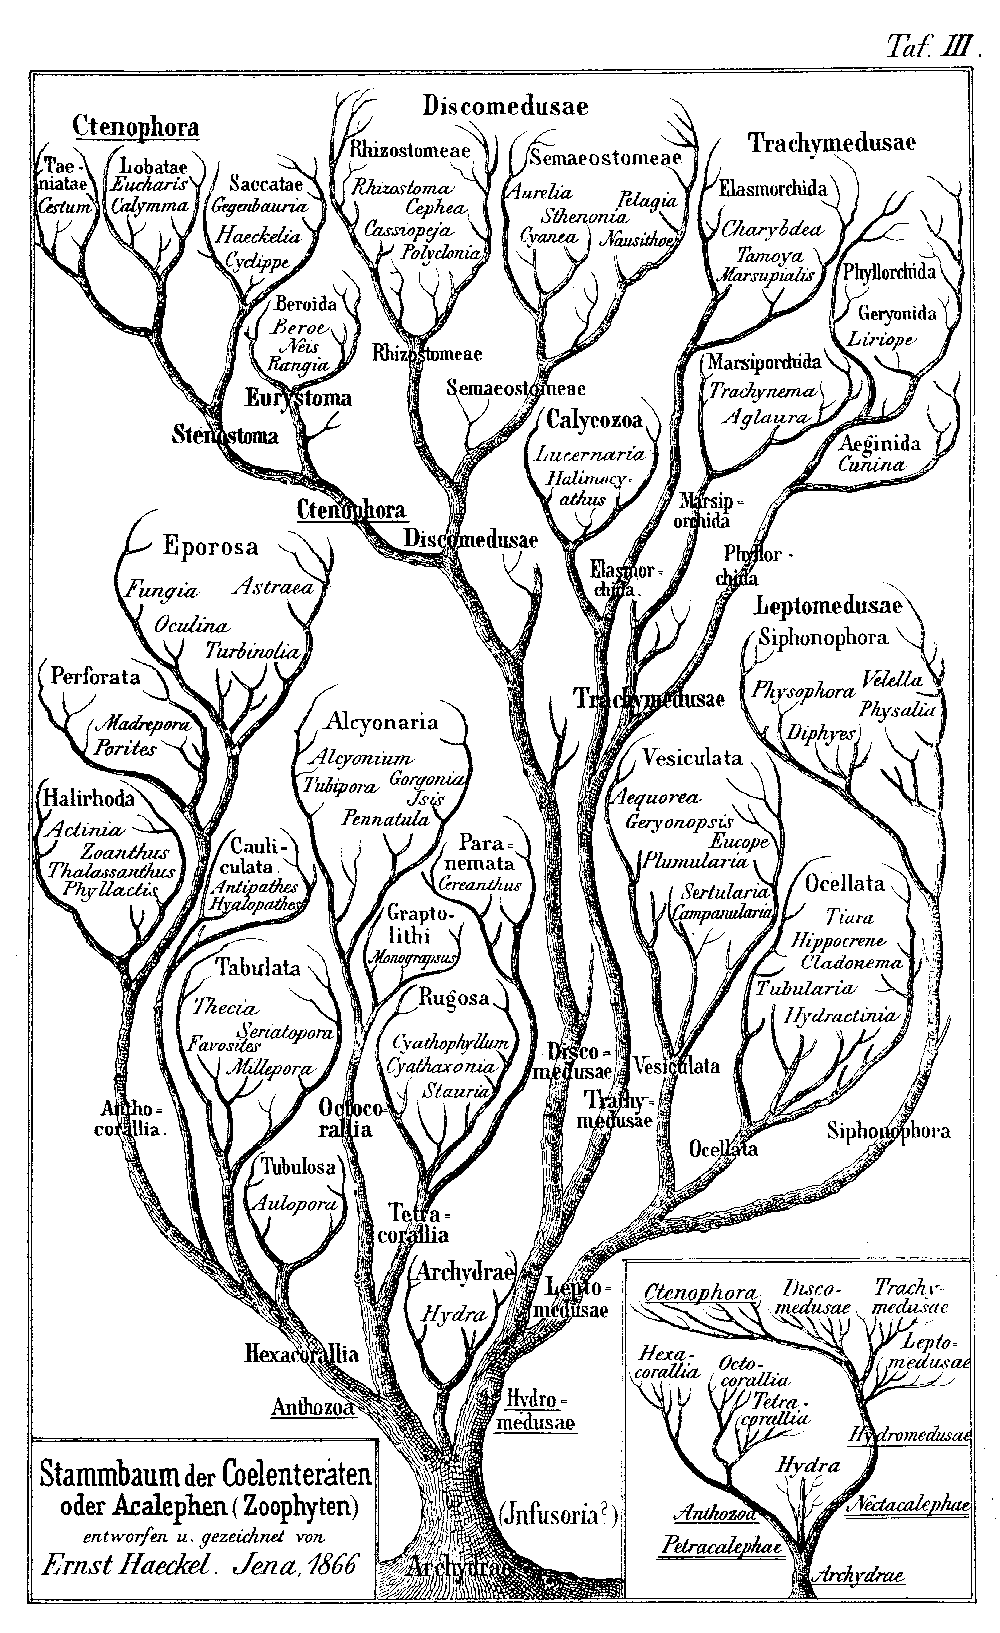
    Tree-haeckel  

    This tree2 was a figure drawn by biologist and eminent
    Darwinian Ernst Haeckel3 (1834-1919), the branch spaces relating to intervals
    which were unrepresented in the fossil record. The image was perhaps the most
    popularly successful part of his two-volume double-wristbender—it was a
    difficult book, not well written or presented, with Charles Darwin himself finding
    it “impossible to read”.

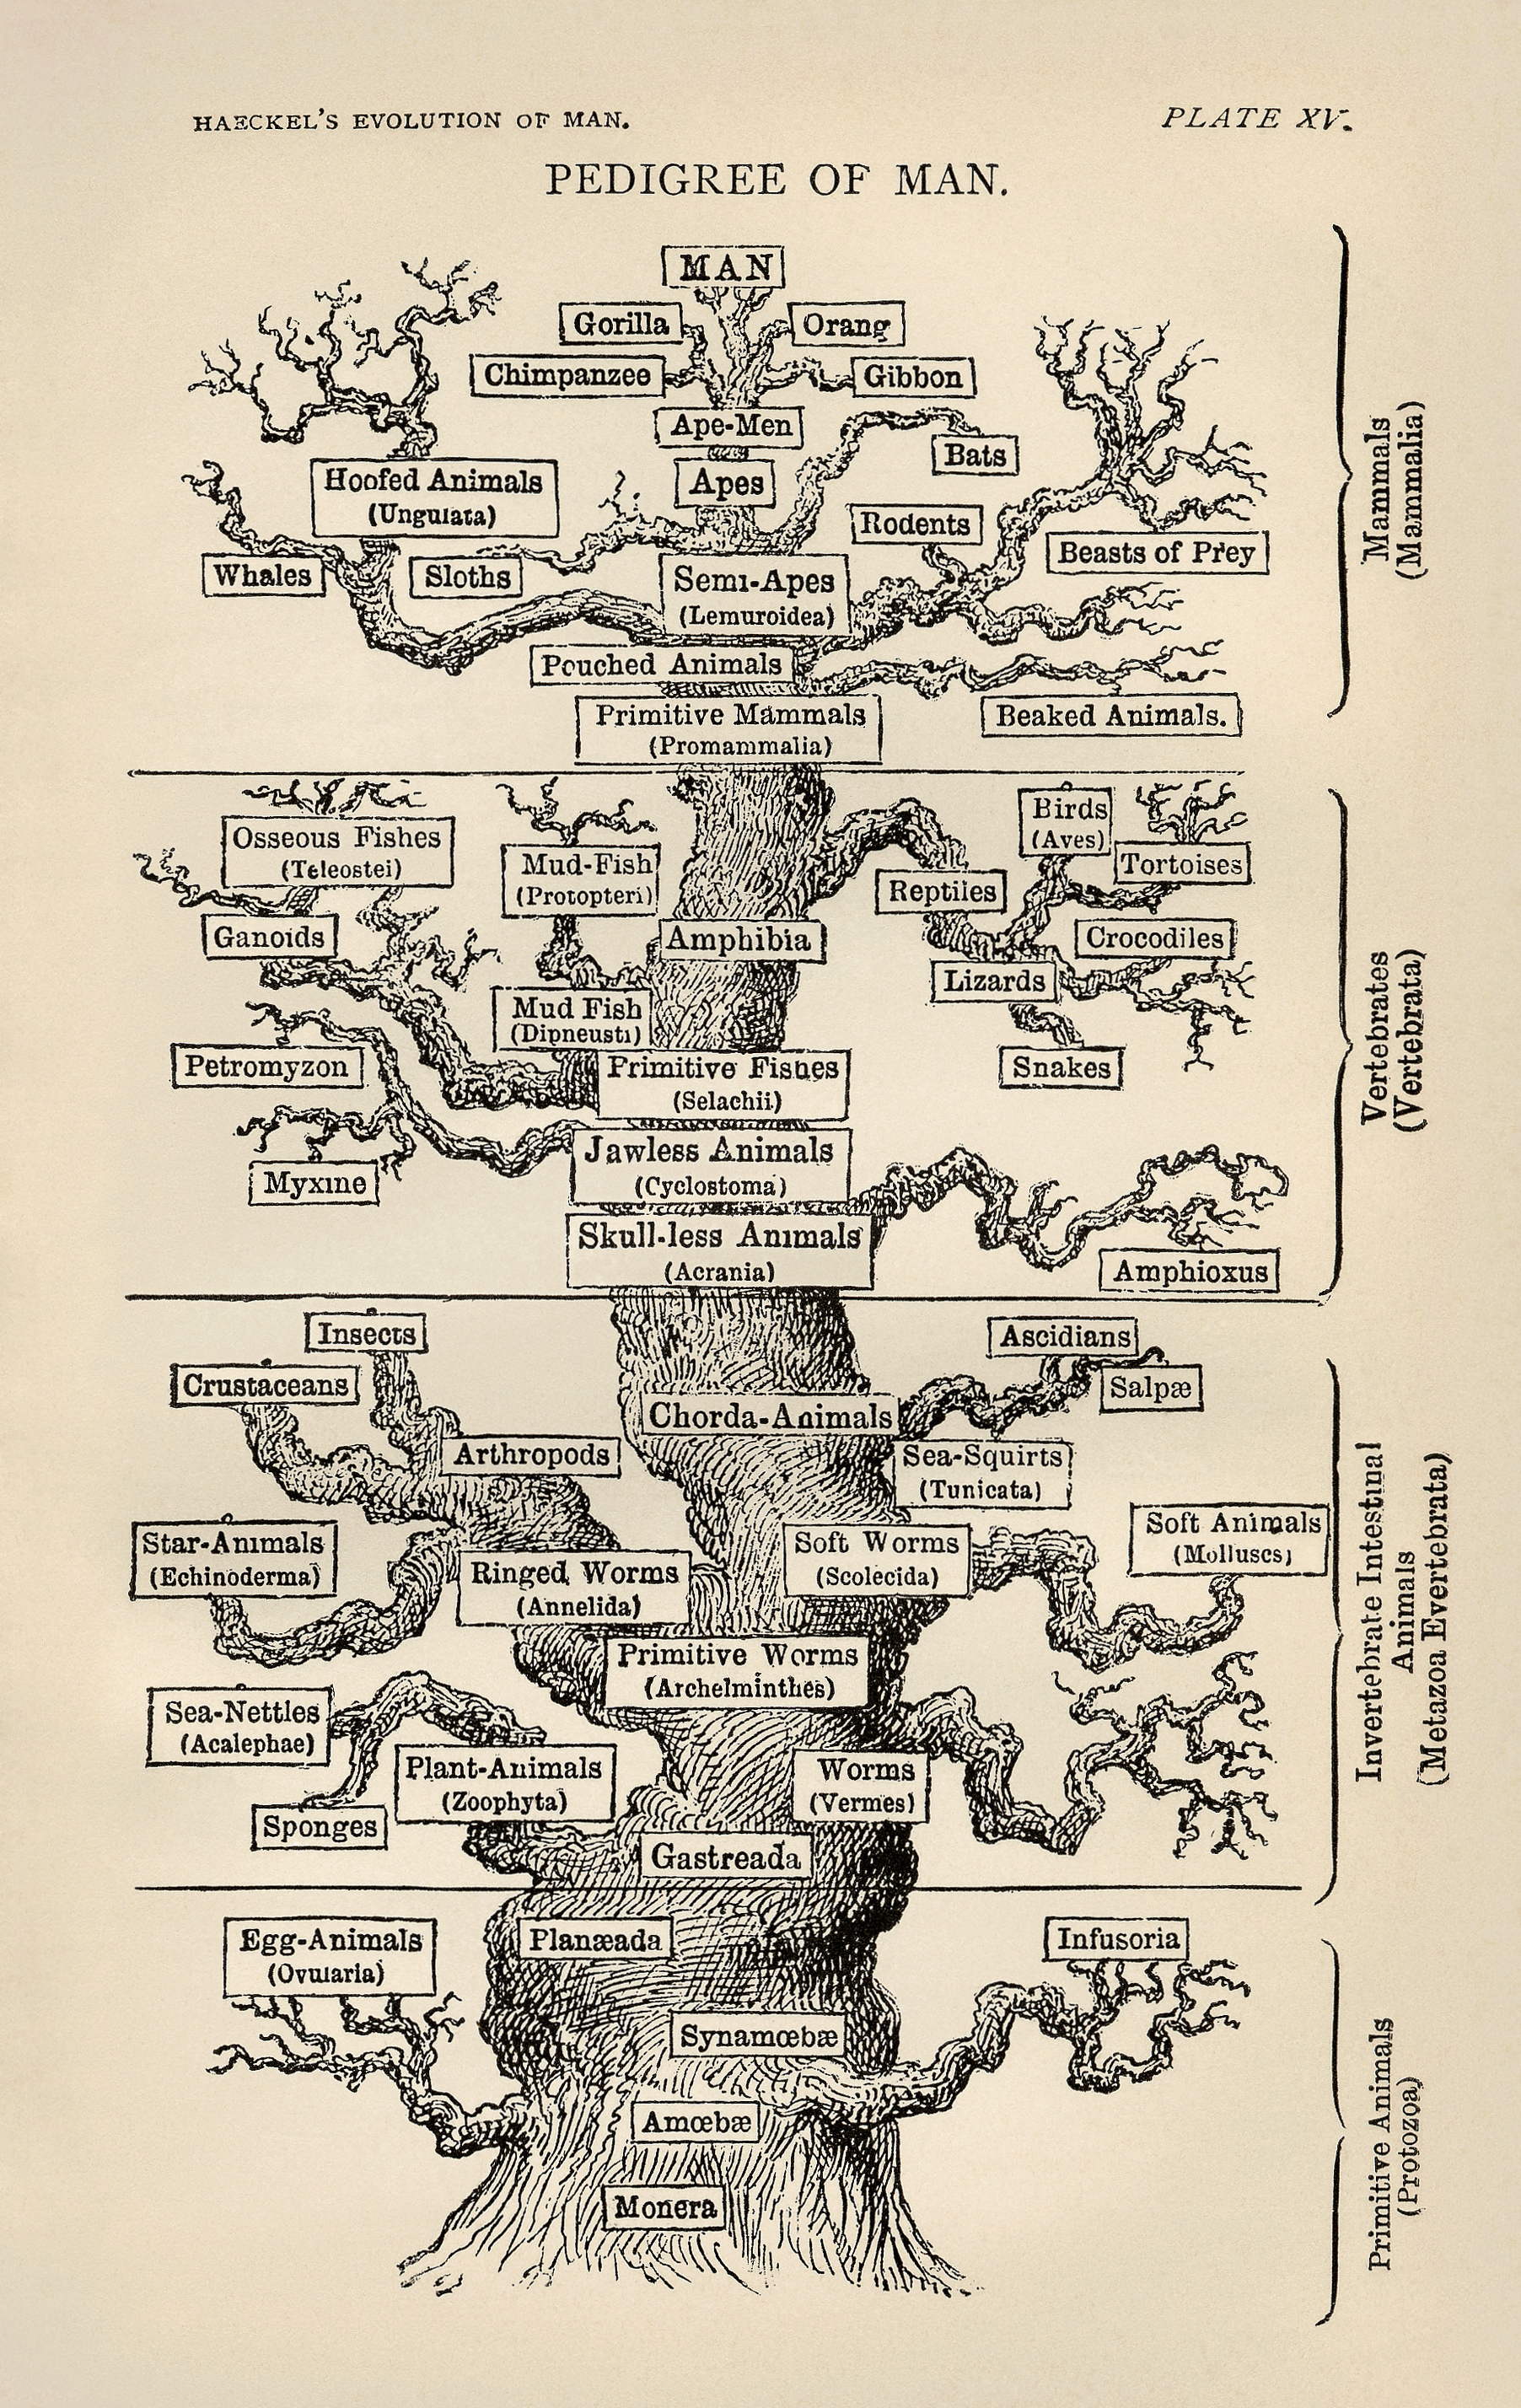
    Tree_of_life_by_Haeckel  

    The second tree, offered by Haeckel in his The
    Evolution of Man
    (1879): shows the general evolutionary progress of
    living things culminating in man, the hopeful and suspected end (or height, or
    crowning achievement) of the process of evolution.  Which is a little odd, come to think of it,
    to have there be nothing above man, not even a space for unimaginable improvement,
    not even a single unused branch to express the possibility of supra-human
    development. 

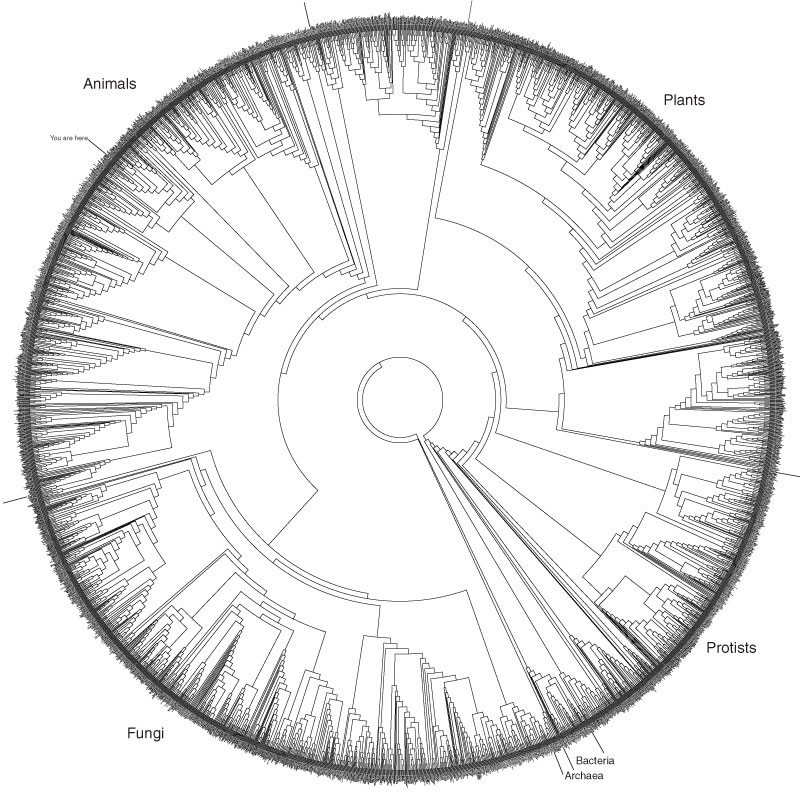
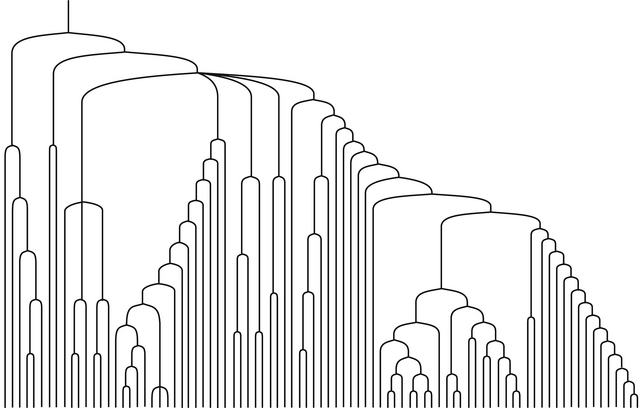
    By far the most complex of the tree of life series is the
    tree ring of life, an exploding and explodably adaptable image generated by the
    Life Website which begins at the beginning, with “life” itself.4

    Tree ring of life

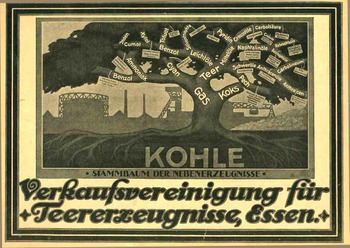
    The coal tree of life is a particularly confusing image. Even though this is a simple classification scheme, and a
    very-well designed graphic at that, the use of the tree describing the genealogy
    of coal by-products just seems, well, wrong. The use of the tree in defining a visual phylogenic interrelatedness of
    living things appears pretty much for the first time in the first edition of the
    Origin of Species in 1859, and it is the only diagram that
    appears in the
    book. (And by this I mean the use of the tree-scheme for scientific
    purposes:  the tree of life of course has been used for many, many
    centuries, the philosophical design woven into the fabrics and incised
    into the stone of many cultures.  It sort of appears in print in
    classification usage at least by the wily and polymathic Athansius
    Kircher, who used it to display the elements in a Kabbalistic Tree of
    Life some 350 years ago.)

    Tree coal
    The Verkaufsvereinigung fuer
    Teererzeugnisse (of Essen) used this idea in
    1922, publishing the ad for their company in the Illusrtriete Zeitung (Leipzig). The great tree spring from a bed of coal (“kohle”)
    exhibiting the “stammbaum der nebenerzeugnisse” (roughly the “pedigree of our
    product”), with the trunk being gas, branching out into tar, coke and cyan and
    so on.  Even though it’s the lifeblood of
    the continuing industrial revolution, and even though we’re hundreds of years into
    a deep need with the products, the use of the tree just seems antithetical to it
    all on all levels of recognition, especially now.

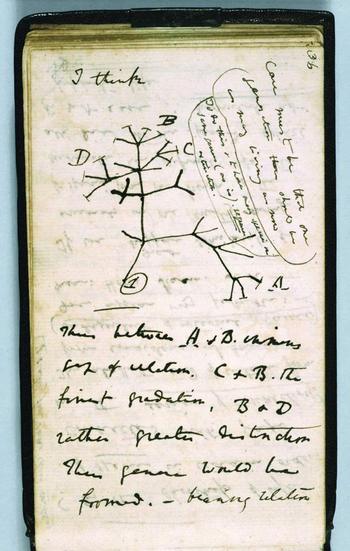
    Then of course there’s the Darwin tree, an incredible diagram from his notebooks, prefaced with the extraordinary understatement, “I think”. 

    There will be more of these tree to come, shortly, including a tree of dermatological disease and some Kabbalisitc trees of life, but they’ll have to wait for right now.
    Darwin_first_tree_2

    Notes:

    1. The full title, as follows: Timber Merchants’ Guide. Also, a table,
    whereby, at one view, may be seen the solid and superficial measure of any
    square or unequal hewed logs or plank, from one to forty-seven inches. Also,
    plates representing the figures of the principal pieces of timber, used in
    building a seventy-four gun ship of the line, in standing trees
    .

    Tree ring oflife explana

    Also, Guillet had some interesting ideas on the conservative use of forest
    lands (from Franklin Hough’s Report upon Forestry, a government document
    printed in 1876):

    Individuals wishing to make
    the most of their woodlands will find it very profitable to cut their timber by
    sections, sparing to t very acre ten or twelve of the most promising size white
    oaks or pines, whichsoever the soil will produce best; range the order of their
    lands so as to cut a section every year. For example, say a man has 200 acres of
    woodland divided into sections of 10 acres each, then, by cutting one section
    every year, he would have young timber twenty years old, which makes excellent
    firewood, and I should say that in common lands wood of twenty years’ growth
    would yield 15 or 20 cords of firewood per acre, besides fencing-timbor
    sufficient to always keep in good repair an inclosure of 200 acres. Then the 10
    or 12 trees growing in reserve will, at the end of 80 or 100 years, furnish
    timber fit to make shipping or staves. Where land has become useless from long
    cultivation, a little trouble only is necessary to make it productive and
    profitable to the owner. By inclosing it for a few years and encouraging the
    growth of the most promising younj* trees, which will generally spring np
    spontaneously, all the advantages above described will be derived from it,
    which is certainly the best way that worn-out or sterile land can be disposed
    of. Such a course recommended to and adopted by individuals wonld not only be
    to their own private gain, but also of great public utility.1

    2. “Monophyletischer
    Stambaum der Organismen” from ‘Generelle Morphologie der Organismen’ (1866).

    3. Wiki biography
    of Haeckel
    http://en.wikipedia.org/wiki/Ernst_Haeckel

    4. Explanation of the second diagram, as follows from Discover Life: “Phylogeny
    is the organizing principle of modern biological taxonomy, and a guiding
    principle of modern phylogeny is monophyly: a monophyletic group is considered
    to be one that contains an ancestral lineage and all of its descendants. Any
    such a group can be extracted from a phylogenetic tree with a single cut. The
    tree shown here provides a guide to the relationships among the major groups of
    the extant (living) organisms in the Tree of Life as we have presented them
    throughout this book. We do include three groups that are not believed to be
    monophyletic; these are designated with quotation marks.”   See also HERE for a different view of this diagram.


  • Curious, Secretive, Sacred Irish Independence Political Icons (?)

    JF Ptak Science Books  Post 821  Blog Bookstore


    “Malone. … My father died of starvation in Ireland in the black ’47. Maybe you heard of it?
    Violet. The Famine!
    Malone (with smouldering passion) No, the Starvation. When a country is full of food, and exporting it, there can be no famine. Me father was starved dead; and I was starved out to America in me mother’s arms. English rule drove me and mine out of Ireland . …” —George Bernard Shaw, Man and Superman (1903)


    0--blog---Nov 28 irish137


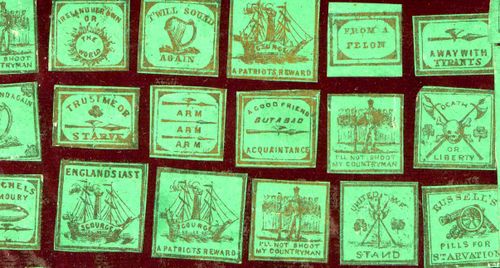
    “The Almighty indeed sent the potato blight but the English created the famine…a million and half men, women and children were carefully, prudently and peacefully slain by the English government. They died of hunger in the midst of abundance which their own hands created.”—John Mitchel (1815-1875), Irish Nationalist (and listed as a “martyr” in one of these badges/stamps)

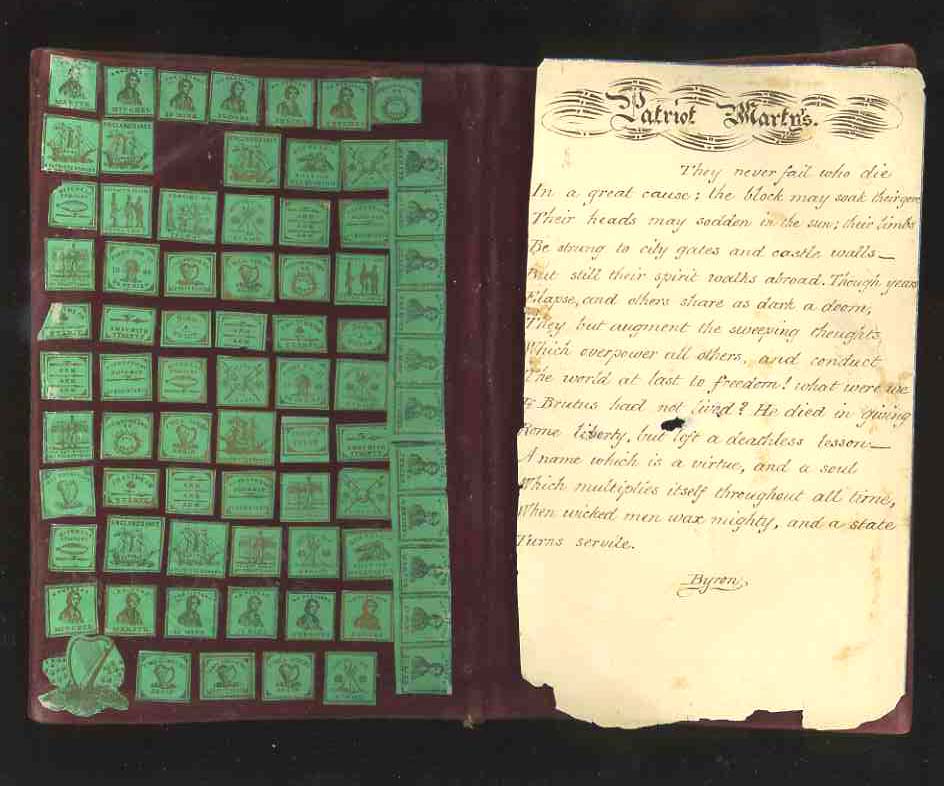
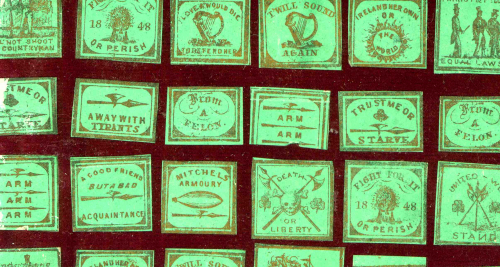
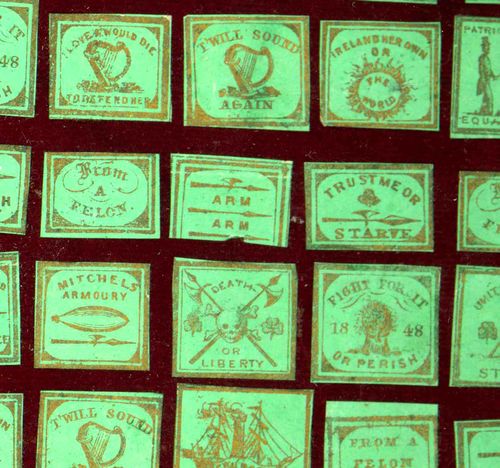
    I’m sorry to say that I do not know the origin of these diminutive, powerful emblems, and that what follows is all guess-work. They are only about a half-inch square or so, but they hold very powerful meanings in their messages.  I imagine that they were political messages to be worn, or posted in the mail, or used in subversive ways–because their messages were enormously subversive, taking on the occupying power of Great Britain at a time of supreme and enforced deprivation, an occupied people fighting against a spectacularly-better equipped foe.  The messages related to the Great Famine of 1847-1849, when the potato crops failed for three consecutive seasons , initiating a chain of events that caused the deaths of perhaps two million people, or 20% of the entire population of Ireland.  People didn’t starve so much as they did die of associative diseases related to the process of starving to death, al of which it seems could have been addressed by some sort of effort by the British government.  It does seem to me as though the people of Ireland were left to flounder and drown.  The stories of the extreme deprivation are horrible:  starving dogs digging up the bodies of the recently unguarded dead, rats attacking the dying for food, and so on.  Terrible, miserable stories coming from what is probably the worst of period of starvation in European history.  the scene has been duplicated numerous times in this century killing hundreds of millions of people:: in Soviet Stalin’s filthy anti-human pogroms, under the equally filthy Maoist adventures in production and nationalist strength in China, in Biafra, in Darfur, and on and on in our frailly stupid political existence here on Earth.

    The small badges have always seemed somewhat sacred to me; there’s just such a feeling of hope and inspiration and overwhelming empathy in them.  


    0--blog---Nov 28 irish 144


    0--blog---Nov 28 irish 145

    0--blog---Nov 28 irish138

    0--blog---Nov 28 irish 143


  • Visual Display of Quantitative Data: Solomon Islands Battle Results

    JF Ptak Science Books LLC  Post 820 Blog Bookstore

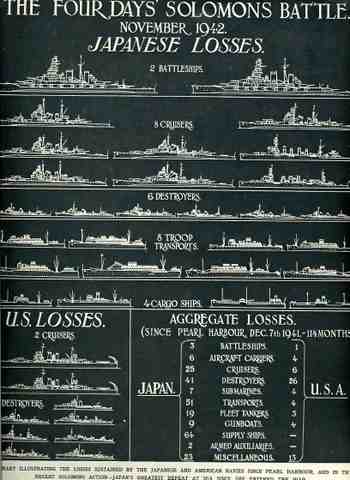
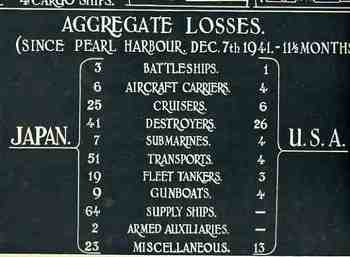
    I’m always ready to see different and interesting methods of displaying quantitative data, and this work–published in LIFE magazine in 1942–certainly fits that category.  That the ship losses are printed in reverse–white on black–is unusual in itself, but the design is just particularly good, fitting a lot of data on a single sheet of paper.  The image dramatically displays some very good (and very welcomed) news for the American public as the campaign for the Pacific dug in.  This was a major Allied victory in November 1942, and one of the pieces of the end for a campaign that stretched itself out over three years. 

    –Solomon Island WWII battle chronology found HERE.

    –General history of the Solomons campaigns HEREBlog1sept_16_solomon_battle567.                                                                                                           

    Detail of the above:

    Blog1sept_16_solomon_battle_det568


  • Anthropomorphic Display of Quantitative Data: Flight Safety, 1912

    JF Ptak Science Books LLC  Post 815

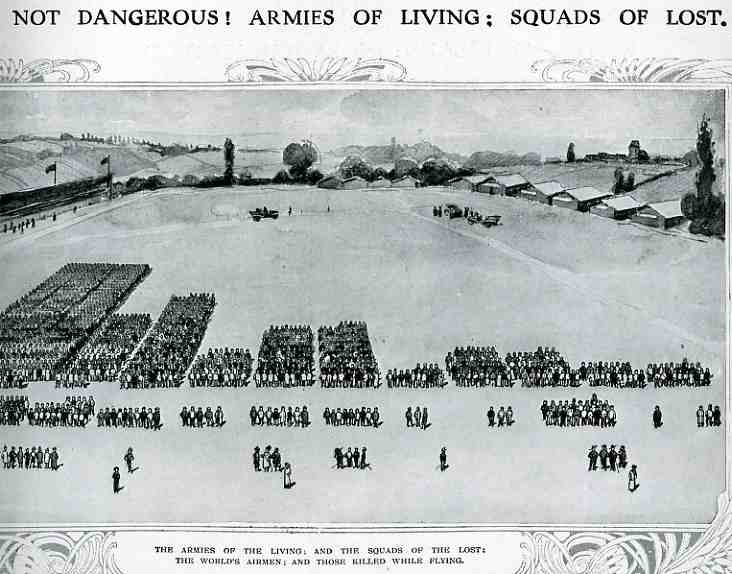
    Even though masses of people had been used in panoramic photography for some years (thousands of people, usually soldiers, gathered to form a living liberty bell, or portrait of George Washington, or some such thing) , I cannot recall the use of humans as a direct statistical aid as in this bio-bar graph, found in the pages of The Illustrated London News for 1912 (page 357).  000-ebay--Nov 7 air death005

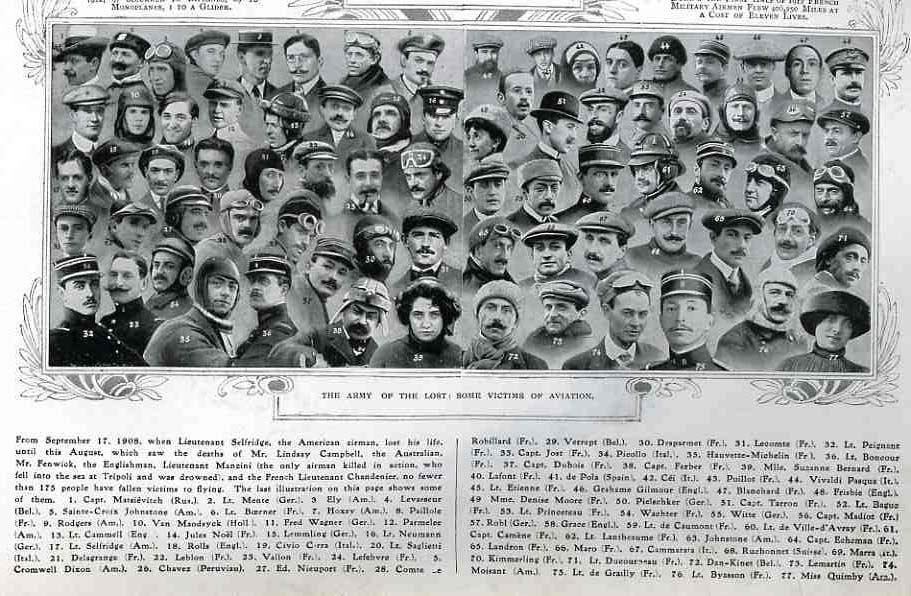
    The article asks the question of whether air travel (and flight in general) was “safe”, and responded by graphing its “yes” response with this image. The larger groups in the top half of the image represent the number of flyers flying for that particular country; the small groups below show the number of aviators killed.  (There is no date of reference in particular but it seems to me that these are total deaths since flying began in Europe in earnest in 1905.) The photomontage below shows a selection of some of the most famous dead aviators. The number of deaths as a percentage of those flying seemed quite acceptable in the year of publication (1912) ; however if these figures were iterated forward to 2009 the death rate would be staggering, sending many thousands of aviators (and crew and passengers) to their deaths each year.  In the United States we save that safety failure for deaths in automobile accidents, which still kill about the same number of Americans each year as were U.S. soldiers lost for the entire war in Vietnam.  In spite of this the odds for survival looked pretty good in 1912. 

    000-ebay--Nov 7 air death portrait006


  • The Value of Money and Almost-Useful Information

    JF Ptak Science Books LLC  Post 814   Blog Bookstore

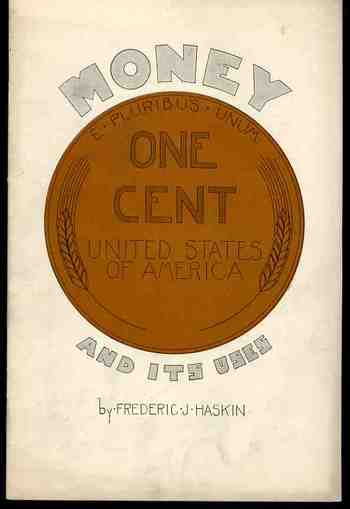
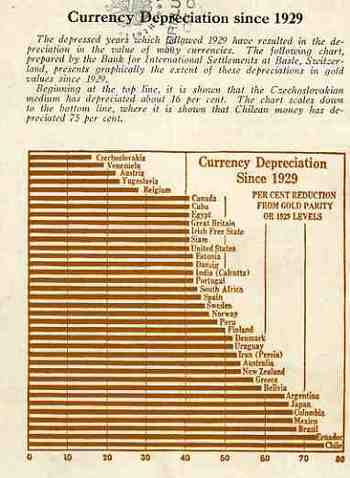
    I initially chose this pamphlet to be part of a larger series on terrific/unusual/bizarre cover designs–unfortunately its contents got in the way, a little.  The cover still borders safely on the unique, and so does most of its contents, except for the graphical analysis of the depreciation of worldwide currencies that appears on its back cover.  Here the information is actually pretty useful and unusual. It would’ve been more useful had the author included an end date for his comparisons–all we know is that he is looking at 1929 and the beginning of the Depression as a jump-off point, and we can assume that the end date is before the date of publication of the pamphlet (which actually isn’t stated).  Still, the graph is almost very useful.  It is for this reason that Money and its Uses Winds Up in the “Blank and Empty Department” for its diligent but ultimately useless graphical display of data.

    1blog_oc_t_9_money795

    1blog_oc_t_9_money796


  • The History of the Internet: Remembering Vannevar Bush and the Memex (1945)

    JF Ptak Science Books LLC  Post 812  Blog Bookstore

    On this day, which may or not be the 40th anniversary of the
    first use of the internet (and the 80th anniversary of the collapse
    of the stock market of ’29, and Lucy A’s anniversary of her birth) it might be
    good to remember an earlier version of the internet and the semi-invention of
    the concept of hypertext: the MEMEX machine of the under-remembered Vannevar Bush. 

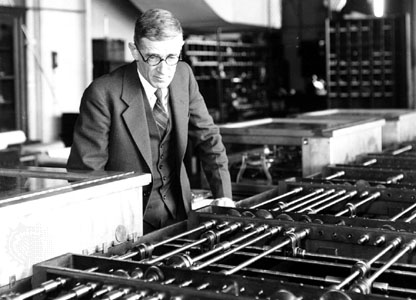
    Bush

    Vannevar (pronounced “van ee var”) was a flinty no-nonsense New Englander
    who was an organizational and mechanical genius who as a professor at MIT
    developed a remarkable analog computer that greatly advance computation
    capacities for solving differential equations. 
    This was in the 1930’s, and even after creating an improved
    electromechanical version of the machine still chose the wrong way to go in the
    soon-to-materialize digital computer revolution.  During WWII Bush was one of the most
    important Americans in the war effort, overseeing the entire scientific effort
    of the U.S.—an
    enormous effort dispatched beautifully (and successfully).  His importance in this regard is difficult to
    overstate.

    But right there at the end of the war, when he was organizing a still-secret
    effort of controlling the spread of atomic weapons (before Hiroshima), Bush was also thinking about the
    future of the organization of human knowledge and memory.  And published it, too, in the popular Atlantic magazine in July 1945. (It was
    republished in a shortened version a few months later in September—it remains
    to this day, according to an editor at Atlantic, one of the most
    often-requested reprints) where it reached a reading audience of millions.  The article, “As We May Think”, outlined his
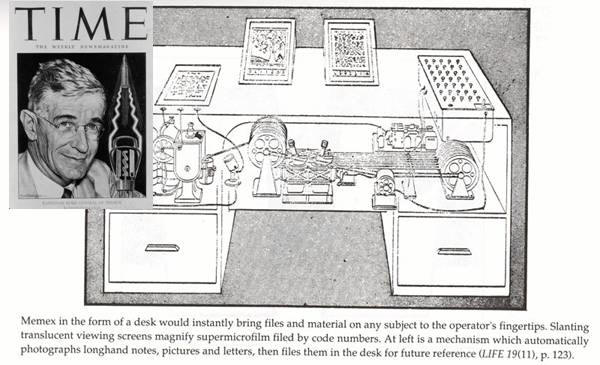
    idea for a device he called the MEMEX1 (“memory” and  “index”), which compressed and organized all
    that its user could remember and whatever information would be obtained in the
    future via electromechanical apparatuses, and available with associative tracking
    between the microtext frames.  So all
    manner of book and papers and reports and newspapers and images would be
    microphotographed and stored in a beautifully-indexed mechanical retrieval
    system where it would live with the information of others.  There was also the possibility of real-time
    textual additions to whatever it was that was retrieved, the genetic precursor
    of hypertext.  Bush’s thinking has been deeply
    recognized (and also by the creators of the internet) as the intellectual
    grandparent of the modern internet. 

    Bush Memex

    I just thought on this day that the man who saw more clearly into the future
    on advanced global communication and societal memory should be remembered on a
    day when his grandchild came into being.

    Notes:

    1. According to Bush, “the MEMEX is a sort of mechanized private file and
    library…. It uses methods such as microfilm storage, dry photography, and
    analog computing to give postwar scholars access to a huge, indexed repository
    of knowledge-any section of which can be called up with a few keystrokes.”
     Wardrip-Fruin, Noah and Nick Montfort,
    ed (2003). The New Media Reader. p. 35. The MIT Press

    The physical plant of the MEMEX:  “A
    memex consists of a desk, where on top are slating translucent screens on which
    material can be projected for convenient reading. Within the desk were
    mechanisms that stored information through microphotography. Most of the memex
    contents are purchased on microfilm ready for insertion. On the top of the
    memex is a transparent platen. When a longhand note, photograph, memoranda, and
    other things are in place, the depression of a lever causes it to be
    photographed onto the next blank space in a section of the memex film, dry
    photography being employed.”  Manovich, Lev. “As We May
    Think”, The New Media Reader and
    wiki on The Memex. 


  • Pig Iron vs. Eiffel Tower: Visualizing Difficult Numbers and Concepts

    JF Ptak Science Books   Quick Post  

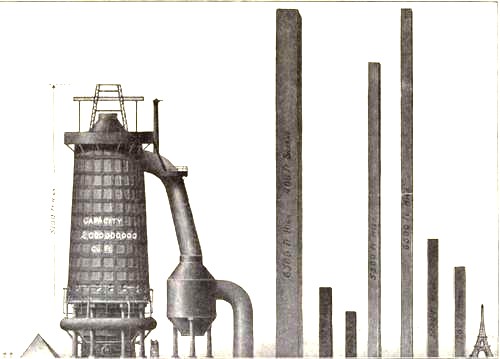
    Several years ago I wrote about some triumphantly unusual images (plus one on the 1891 10-ton Eiffel Tower bullet) of the Eiffel Tower–today I’d like to add another, a queer image which manages to loose the Eiffel Tower (and the Great Pyramid) in representations of pig iron production.

    Diagram steel eiffel 

    I love comparison like this (which appeared in the Illustrated London News for 1910), representing big, hard-to-associate  numbers of something against another quantity that can be instantly understood–the relationship between the two might be tenuous and complex, but at least it can give you some sort of handle on what would normally be an inaccessible, stand-alone number. Plus, any time that you can show what an ungraspable concept might “look like” and be explainable to a 10-year-old, well, you’ve got something. 


  • Big Mathematics 1816: Manuscript Notes and Found Math Art

    JF Ptak Science Books LLC  Post 757  Blog Bookstore

    In my science bookstore business one of my principle interests is antique manuscript notebooks in the sciences.  It is a pleasure to see someone working through a problem, or finding what the writer thought to be the most interesting point in a lecture on a particular subject, and to read the occasional doodles and see the timely gloss every now and then.  I’ve had notebooks from an advanced and very careful student for a course given by the great Robert Bunsen that was filled with hundreds of pages of what the master was trying to communicate to his pupils.

    ++00++ 9.16 math

    There’s also a  series of notebooks from the spectacular period of Cornell physics history (1948-1949), including 6 notebooks of classes with Richard Feynman, including several hundred pages from his 1948/9 course in advanced quantum mechanics, which included (a very early) use of the Feynman diagrams.  The thing that makes these observant, advanced notes taken during Feynman’s classes have more than a pedagogical interest (which is substantial and enough on its own)—they have a capacity to show the logic behind the man’s thinking and how he presented his ideas over a period of some months.  Also, and curiously, notebooks like these seem to have not survived. 

    Then there’s the notebooks taken by the team of Charlotte and Fritz John when they were pursing doctoral degrees at Goettingen (1929-1933), until forced to leave with the enforcement of the Nazi laws against non-Aryans.  Goettingen happened (and happens) to be the seat of a long, great mathematical heritage, home of Felix Klein, Emmy Noether, David Hilbert and Bernhard Riemann (among many others).  The notebooks—some two linear feet of them—represented four years of advanced interactions with some of the finest mathematical minds in Germany.  I was told by Mrs. John that they were required to take such full notes—but let me tell you, these notebooks were typed transcriptions of the daily handwritten notes, compiled over the course of a class, and then bound.  They are beautiful, and go far beyond my concept of “required”.  Mrs. John told me the story of the class notes that she and Dr. John took while taking a course with the great Hermann Weyl (who had taken his doctorate under the iconic David Hilbert, and who was also forced to flee Goettingen because his wife was Jewish):  everyone of course was required to take extensive notes during the day and work on them during the night, turning them in the following day for appraisal.  She told me that she still vividly remember placing their notes on a long wooden table at the front of the class, and then picking that set of note up the next day.  After a month of this, she, said, they became convinced that Weyl was not looking at the notes at all, as everything seemed always to be in the spot that they left it in.  One week they decided to see if the notes were being moved, and placed a hair carefully on the interior page, reasoning that if the notes were reviewed, the hair would be gone.  For a week, the hairs stayed in place.  “And so, what did that mean to you?” 

    ++00++ 9.16 math block

    Mrs. John replied that it really didn’t mean anything, and that they continued to do the notes as they would, and leave them on the long wooden table.  They never slacked off (which I can fully imagine).  She said that they did it for themselves, of course, but also they did it for Dr. Weyl, fully expecting that the day that they missed handing in their notes would be the day that they were looked for by Dr. Weyl.  Plus they were studying with a famous and fabulous thinker, and did not want to disappoint themselves or their instructor. 

    I do enjoy the historic or significant material like this, but I also quite the naïve, homegrown, elementary manuscript attempts by children at doing math or understanding physics.  Cipher books have always been a little hard to find in my field, wit many of them (I think) winding up in the genealogy area), and they just don’t seem to be very much on the findable side of things anymore. 

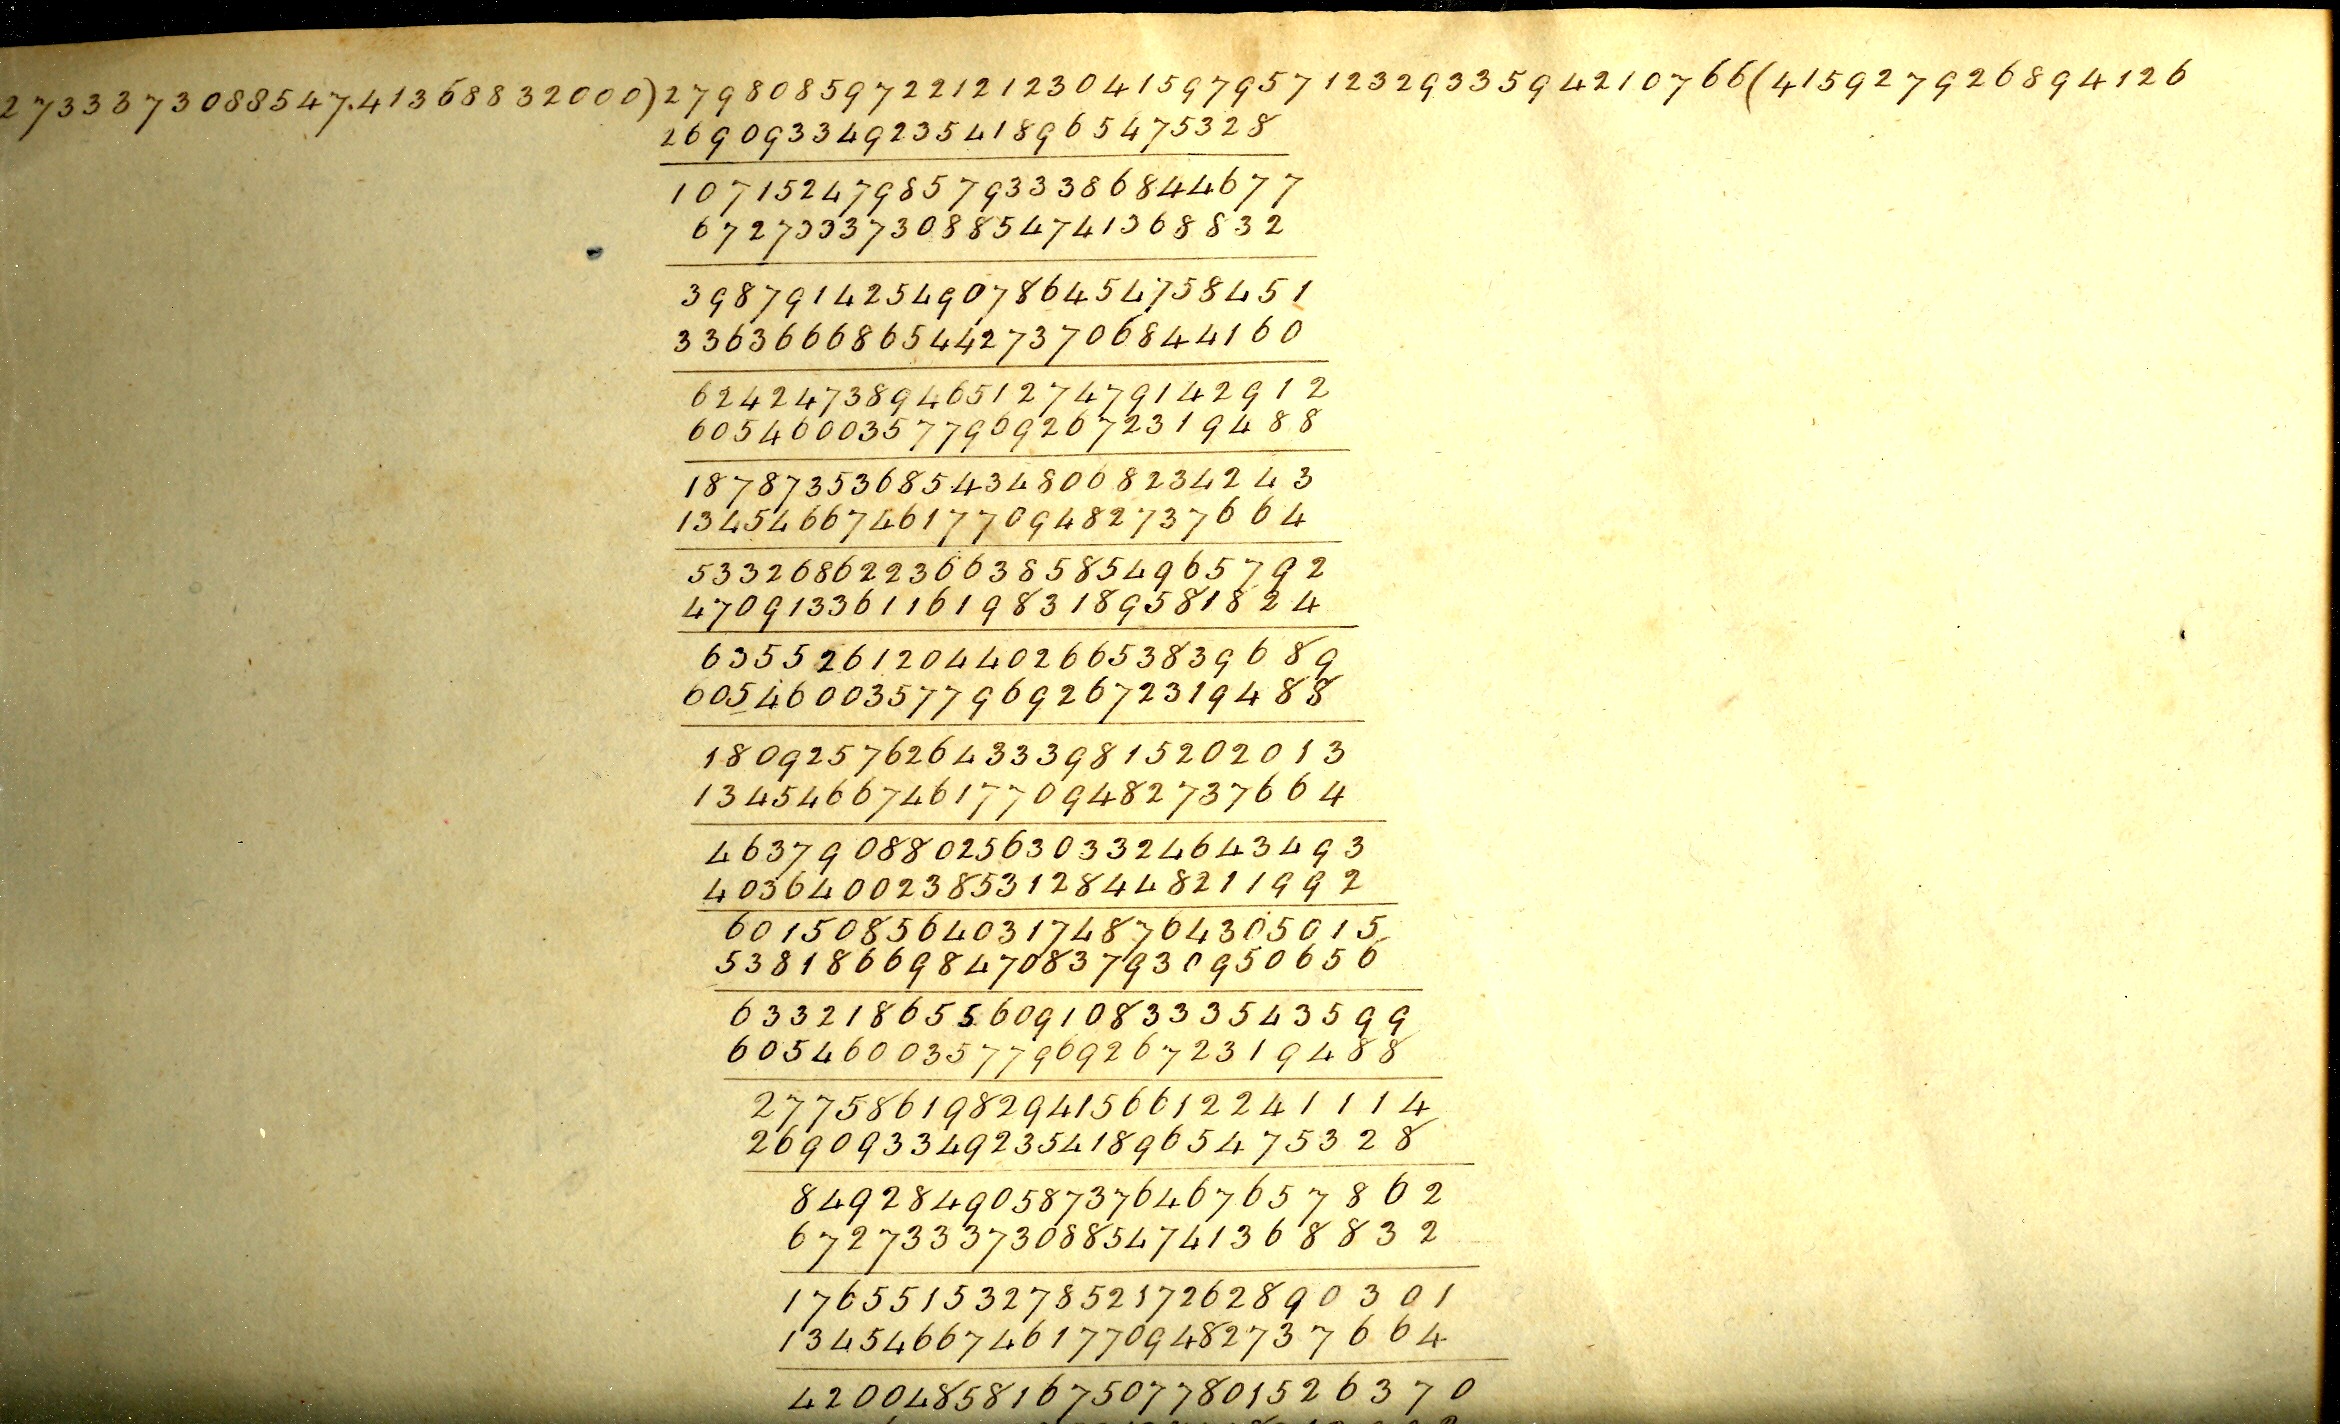
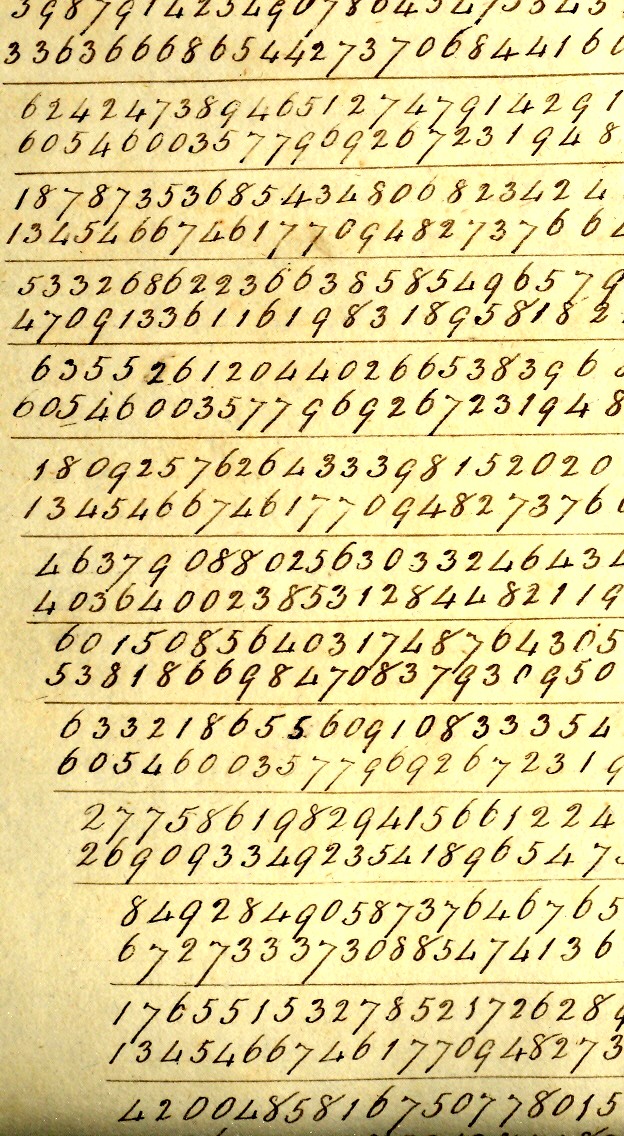
    The example I’ve reproduced here are from an anonymous (but dated 1818) work on different elementary areas of mathematics.  What makes this special to me is the precision of the penmanship and the extreme effort that is being used for a simple display of division.  It would certainly convey the message if the author had used two five-figure numbers to display division rather than these enormous, never-to-be-encountered numbers. 

    ++00++ 9.16 math string

    Surely there were pages and pages of scrap used to get to this point as the operator machined his numbers down, showing us the result rather than the real process.  But what is left to us in this effort is a thing of considerable beauty—the found art of practicing elementary math.