A Daily History of Holes, Dots, Lines, Science, History, Math, Physics, Art, the Unintentional Absurd, Architecture, Maps, Data Visualization, Blank and Missing Things, and so on. |1.6 million words, 7500 images, 4.9 million hits| Press & appearances in The Times, Le Figaro, Mensa, The Economist, The Guardian, Discovery News, Slate, Le Monde, Sci American Blogs, Le Pont, and many other places… 5000+ total posts since 2008.

Category: History of Dots

  • History of Dots Series: Dots of 1947

    JF Ptak Science Books   Post 1027

    {Another in the History of Dots series.]

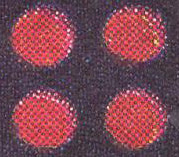
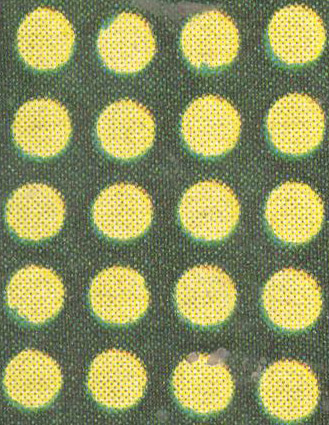
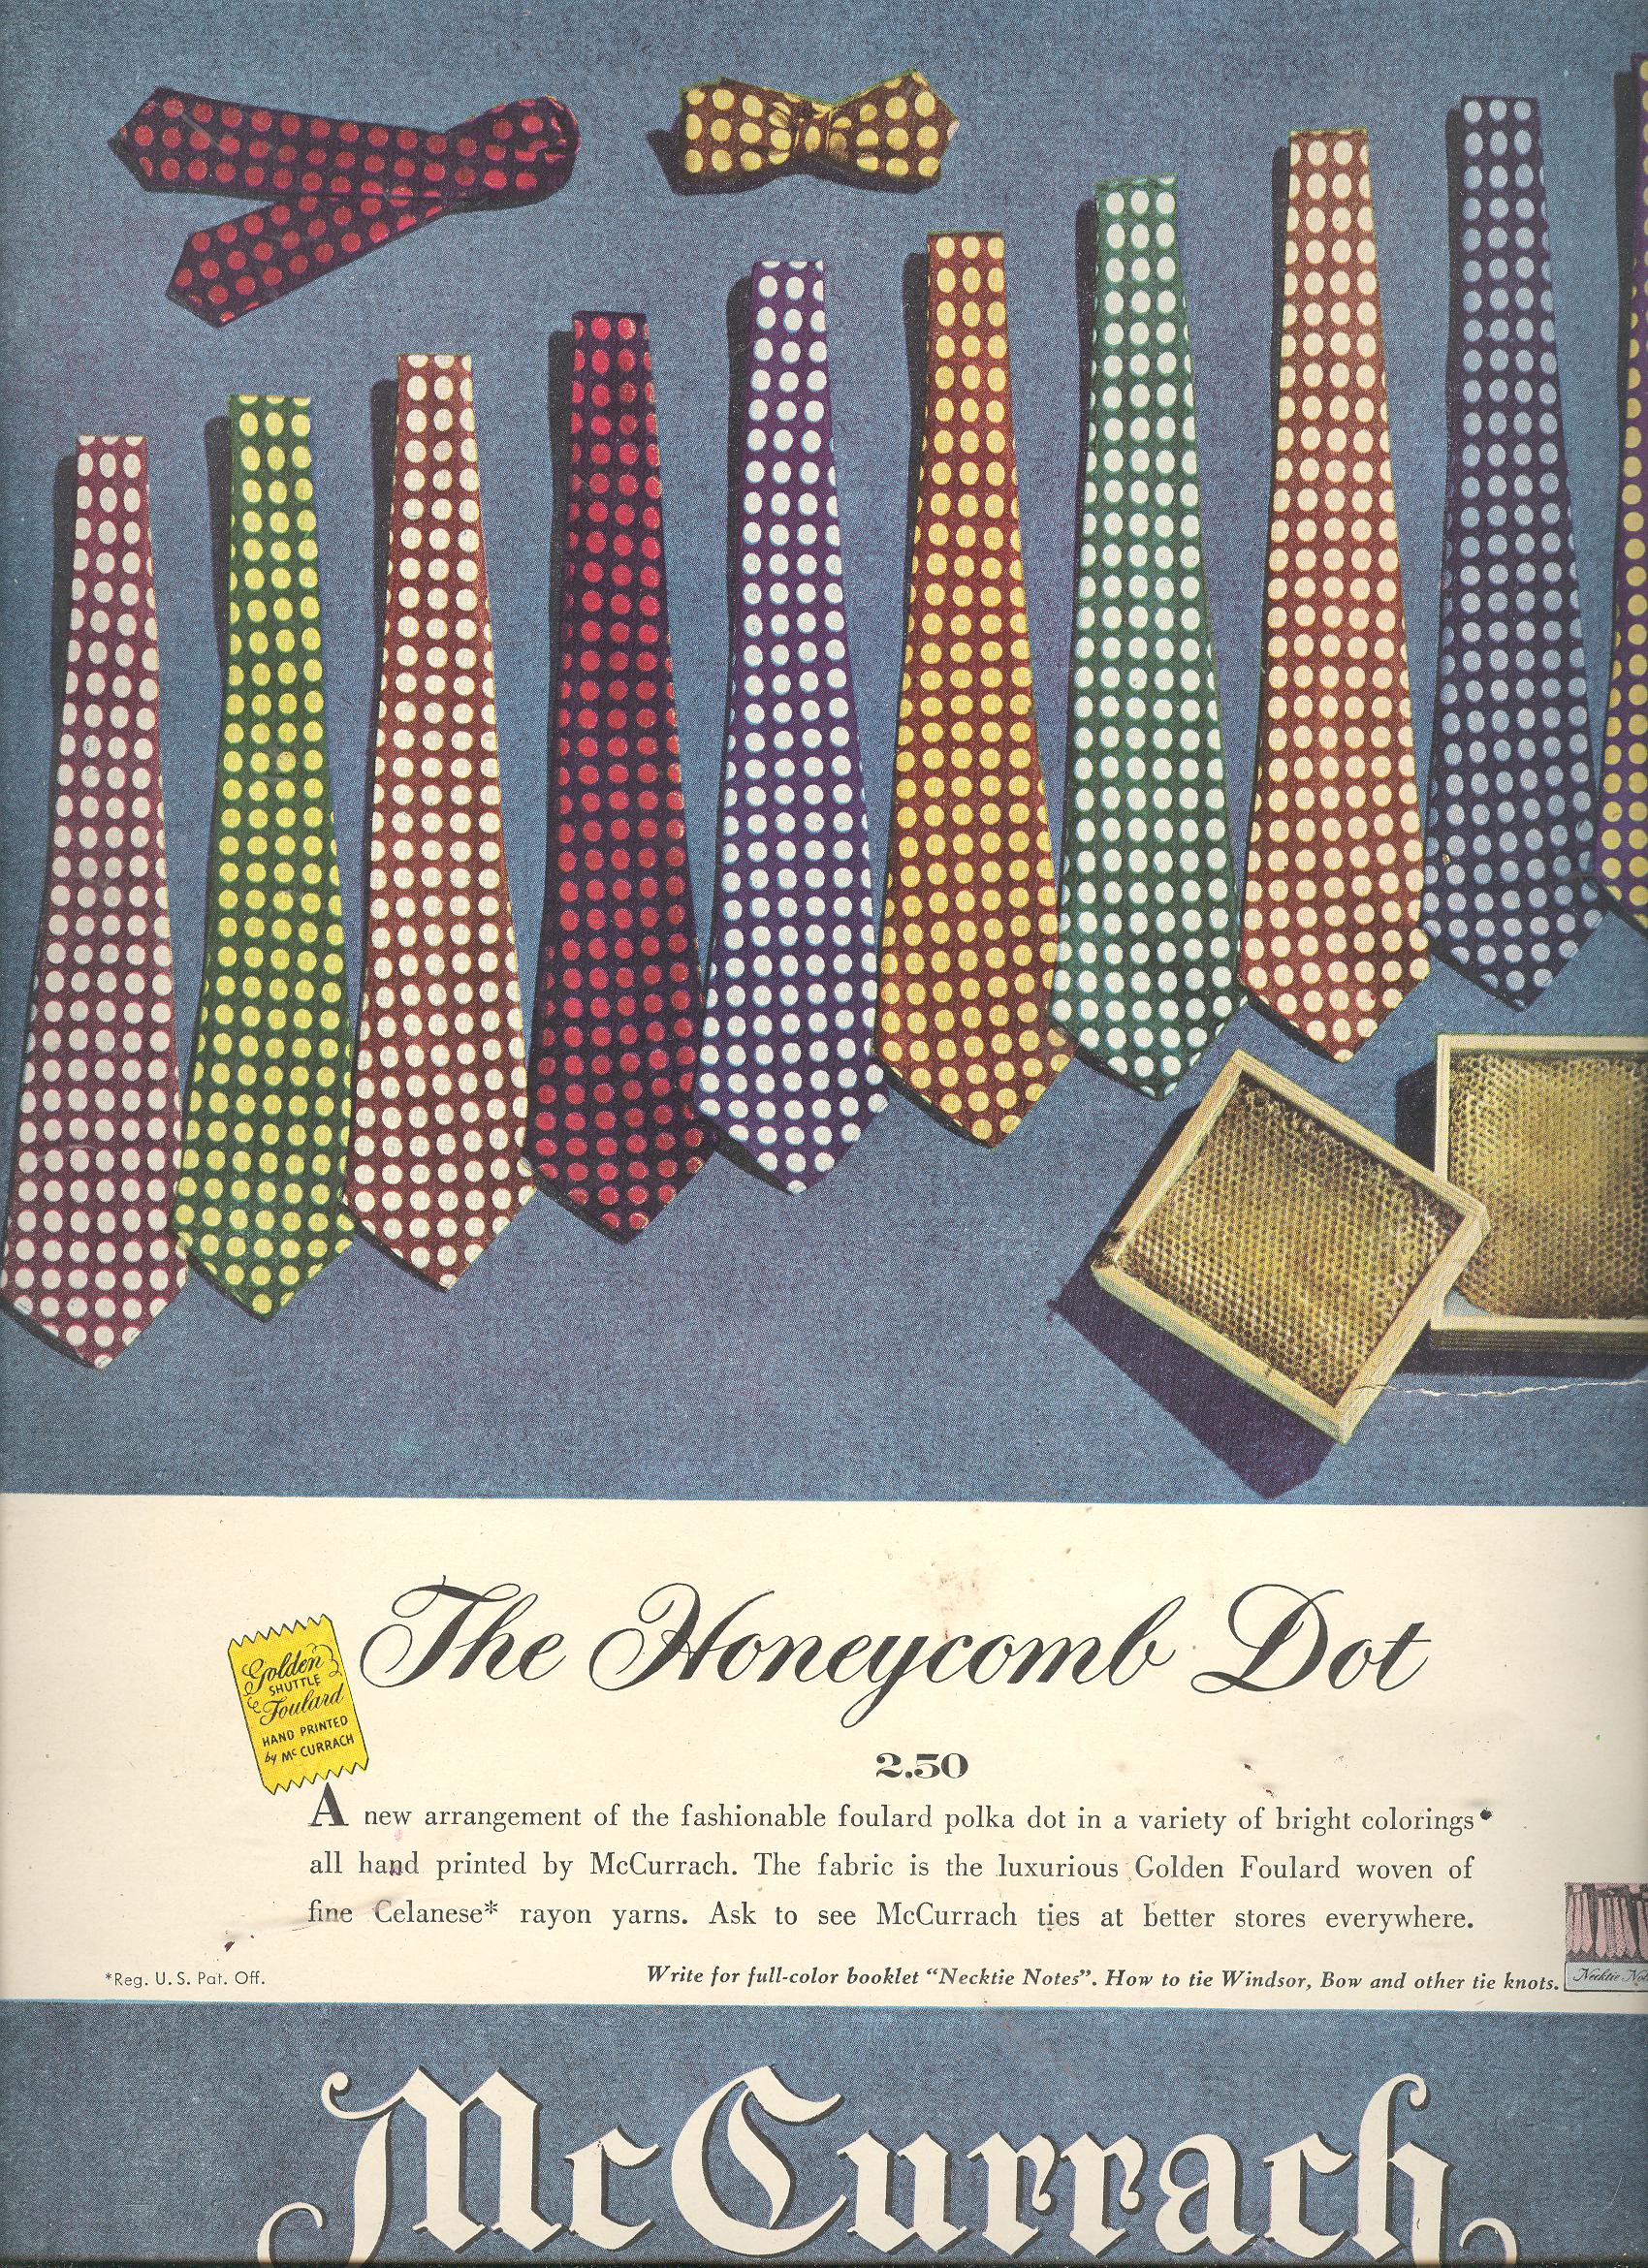
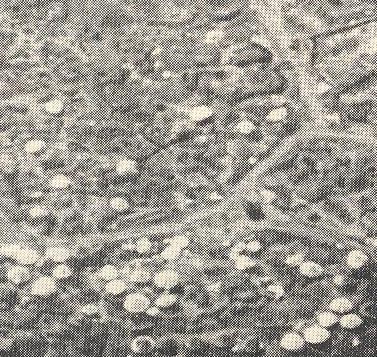
    The molecular chemistry of dots of 1947 is a beautiful thing, worthy of a powers-of-ten episode, though I can only do a gigantically scaled down version of it (a powers-of-two maybe) given pixelation and its dot-defeating and necessary tendency to relieve roundness and introduce squares everywhere. 

    1--may 13 tie dots det 1 

    1--may 13 tie dots det 2

    1--may 13 tie dots det 3

    1--may 13 tie dots det

    1--may 13 tie dots


  • The Exploding Dots of Falling Dominoes: Vietnam, 1954

    JF Ptak Science Books LLC  Post 996

    This story is more about Ho Chi Minh’s capture of French silk than about anything else–it is a peep into the future following the end of the French endgame in Vietnam, which came abruptly with their defeat at the Battle of Dien Bien Phu in 1954.
    Blog--april 1 detail

    [Detail/larger image below.]

    The siege there started on the 13th of March, and lasted 57
    days, until May 7th, 1954. The
    commanding general of the Viet Minh forces, Vo Nguy Giap, achieved an enormous
    victory over the French—the first time a guerrilla force readjusted itself into
    a conventional force to defeat a Western army. It was the end of the line for the French military involvement there and it just so happened to be
    the beginning of Vietnam as an object on the American foreign policy event horizon.

     Just a week after this notice appeared, Dwight Eisenhower made his domino
    speech:

    “Finally, you have broader considerations that might follow what you would
    call the “falling domino” principle. You have a row of dominoes set
    up, you knock over the first one, and what will happen to the last one is the
    certainty that it will go over very quickly. So you could have a beginning of a
    disintegration that would have the most profound influences.conference…”

    Vietnam was supposed to be one of those dominoes.  Evidently all of the dominoes were the same size regardless of the size or international presence of the country.  It was also the same sort of domino even if had appealed for American recognition of its democracy-laced post-WWII government. And it was a domino still even if the United States had helped fashion the events that necessitated the movement of that country toward domino-hood.  No matter.  The U.S. decided to back the French in reclaiming their war-lost possession, in spite of the fact that the French were still doing business during the war with the Japanese occupying force in Vietnam, and in spite of the fact that the French re-armed Japanese troops to help fight against the “insurgent” forces of Ho Chi Minh.  It was an ugly decision, and I suspect FDR was just too sick to deal with it properly. 

    Nine years later, the French had finally been soundly defeated and Vietnam thought that it had finally gained independence.  Not so. 

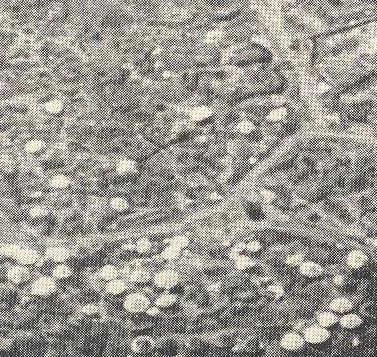
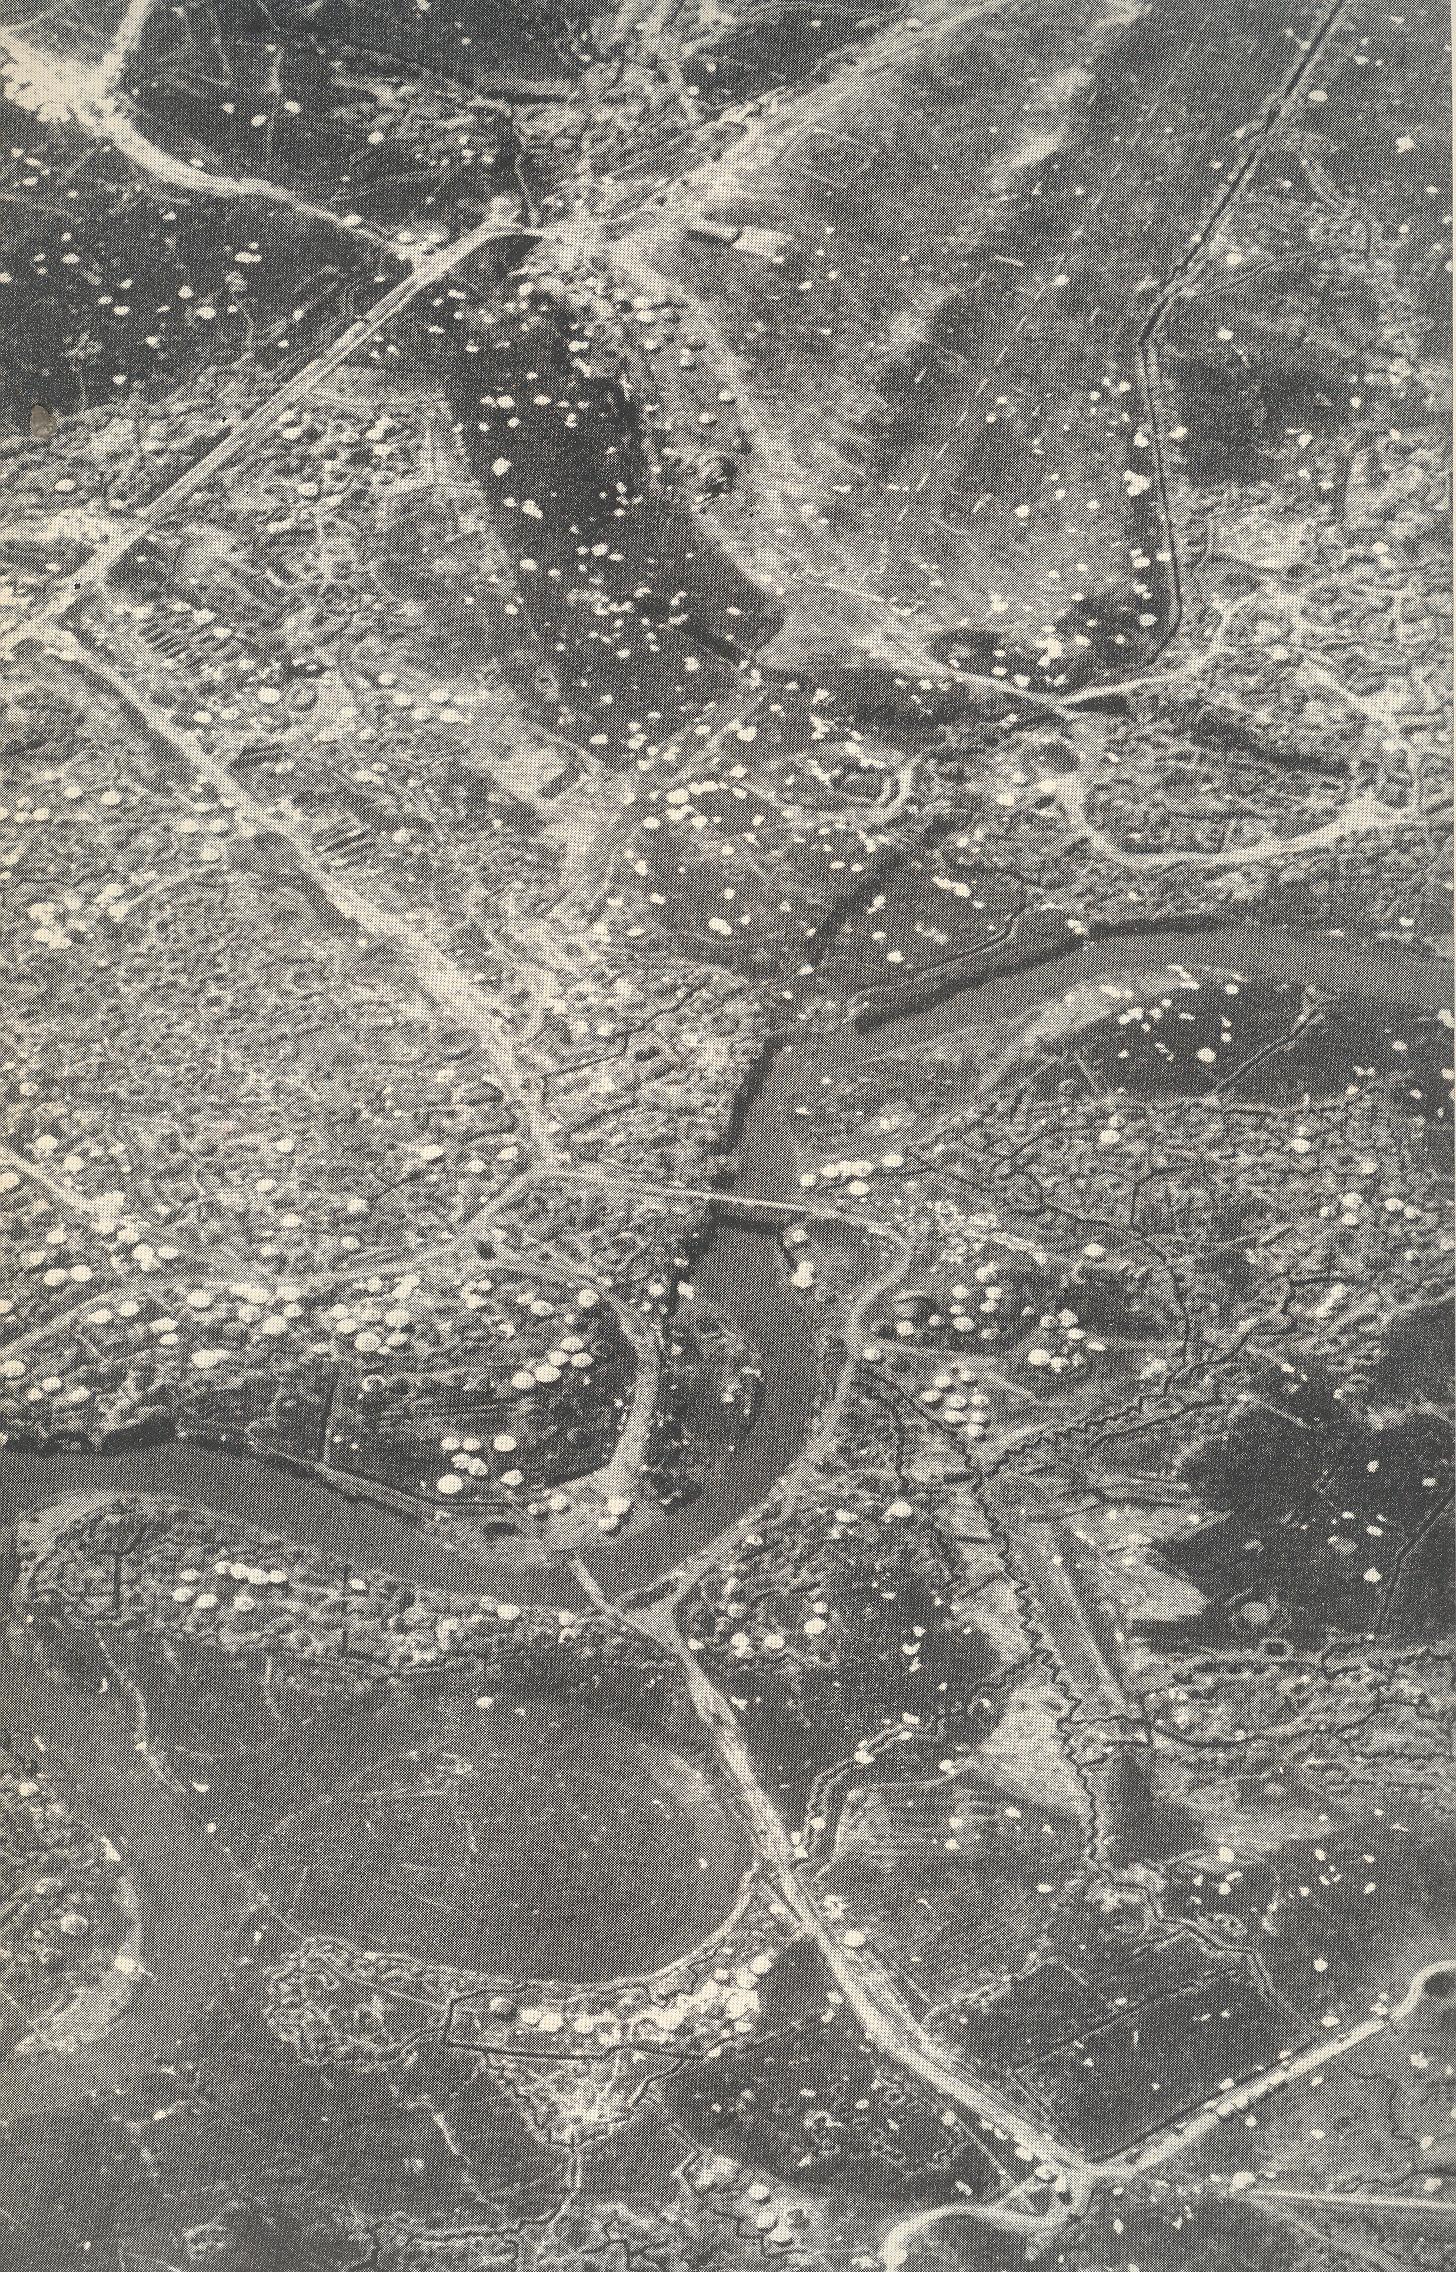
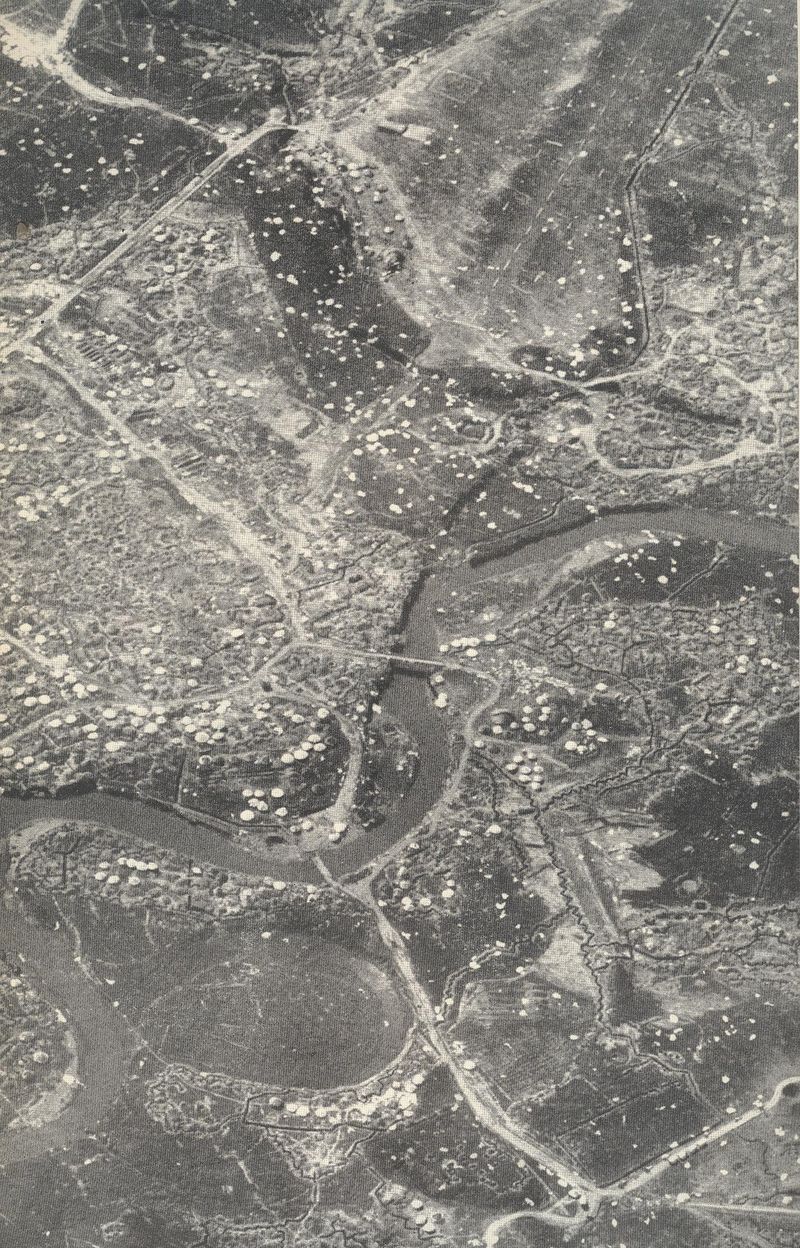
    The picture here is of dots–the field of battle at Dien Bien Phu, littered with silk parachutes–cargo dropped by the French air force to the defenders of the garrison….most of which, evidently, fell well outside the French-controlled perimeter and into the hands of the attacking Vietnamese army.  These were the exploding dots of the falling domino.
    Blog--april 1 

    If these dots stood for something, they could stand for the coming wave of death and misery, a graphical representation of what was to come over the next 25 or so years.

    I reckon there to be about 500 parachutes/dots in this picture.
    Each of these dots could be assigned a number, each representing a gross statistic for the war, from  1950 to 1975:

    U.S. forces killed in action:  100/dot (58,000 killed)

    U.S. forces wounded in action: 300/dot  (313,000)

    Army of the Republic of Vietnam, killed in action:  500/dot (263,000)

    Army of North Vietnam, killed in action:  2,000/dot (1.1 million killed)

    Civilian deaths, North & South Vietnam: 4000/dot (2 million killed)

    Civilian deaths caused by North Vietnam during the war: 300/dot

    Civilian deaths caused by “North” Vietnam, postwar consolidation and reeducation: 1,000/dot

    Civilian deaths caused by the U.S.: 175/dot

    All deaths for the war, 1950-1975: 8,000/dot (using a figure of 4 million).


  • A Note on “Opposite Sameness” in the History of Dots

    JF Ptak Science Books LLC  Post 968 

    Part
    of the History of Dots series that I find so attractive is the dot’s great
    equalizing effect.  The dot has the
    potential of making everyone, everywhere, feel the wonder of mighty
    insignificance—the Earth, for example, depicted from far away, a dot in the
    cosmos, the solar system a dot in the galaxy, the galaxy a dot in the realm of
    galaxies.  And then back again, powering perspective
    back inside us, finding the common thread of humanity again at the cellular level,
    a dot of sameness.

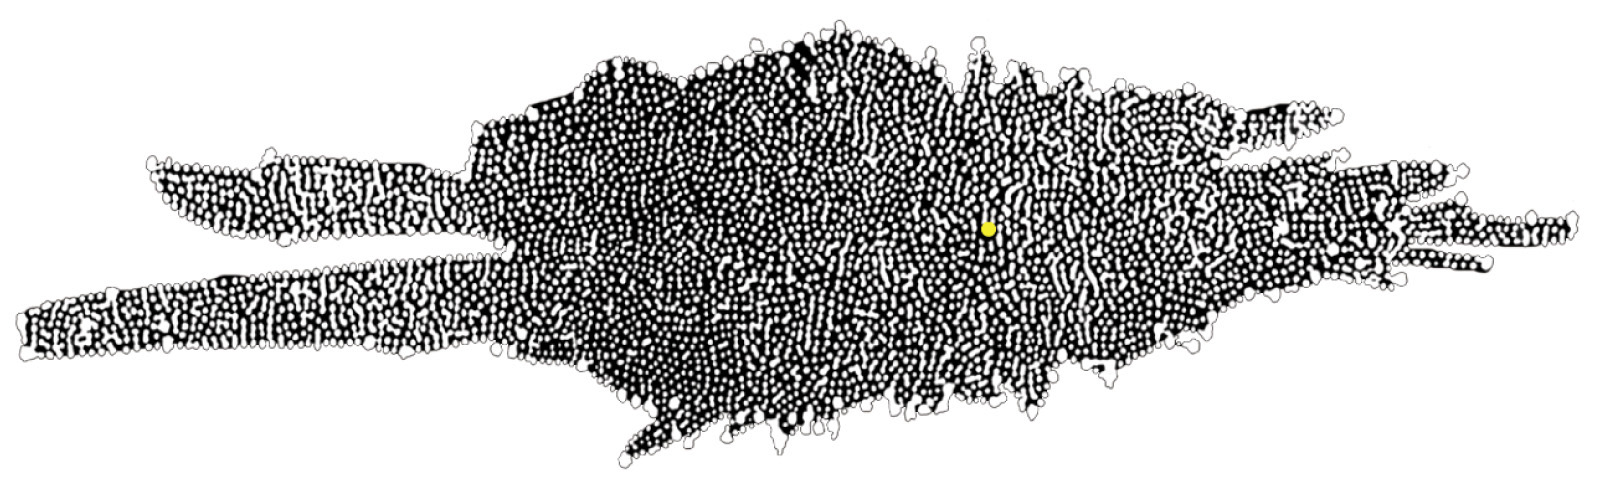
    Mar 8--dot hereschel

    For
    example, the map drawn by Sir William Herschel must have been a staggering
    thing to see when it was first published in the Philosophical Transactions of the Royal Society in 1785–at least
    by the popular viewer.  The enormity and
    expanse of galaxies was not yet understood, and to see (at this time) our own
    sun relegated to a point of sameness in what he deduced to be a spiral-shaped Milky
    Way Galaxy among many others could well have been an astonishing experience to
    a first-time viewer.

    So
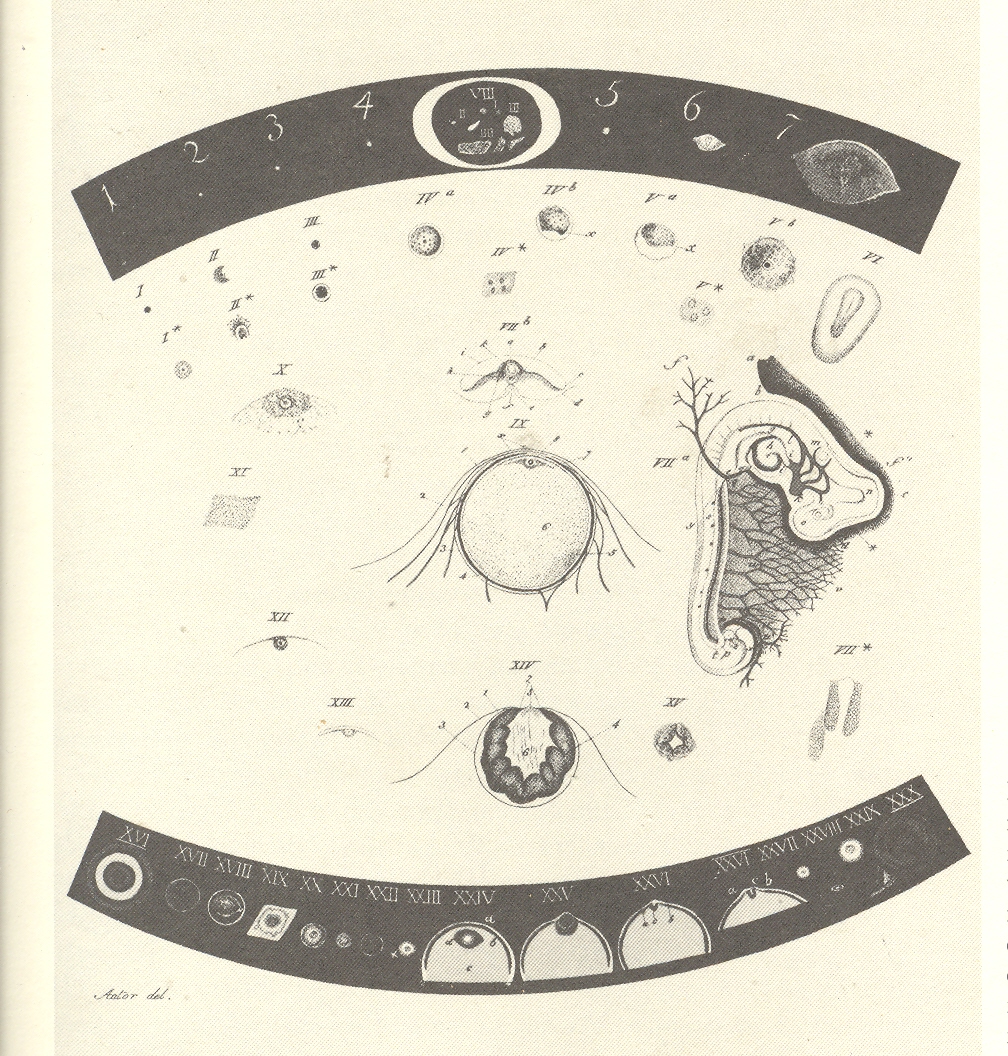
    to for at the other end of the spectrum with the embryological work of Karl
    Ernst von Baer (an Estonian educated in Germany
    who worked in St. Petersburg)
    as it was published in his De ovi
    mammalium et hominis genesi
    (1827). 

    Mar 8--med dots

    His work established beyond all doubt that the reproductive processes
    for all mammals were generally the same—or without fundamental difference—from other
    animals.  And since “mammals” included “man”,
    it came as quite a shock to the popular audience that the basic facets of
    reproduction were little changed between dominant predator and all the other
    stuff. At the professional level Baer’s work was of enormous importance in the development
    of cell theory which would lead to natural selection…and he also established embryology
    as a discipline. 

    And so the substance of dots at opposing ends of measurement, bringing about a similarity of recognition.  Dots.


  • Missing “Dots” and Not Seeing the Discovery of Platelets, 1842

    JF Ptak Science Books LLC  Post 918

    {This post continues some new and unusual cross-categories in this blog, like Missing Things Making Holes; Bombs as Breads.  Today’s bit combines the “Blank, Empty and Missing Things” with “The History of Dots” categories.]

     blog 13 donne703Alfred
    Donne (1801-1878), physician, experimenter, microscopist and
    photographer, is best known for things other than what he should
    probably be best known for:  his discovery of the third element of the
    blood, platelets.  Donne had a wonderful vision, and was among the very
    first on the scene to write about and employ the spectacular invention
    of the daguerreotype in chemistry and microscopy.  As a matter of fact,
    Donne, along with his collaborator Leon Foucault,  produced the very
    first engraved images of photomicrographs for his cytology paper of
    1840. (He was also the first to use electricity in producing a medical
    illustration, and was among the first modern physicians to write on the
    great efficacy of mothers using their own milk in breast feeding their
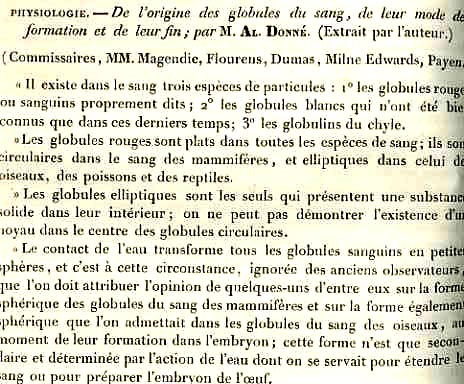
    children.)  The discovery of platelets paper of 18421–preceding two
    other works published in the same year–does indeed identify the new
    object, but actually fails to make a methodological examination of the
    new body, calling the new units “globulins du chyle” (or small globules, derived
    from plasma).  He also fails to make a drawing of what he saw; so, the
    combination of these two important elements asked the reader to accept
    his findings on faith, the tools of reproduction of his observations
    not being present. 

    And so we remember Donne for some other significant
    things, and less so for his lightly-interpreted and un-illustrated, and missing, “dots”.

    Notes
    1.Donne, Alfred. De l’origine des globules du sang, de leur mode de formation et de leur fin. Comptes rendus de l’Académie des Sciences, Paris, 1842, 14: 366-168. 

    (Overall the history of the
    discovery of platelets is complicated: 
    Leewenhoek (1675) and Henson (1782)  were the first to fully describe the “undefined”
    particles of the blood; Donne’s work was then more fully described by Beale in
    1850, and then again (identified as “small corpuscles” by Zimmerman in 1860 and
    then again by Schultze in 1874 and Laptschinski (also in 1874). William Osler
    then enters the scene in 1880, followed by Giulio Bizzozzero who was the
    first, in the years 1881 -1882, to establish central role of platelets
    not only in physiological haemostasis, but also in thrombosis.  Anyway it is a longish and not-clear-to-me
    history.)


  • A History of Dots, Periods & Points, Part I: Descartes and a Year-Ending Post

    I posted this at the end of last year, the end of my first year of blogging–I quite like it.  A nice way to end the year. Again. On dots.

    0 blog dec 31 descartes330To
     

    In closing out my first year of blogging, I’d like to take an incidental look at one of our language’s most important fragments.  Like Mr. Eliot’s observations of Baudelaire being a fragmentary Dante, and like the brilliantly arranged frammenti of Piranesi, the great bits of our communication processes owe a breathy thanks to the lowly period.  A dot.  A point.  It separates to provide analysis and coherent recognition of thought. 

    A simple dot.  (.)  But dots are as little or as big as you need:  there’s “Little Dot” (the cartoon character of Harvey Comics, created 1947, who was fascinated bylines and dots and dashes), “Admiral Dot”, polka dots, Mama Dots.  Dots get considerably ratcheted up in quantum dots, and then expanded beyond that with the idea of the dot as an abbreviation for the multiplication sign, both of which increase things rather than bringing them to an end, a conclusion.  The dot used after a musical note delineates that there is an increase in time by half, which would be an interesting notation to adopt in literature, if we were somehow able to magnify and increase that which would normally have been ended by the same notation.

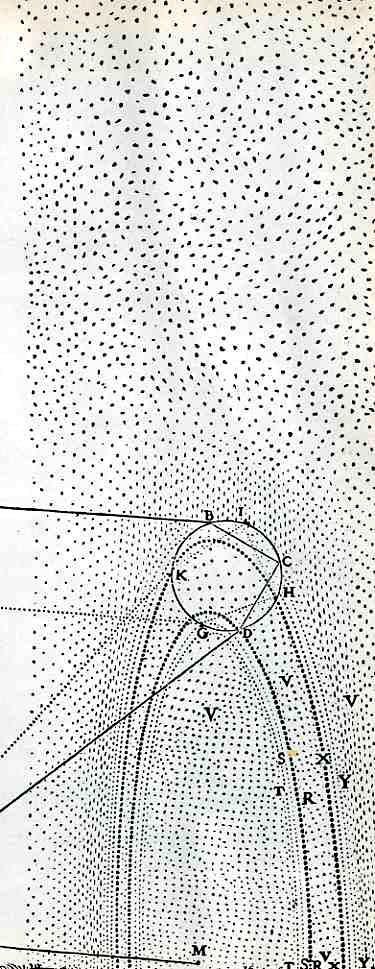
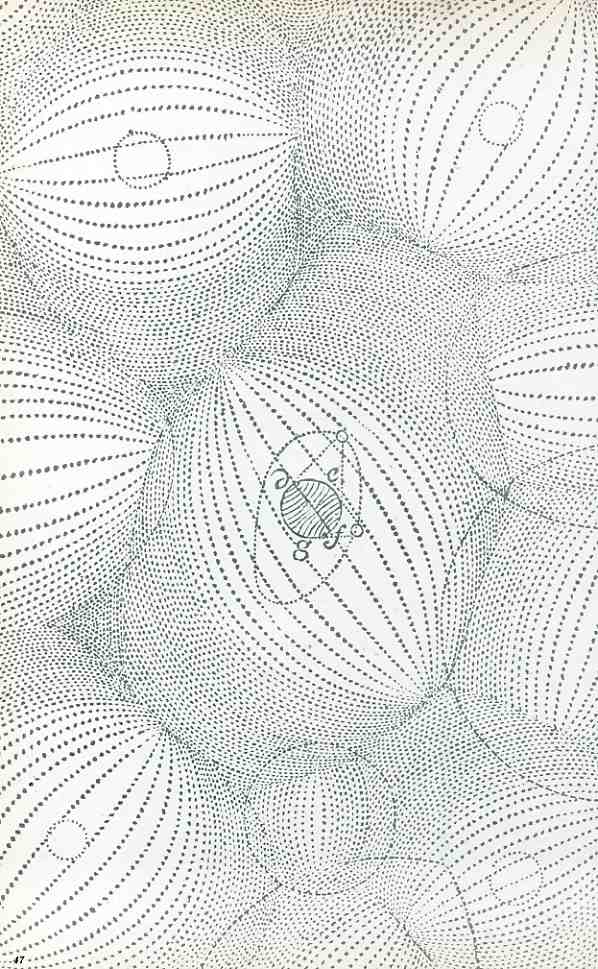
    Dots have formed the background to some of the most significant scientific illustrations of all time, like these two images, the first of which Descartes’ illustration of the decomposition of the rainbow, found in his Dioptrics, a fabulously important illustration. The second is from Descartes’ Principia Philosophiae (1684) which display his theory of vortices, accommodating an idea of physics eliminating atoms and vacuums and joining matter and space, matter being constantly deflected from moving in a straight line, moving in vortices.  Then of course there’s the fantastically appreciated advancement of Samuel Morse’s telegraphic instrument and his abbreviated transmitting alphabet (his “code”), which fascilitated the distribution of information in the 1840’s  in the same sort of way that the internet increased the flow and ease of data in the 1990’s. (Actually that’s only half correct for Morse, as his was a system of dots and dashes.)

    0 blog dec 31 descartes331

    Things get more interesting if we expand the idea of the “dot” to a “point”, as just about everything we have discussed in math for thousands of years has been based upon the idea of a “point in space”, forming the bits of the coat hanger on which the whole fabric of the heavens has been hung.  Going the other way, there’s the decimal point, which brings us to negative powers of ten, into smaller and smaller worlds, to the incomprehensibly small, showing that “nothing” probably doesn’t exist. (We’ll leave the idea of “spot” alone, tonight.)

    That’s quite a bit of expansion from a word that starts out life in Middle English as the definer of the head of a boil.

    But this year will end in about 50 minutes from now, and I wll be able to put the final keystroke to the final sentence to my final post of the year, and put it all to sleep.  And the year will end, at 11:59:59, precisely.  On the dot.

    ·Posted by :

    ·in:


  • History of Dots (Circle Subcategory): Circles in Graphical Displays of Quantitative Data

    JF Ptak Science Books  Post 889

    I like bumping circles as modes of graphically conveying quantitative data—it is more unusual than most ways of portraying statistics and belongs mostly in the 19th century. 

    Blog dec 27 graphic circle

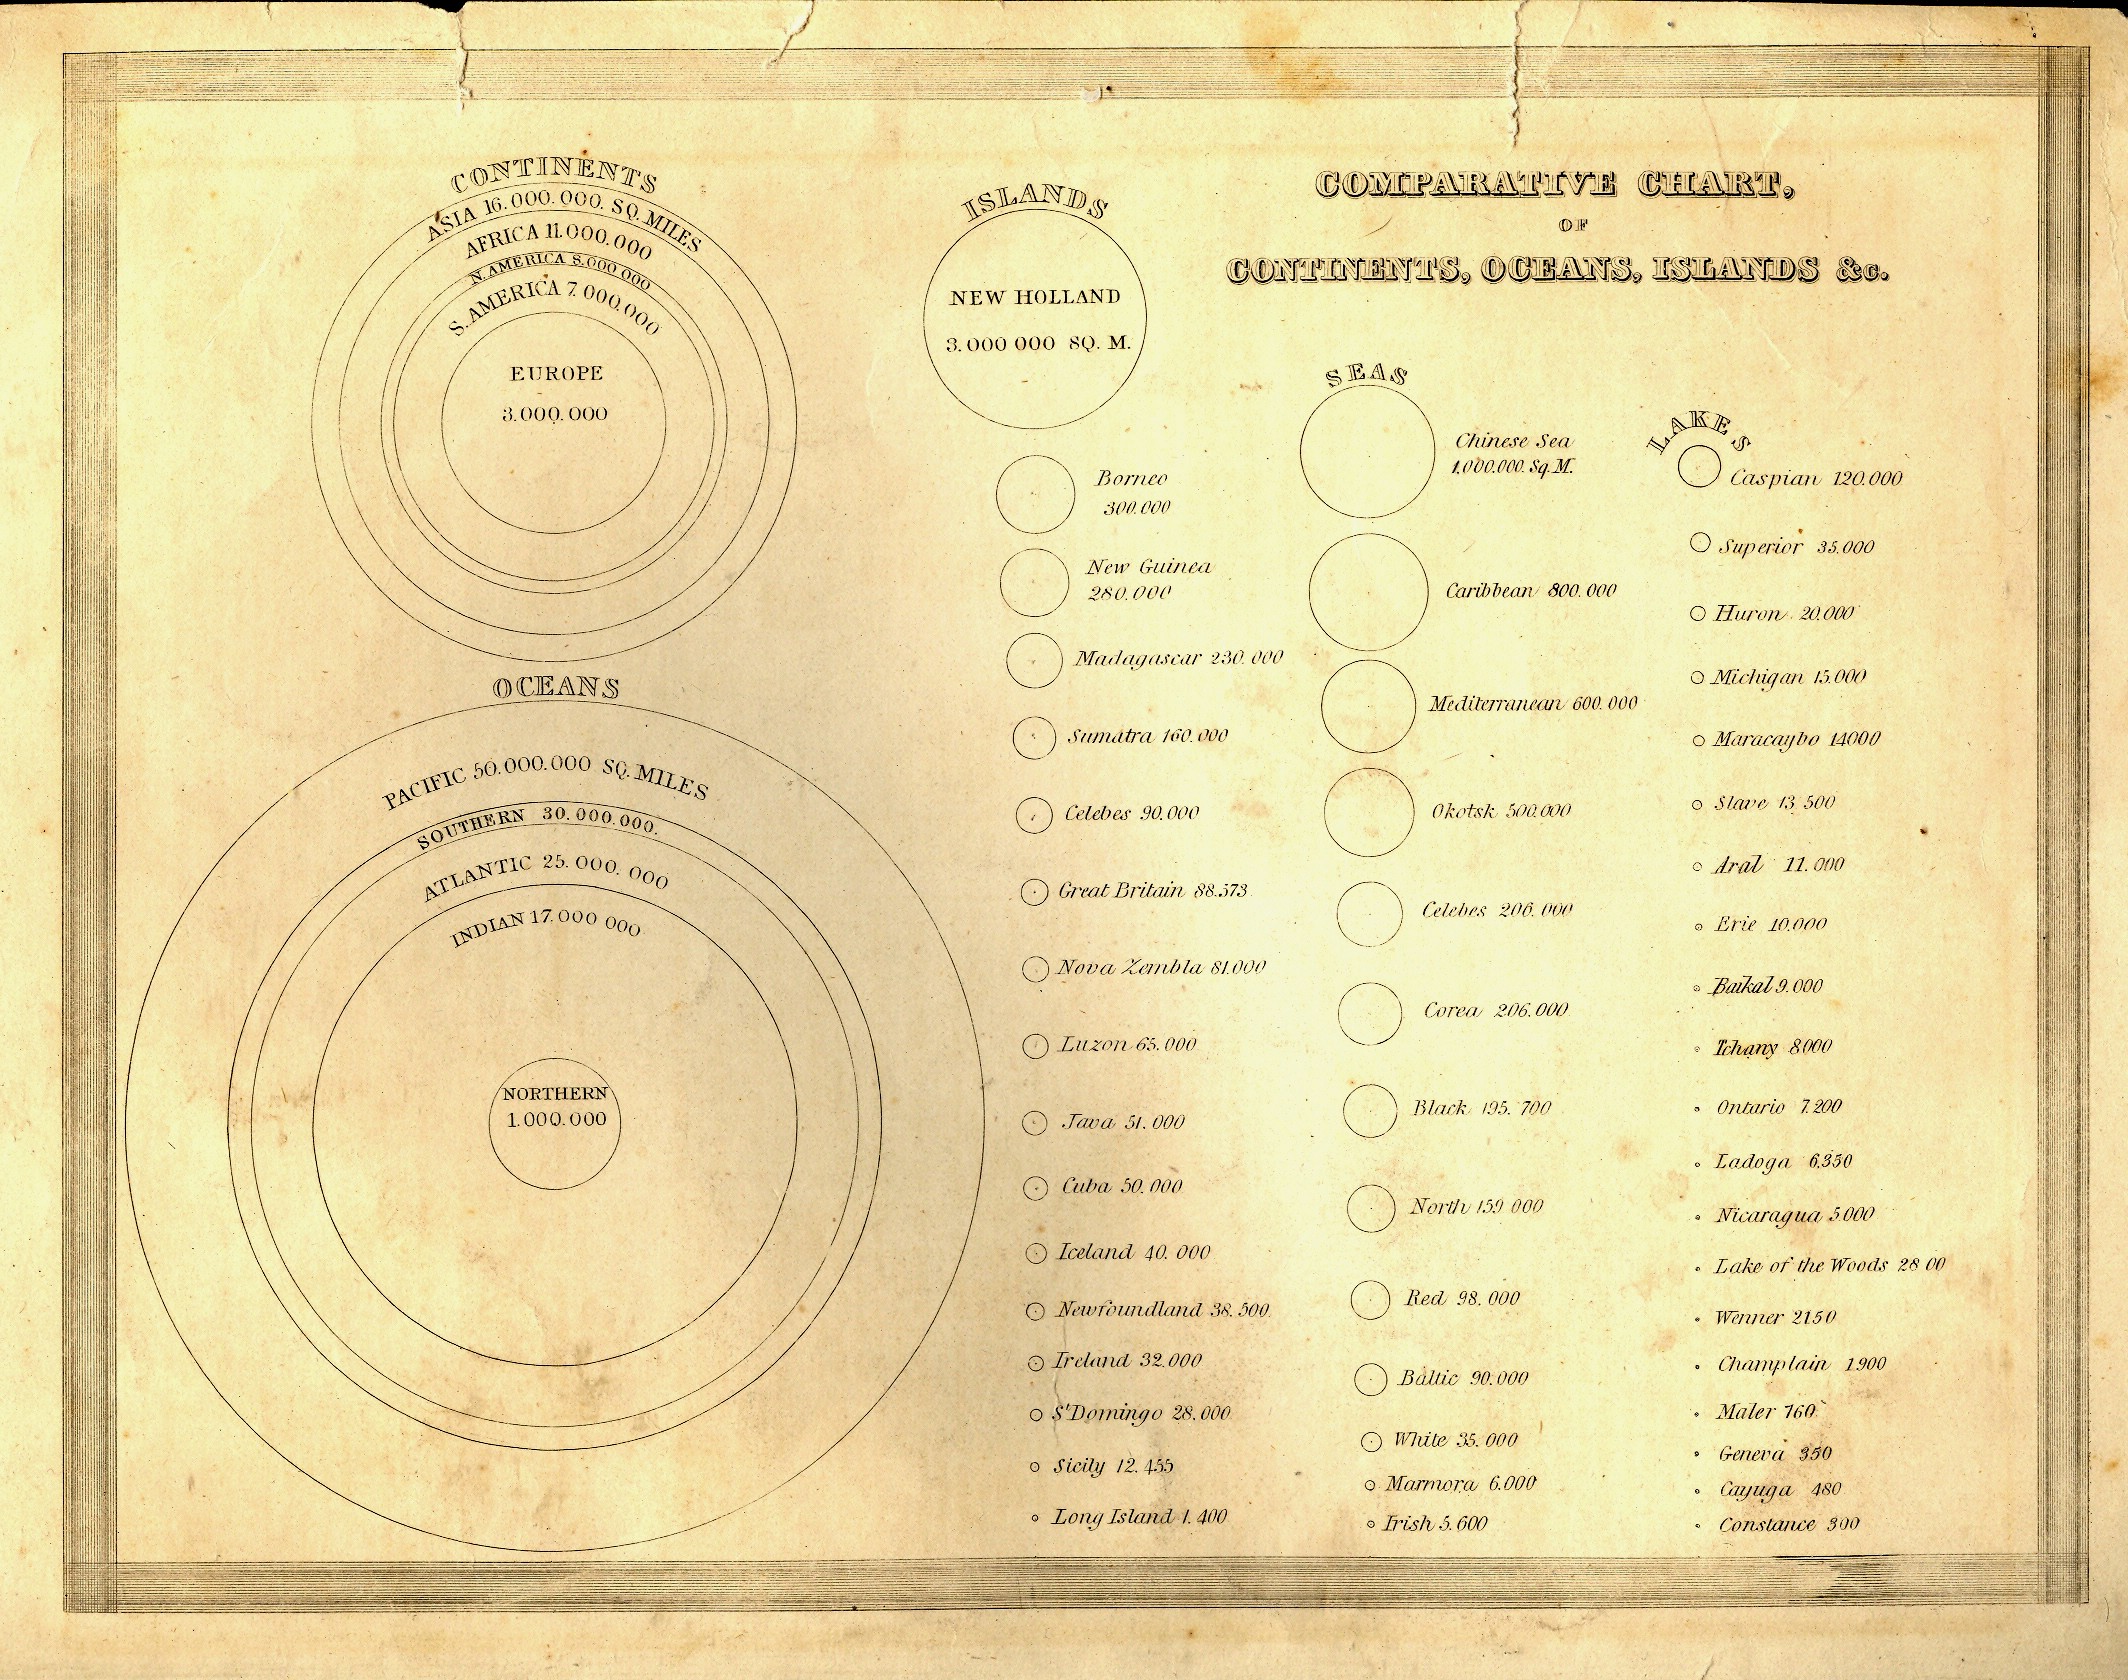
    The first example is relatively early, in the first class of this sort of information display, published in Thomas Bradford’s (1802-1887) superior Comprehensive Atlas Geographical, Historical and Commercial in Boston in 1835. Circles are the entire métier of this chart, showing the sizes of the continents and oceans, concentric circles nested inside each other, then branching out into three columns of progressively smaller circles showing the comparative sizes of islands, seas and lakes, all (interestingly) presented on
     the same scale.  It is a virtual one-stop, single-image display showing the graphical sizes of 59 geographical entities in relation to one another, making the understanding of their comparative sizes a simple, understandable, matter. 


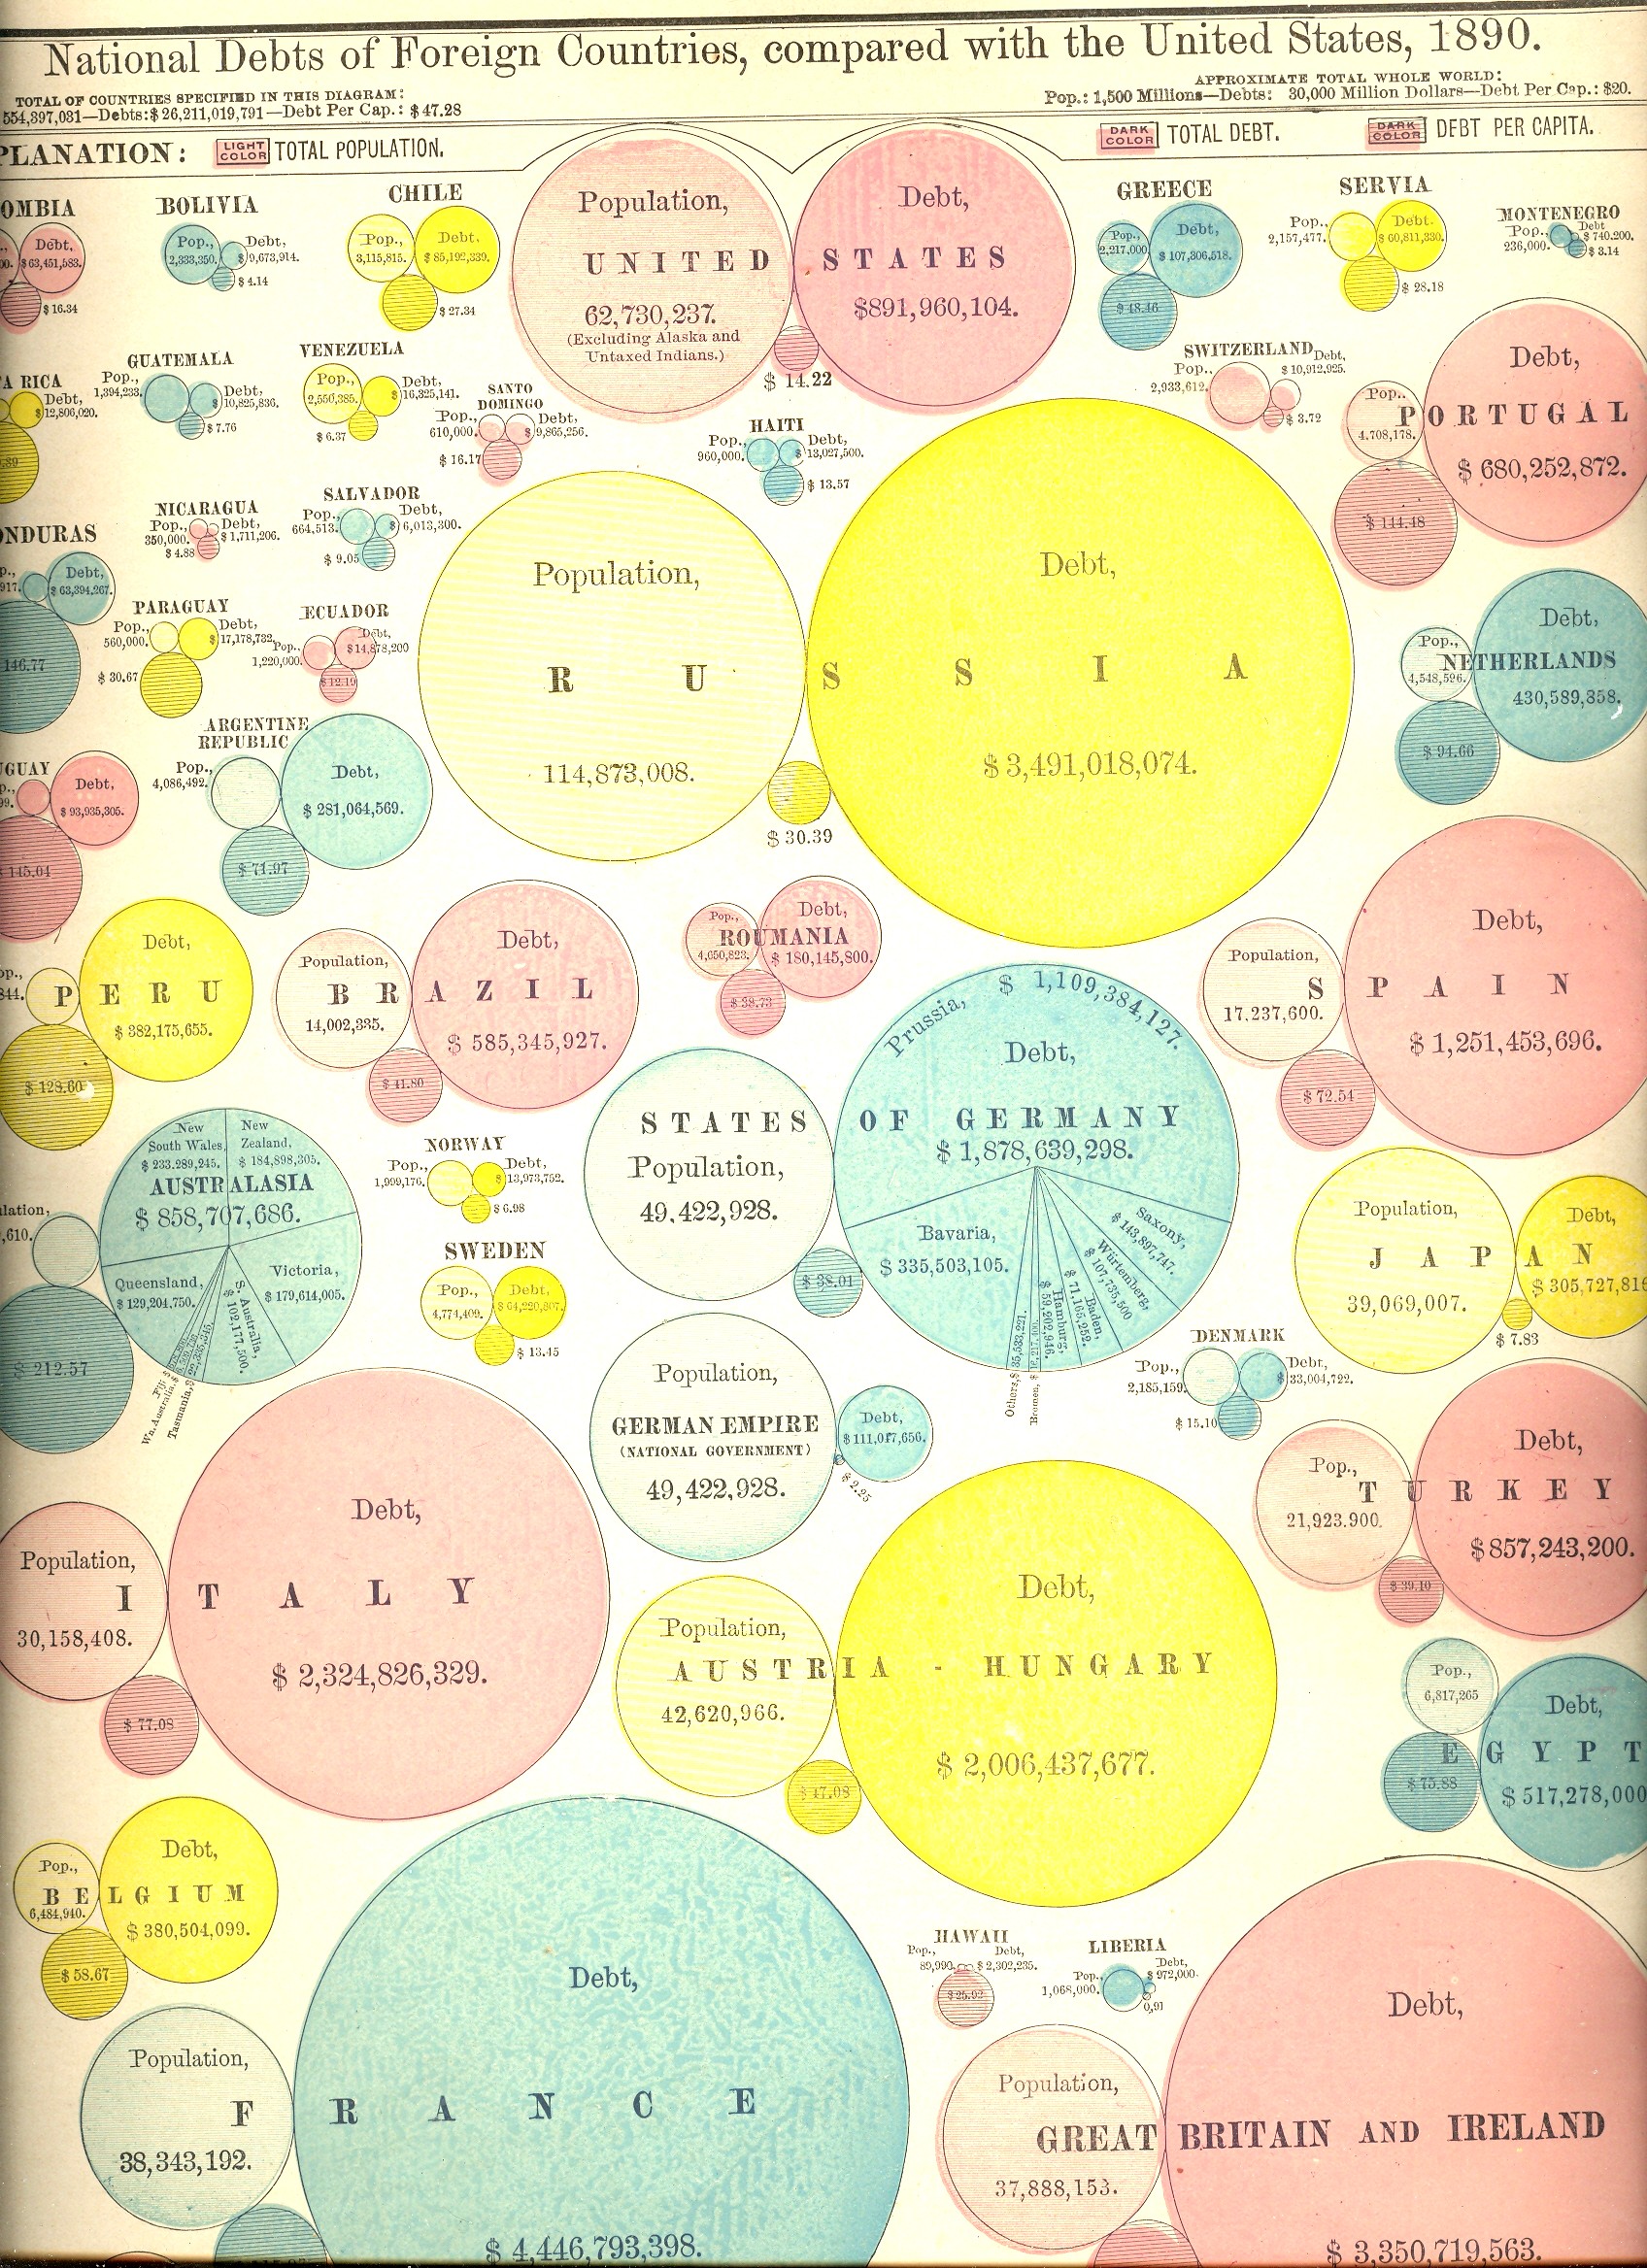
    Prettier but (initially) more difficult to use are the next two charts, the first showing the areas and populations of countries compared to that of the United States (in 1890), and the second showing the public debts of those same countries.  At first the display looks a little confusing. But once you settle in and get your eyes accustomed to the manner of presentation, the charts are actually very easy to use and very useful. 

    Moving over from circles to dots is this population map by Frère de Montizon Armand Joseph, Carte philosophique figurant la population de la France, published in 1830 (as the first of its kind).

    Blog dec 27 graphic bubble debt

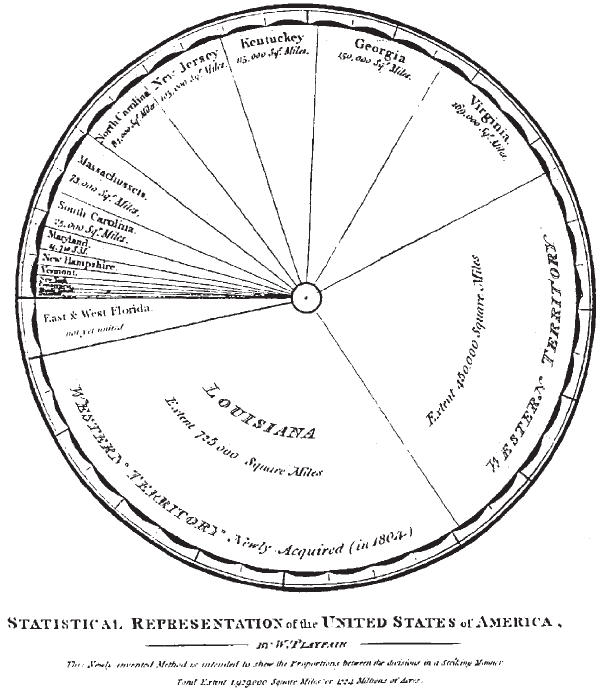
    The ubiquitous pie-chart only made its first appearance in 1801, the work of he gifted and possibly polymathic William Playfair.  He was an engineer (serving as apprentice to the inventor of the threshing machine, Andrew Meikle,  and personal assistant to James Watt) and economist, and occasional mathematician, who also invented  the line graph (1786),  bar chart (1801)and circlegraph(1801).  But for this and all of his other work, he died in poverty and not comfortable1.  


    NOTES

    1.Works by William Playfair include:

    • 1786. The Commercial and Political Atlas: Representing, by Means of Stained Copper-Plate Charts, the Progress of the Commerce, Revenues, Expenditure and Debts of England during the Whole of the Eighteenth Century.
    • 1801. Statistical Breviary; Shewing, on a Principle Entirely New, the Resources of Every State and Kingdom in Europe. London: Wallis.
    • 1805. A Statistical Account of the United States of America by D. F. Donnant. London: J. Whiting. William Playfair, Trans.
    • 1807. An Inquiry into the Permanent Causes of the Decline and Fall of Powerful and Wealthy Nations: Designed To Shew How The Prosperity Of The British Empire May Be Prolonged.


    Blog dec 27 playfair


  • Another Major Wrinkle in God’s Perfect Plan: Lots of Dots

    JF Ptak Science Books LLC  Post 826  Blog Bookstore

    ++ blog nov 8 dits

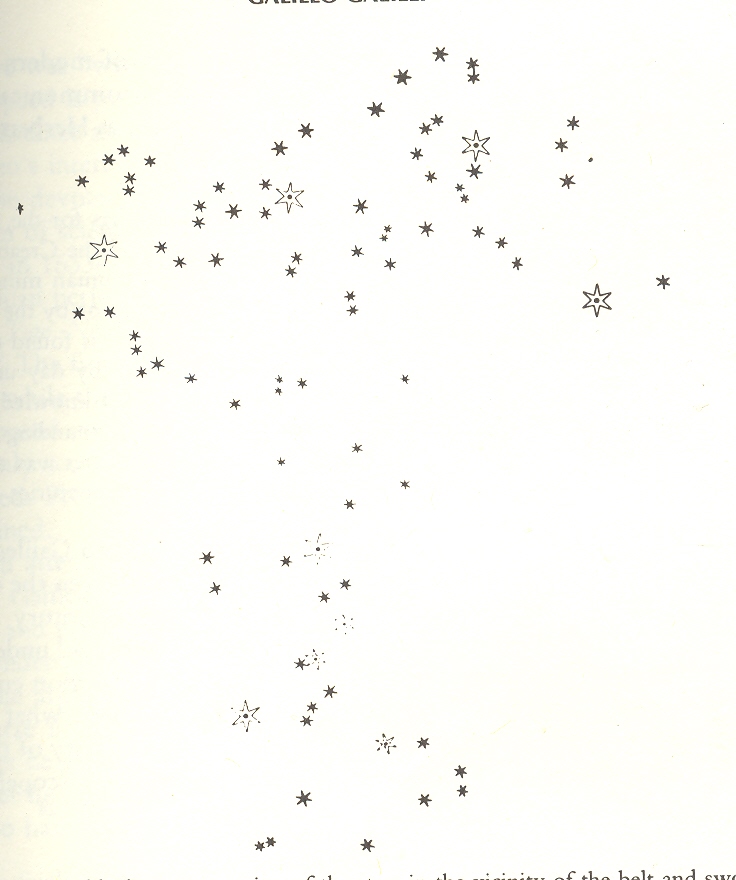
    This installment of the continuing thread on the  history of dots questions the sublime machinery of the primum mobile in the work of Galileo, particularly in his The Siderreal Messenger (Sidereus nuncius) of 1610.   The reception of this extraordinary work was deep and profound, and the images of the “dots” were of extraordinary importance.

    The perfection
    of the Creator’s plan was being shown to be not-so-perfect in the late Renaissance, a major chink
    showing up in the work of the dead Copernicus in 1543, which showed that the
    Earth was not the center of the great cosmological eye.  In the same year the body was also shown to
    be not so much built in god’s image with its bitter working revealed in one of
    the greatest anatomy books ever written,
    Vesalius’ revolutionary  De Humani Corporis Fabrica . 

    Problematic bits
    started showing up regularly wrapped in scientific proof:  the existence of a vacuum, thought to be
    impossible given the perfection of creation, was shown to exist in 
    Otto von Guericke’s  Experiemnta nova (ut vocantur) Magdeburgica de
    vacuo spatio
    (Amsterdam,
    1672).


     The
    stupendous idea of additions to the night sky, which had been thought to be
    immutable and unchanging, came into being with Tycho Brahe’s 1572 discovery of
    a new star (Nova) in Cassiopeia and added to in 1602 by Kepler’s announcement
    of another new star—both events showing that the night sky was not complete and
    that it was actually changing.

    When you
    consider Galileo and his use of the newly-invented telescope it is usually a little
    far down on the list of accomplishments that his explosion of the night sky is
    considered.  In addition to everything he
    did (
    applying mathematics to the study of physics, understanding
    the physics of motion, developing the telescope and the microscope and other
    precision physical instruments and so on) Galileo pointed the
    not-yet-astronomically-used telescope to the sky and expanded the size of the
    universe by a factor of ten.  It was so
    utterly astonishing an idea I can hardly think how the not-prepared mind of
    1610 would’ve reacted to the idea. 
    Certainly it was not a happy acknowledgment coming from the Holy
    Father, though a simple defense could’ve been that this miracle was divinely
    revealed ,and that it was there all of the time but just unknown to humans, and
    so not threatening the orthodoxy of Christian belief.  But that wasn’t the case, and Galileo would
    soon enough be in trouble with the church and its inquisition in short order.

    The dots in this image are the dots of never-before-seen stars, part of an
    unobserved sky that was revealed only under magnification.  The size and scope of the new bigness of the
    universe was staggering, and of course opened the question immediately to the
    possibilities of yet a larger universe revealed under yet more
    magnification.  I don’t know the answer to
    this, and I wonder where Galileo might have publicly mused about how big the
    universe might actually be, and if he ever dreamed about the possibilities of
    telescopes that were 15 feet across rather than just two inches, and what those
    beasts might reveal.

    *I’ve looked at the use of the telescope in the hands of
    Galileo before HERE
    (The Telescope
    in Galileo’s Hands: the Expansion of the Universe, 1610).


  • Dots in Revolutions of Modern Art: Seurat & Kandinsky

    JF Ptak Science Books LLC  Post 683  Blog Bookstore

    Part of the History of Dots series

    It is interesting to think of the importance of dots in the first revolutionary changes in 500 years in the history of art.  Honestly, there wasn’t anything epochal that happened between the re-discovery of perspective (ca. 1330-1400) and the arrival of Impressionism (and just afterwards of non-representational art) in the 1872/3/4-1915 period.  

    Suerat Dots aren’t brought to bear formally in the revolutionary movement until the early 1880’s.  Impressionism for all intents and purposes is formed with the Societe Anonyme in 1872 (whose members included Monet, Pissarro, Degas, Sisley, Morisot and eleven others), and perhaps more realistically in 1874 when the Societe exhibited its first salon.  (The first show held at the Nadar Studio in Paris in April 1874; a tiny, one month long affair, compared to mammoth exhibitions like the Universal Exposition in Paris in 1867.) 

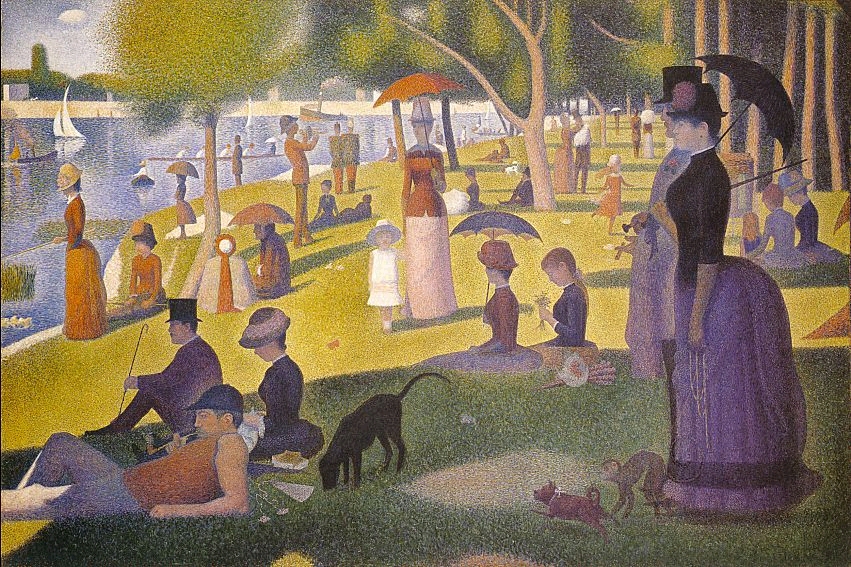
    It was Georges Seurat who brought the whole world to the dot experience with his artisitc method of Pointilism, in particular with his magnificent Un dimanche après-midi à l’Île de la Grande Jatte, an enormous work given its composition—dots.  The dots replaced the brushstroke, and their placement in relation to their color was an absolutely brilliant innovation, establishing a perfect result for the viewer when examining the work as a whole.  (It may well be that the French chemist an designer Michel Chevreul made this discovery a few decades earlier, noticing the effect and changes in color depending on placement and—in his case, with fabric—color in the dyes for his material.)

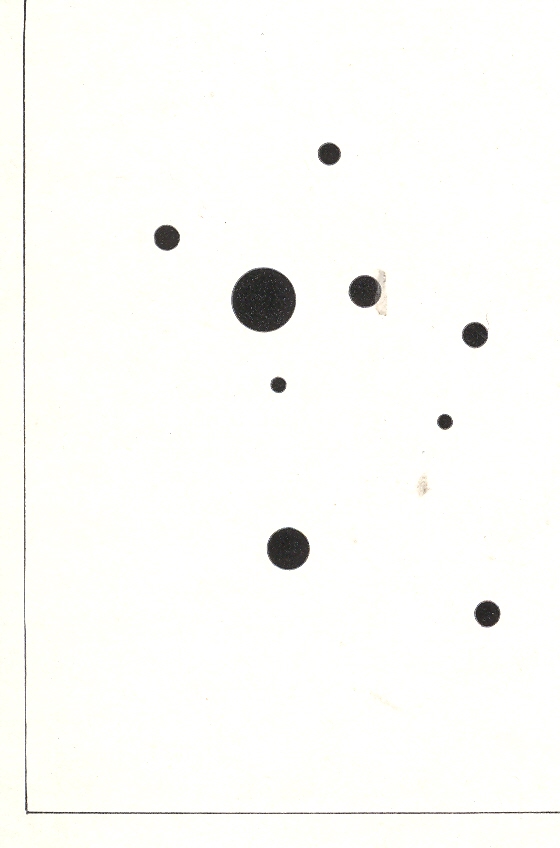
    Wassily Kandinsky (1866-1944), the discoverer of nothingness in art and the introduction of the first BLOG==july 13=kamd non-representational paintings in art history (1913) used his fair share of dots in his exploration of the previously invisible.  One good example is his 9 Points in Ascendance (1918), which is nothing but black dots, an impossible composition just two decades prior to its creation. 

    In the middle of this appeared the half-tone illustration, the great liberator of photographic illustration in popular publication.  Invented in the late 1870’s by Stephen Henry Horgan and used in the Illustrated London News for the first time in 1881, it made the publication of accurate images much feasible and economical.  No longer were readers dependent on the accuracies of artists interpreting photographs or photographed scenes—the photographs themselves were now publishable at little cost and in high quality, vastly increasing the veracity of published reports dependent upon images.  This was revolutionary in its own way, democratizing the sharing of images and icons.

    And so in just thirty years the lowly dot availed itself of some of the most spectacular achievements in modernism.  Of course we can say the same of the line, but this is, after all, a history of dots. 

    ·Posted by :

    ·in:

    — —

  • Telegraph “Fax”, 1895. Transmitting Images by Wire & 120-Year-Old Emoticons

    JF Ptak Science Books  Post 701     Blog Bookstore

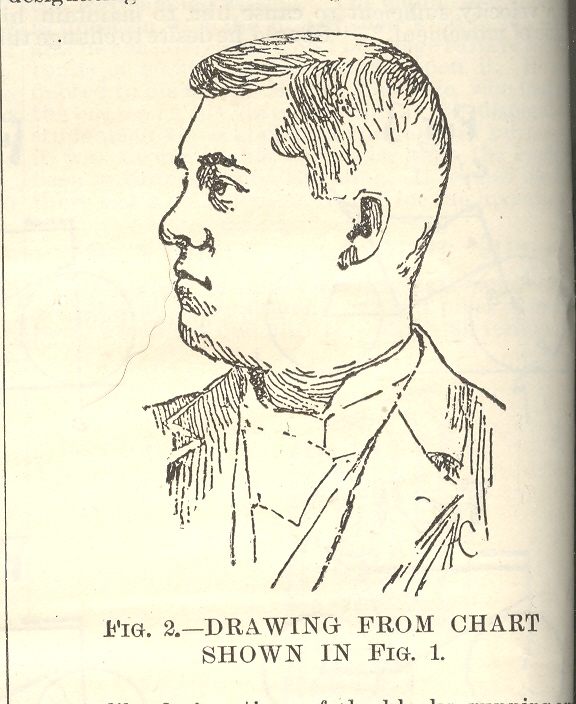
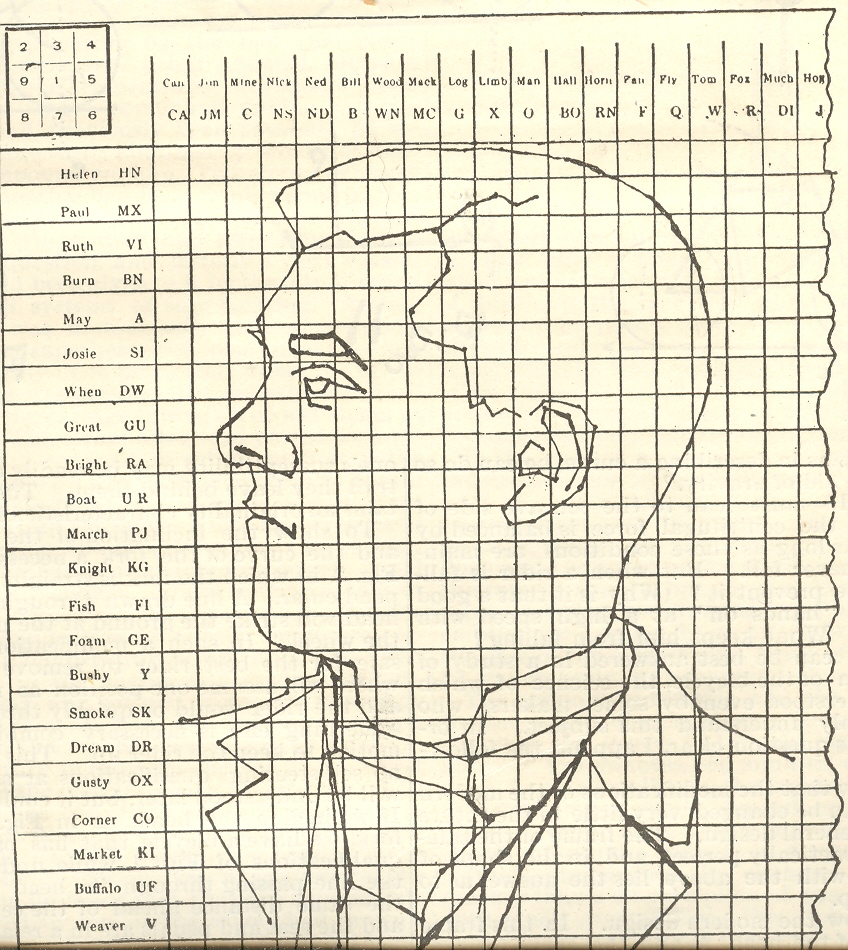
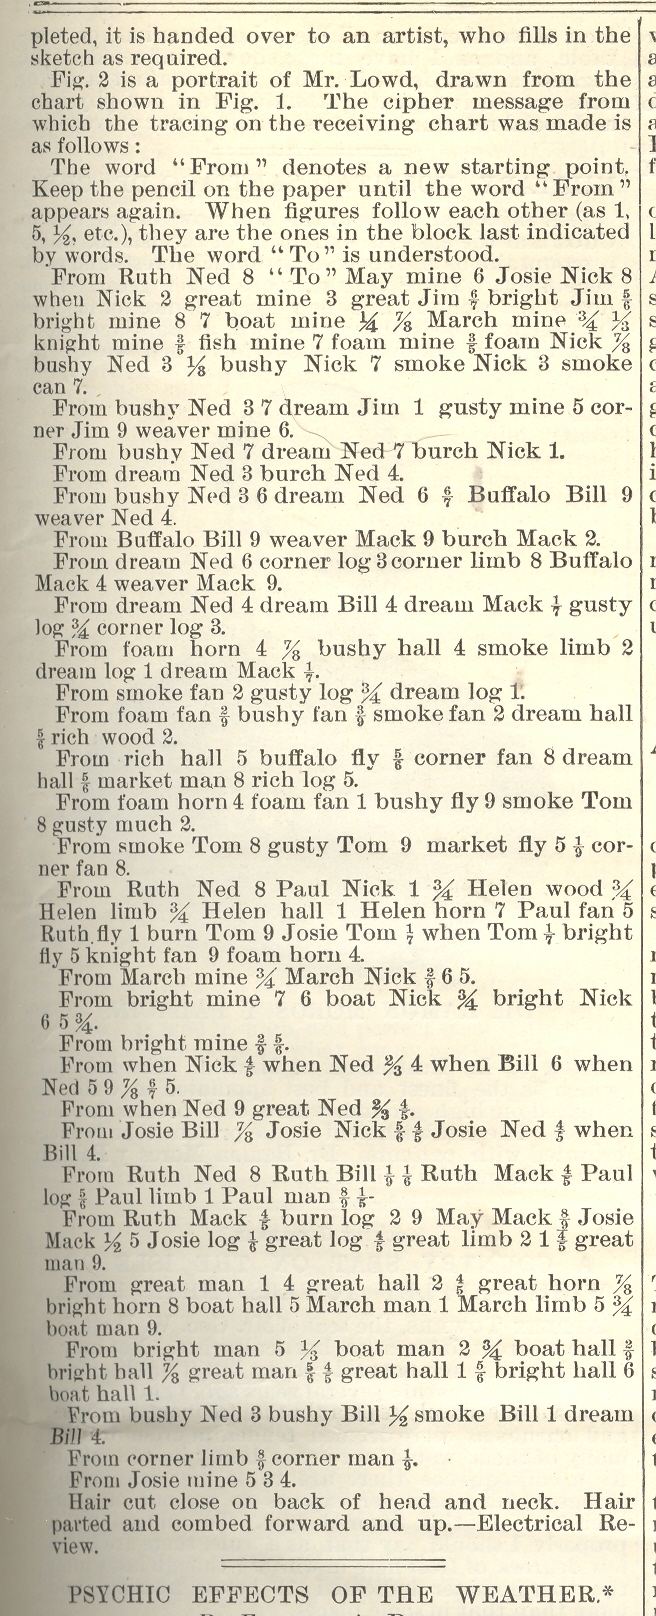
    ==Blog July 28=tele port 1This Scientific American article on the smart/odd/analog transmission of pictures via telegraph (14 September 1895) by W.H. Lowd, can make you say “ohhh, of course” out loud.  Mr. Lowd’s insight came fifty years after the Morse telegraph came into being, thirty years after it becomes the greatest means of communication, twenty after the first multiplex telegraph, and in the same year as Marconi’s first successful wireless transmission.   It was though an ingenious inspiration whose utility lasted for about 60 seconds—which is about how long it took to develop a smarter way of transmitting an image in its entirety.

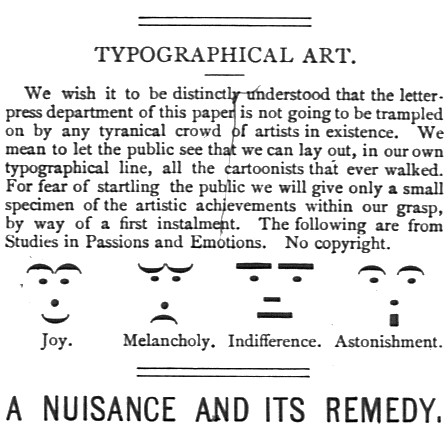
    Mr. Lowd recognized that he could transmit the outline of a picture by placing on opaque tracing of the picture on top of a telegraphic ciphering sheet and then transmitting the coordinates, which when received on the other end could be connected by short lines into the picture that was being transmitted from the sending end. ==Blog July 28=tele port 2 Images constructed of numbers and letters and such had been made for centuries before this; this however is a very early use of this idea that was employed to human-representational transmit the object electrically over distances by wire.  Emoticons—a more abstract version of this idea–such as we know them today are actually better than 150 years old.  They appear as early as 1857 in the telegraphers’ world, and somewhat earlier in the typesetter’s arsenal. (For example, a later attempt, taken from Puck Magazine No. 212, page 65, 30 March 1881, shows us something that we took to be “new” in the 1980’s as having roots that spread downwards into history by another 120 years.)

    ==blog==july 29=Puck

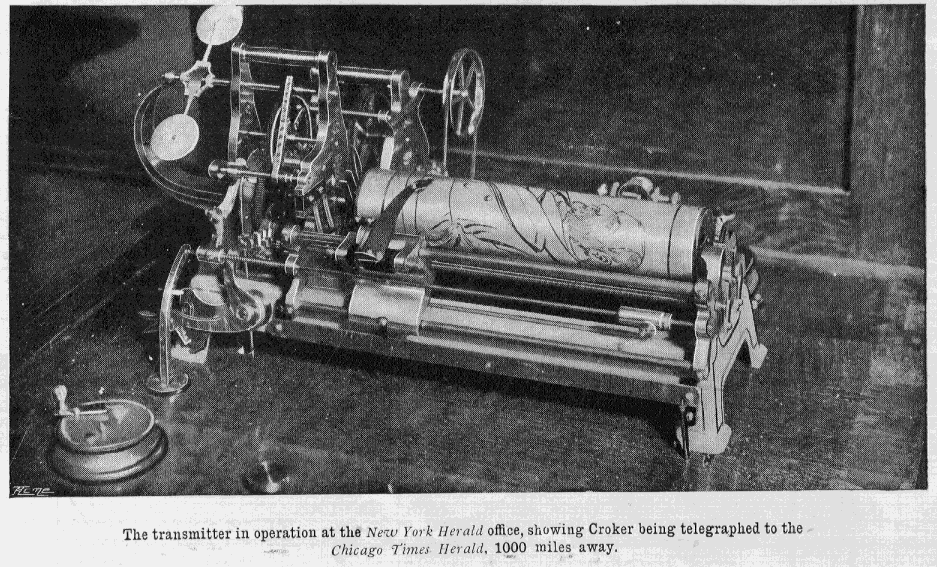
    But Mr. Loud’s idea was pretty, I must admit, even though it was far from being the answer to the question it addressed, with a more pleasing, technology-based solution appearing by 1899. 

    (A successful apparatus for the true transmission of an image by wire is seen here, below, and was produced in 1899/1900.) ==blog==july 28==pics by wire

    The other bit that is interesting is that this transmission of an image necessitated an early Surrealist-like poem, dictated by the cipher/codes that were use by necessity to send the picture. 

    ==Blog July 28=tele port 3


  • A History of Dots: the Black Sun of Das Planeten Buch, 1541

    JF Ptak Science Books LLC  Post 694  Blog  Bookstore

    History of Dots, Part 15

    Soft on the Heals ==Blog July 21=dotsof
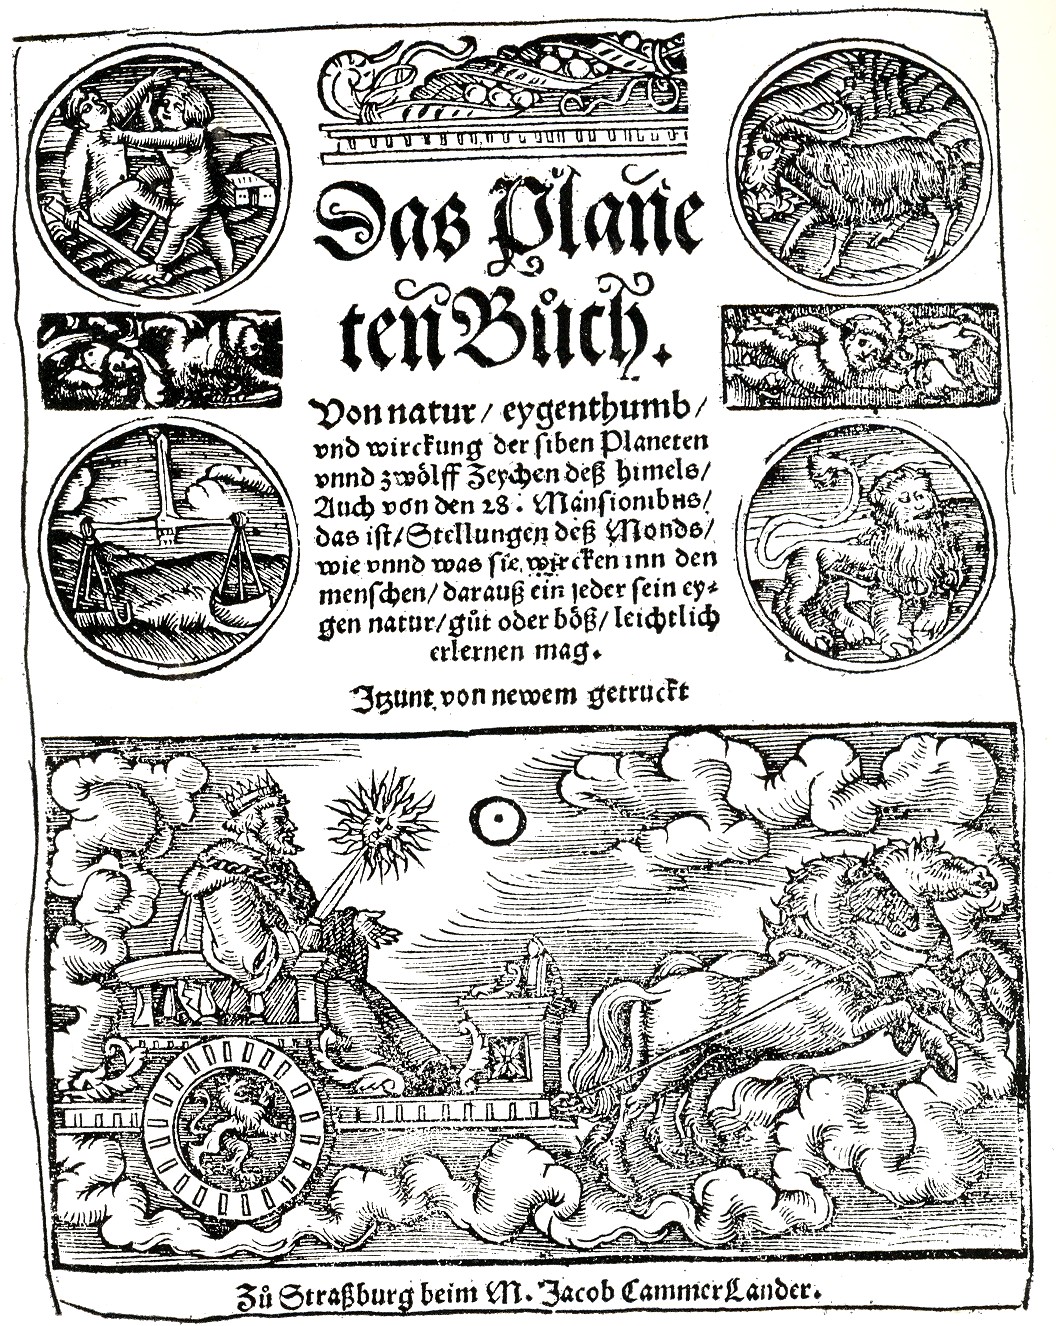
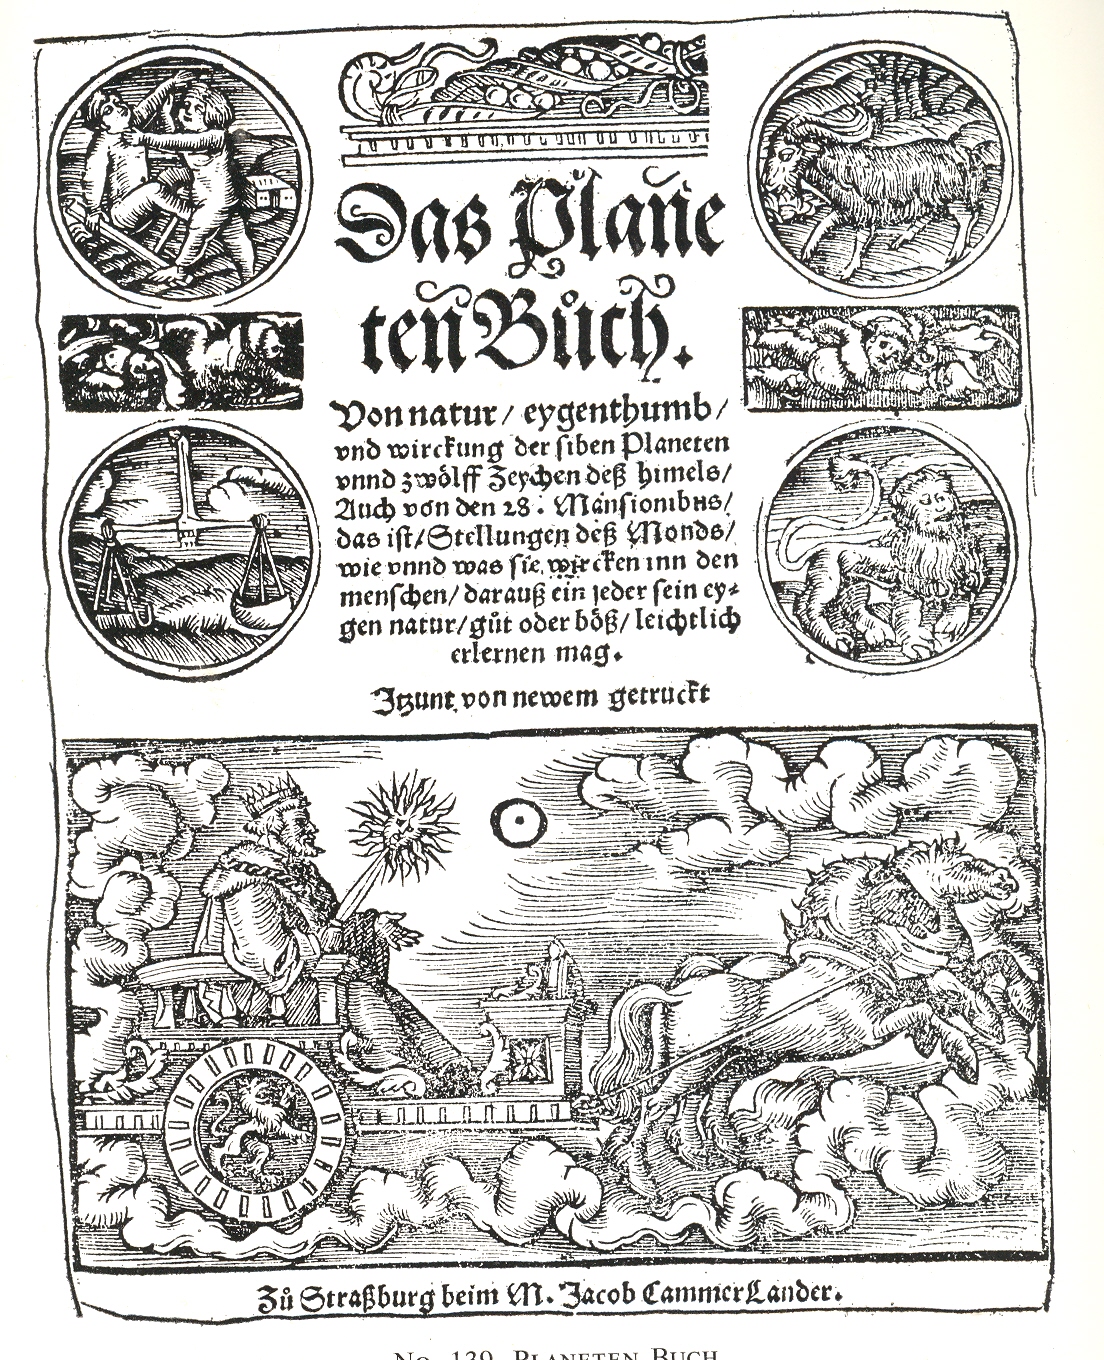
    the 1898 Planetary Visits post (earlier today) is this 1541 Books of the Planets (Das Planeten Buch.
    Von Natur, ey
    genthumb, und wirckung der siben Planeten…), which was published
    in Strassburg by Jacob Cammerkander..  It
    is a collection of medieval German accumulated astro-data and posie, cobbled
    together by an anonymous author, and strung together for the masses—it was
    evidently very popular, eager fingers pulling the many editions to pieces (and such), so that very few now exist. 

    The dot that I have in mind here is the standard astronomical depiction of the sun, and it appears brilliantly-n-black in the bottom panel close-by the image of Saturn racing across the sky.