A Daily History of Holes, Dots, Lines, Science, History, Math, Physics, Art, the Unintentional Absurd, Architecture, Maps, Data Visualization, Blank and Missing Things, and so on. |1.6 million words, 7500 images, 4.9 million hits| Press & appearances in The Times, Le Figaro, Mensa, The Economist, The Guardian, Discovery News, Slate, Le Monde, Sci American Blogs, Le Pont, and many other places… 5000+ total posts since 2008.
This entry is a simple exhibit of French postcards from the edge–of the near-future. The future that they spoke to wasn’t all that far away standards of change in the history of history–they called out to a history 85 years away from 1900, 85 years to the great beginning of where the future would take new and entirely different steps up from Victorian discovery and breakthroughs. There are some novel intuitions, including electrically-induced knowledge, production-line robotics, and television, but overall the thinking being done and displayed on these postcards wasn’t very edgy.
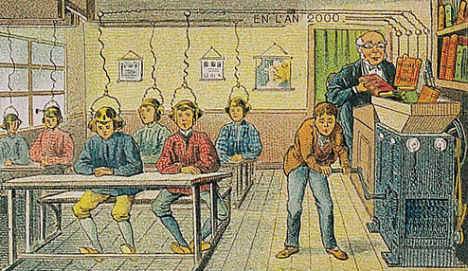
Electricity, perhaps the defining improvement of the 19th century, would still be a main source of power and energy, though with new and incredible products. For example , the classroom in the year 2000 would distill information directly into the minds of students by some sort of electrically-based information crunching apparatus, which would evidently grind the good stuff from the pages of books and be electrically implanted directly into the brain. Why the machine was manually operated is a mystery.
Artificial or synthetic food–or food, at least, as we do not recognize it now, here being consumed like vitamins. Even though the food-ness of food is gone, the social ambition of replacing spent energy resources has not changed, the coming-together at the dining table remaining intact as a practice even without the demand of the time it once took to actually eat food. [Image source and notes, below.]
“… Living only for the moment, turning our full attention to the pleasures of the moon, the snow, the cherry blossoms and the maple leaves; singing songs, drinking wine, diverting ourselves in just floating, floating; … refusing to be disheartened, like a gourd floating along with the river current: this is what we call the floating world..”.–Asai Ryōi, in his Ukiyo monogatari“Tales of the Floating World”, c. 1661
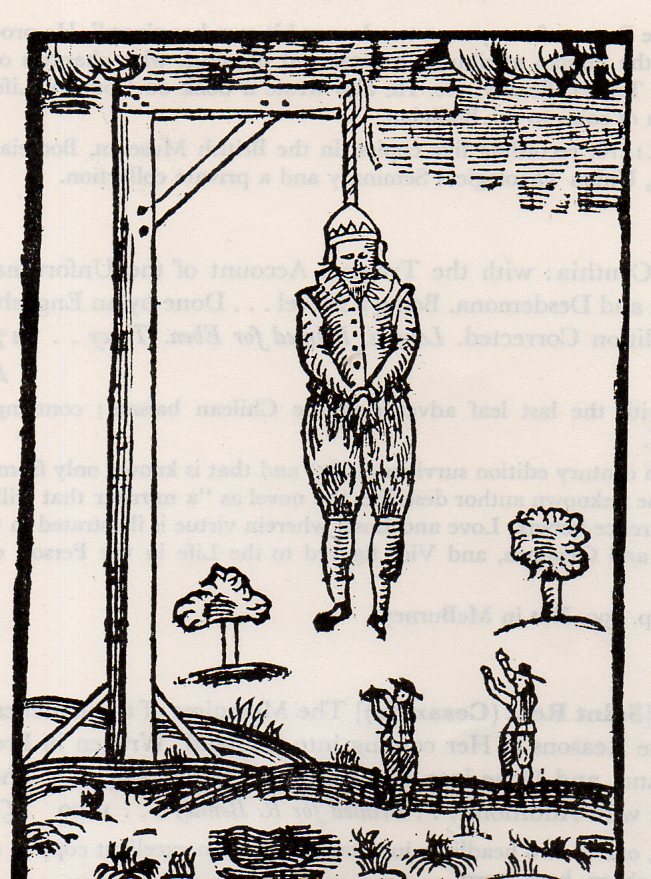
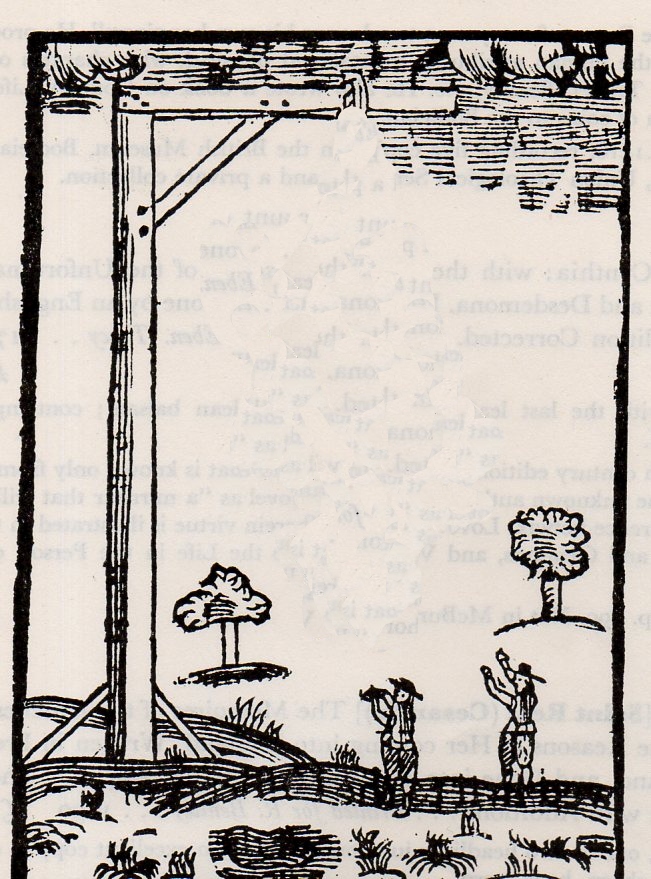
Unfortunately I have lost (!) the reference for this image, but my guess is that it is definitely English and that it comes at the times of the Civil War(s) of 1642-1651. This image below shows the hanging of some poor fellow–and though it seems to be a crown (?) that the man is wearing I can’t imagine who the royal person would be do be executed in such a manner. It seems to me that the mode of execution was beheading (as with Charles I) and also by firing squad, and I just don’t know who was hanged. In any event, I’m after the weird, removal bits from the image more than what it says to us from history. And the out-of-context item hjere of course are the “floating” trees:
JF Ptak Science Books Post 1644 [Part of the Series on the History of Blank, Empty and Missing Things.]
“Other maps are such shapes, with their islands and capes! But we’ve got our brave Captain to thank” (So the crew would protest) “that he’s bought us the best- A perfect and absolute blank!”–Lewis Carroll, The Hunting of the Snark.
[This post fits perfectly in our History of Blank, Empty and Missing Things. Ditto for the series on The History of Lines–making this a great confluence for a History of Blank and Missing Lines (in the History of Nothing series).]
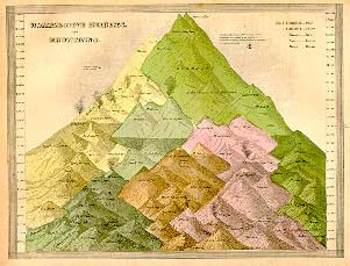
For all of the brilliance of all of the cartographers and map makers who have drawn a line in the sand or strung a strand of quipi or drawn a celestial rendering on a cave wall or imagined the Americas in 1504 or ventured out and away from the Medieval T-maps or drew maps of other worlds or fashioned spiraling maps of Hell, I think the maps I most like are maps of imagined places. Of course I enjoy the extremely rigorous and steadfast maps (like those of the German Stieler Company of Gotha who for a hundred years routinely drew the most detailed maps in a particular scale than any other mapmakers in creation—you know, the big maps of the U.S. that would locate minute places like Truman Capote’s “out there” town of Holcomb, Kansas) and of course maps of the solar system and galaxy and universe (as knowledge expanded and collapsed and expanded again). And of course there are the representational maps showing the comparative heights
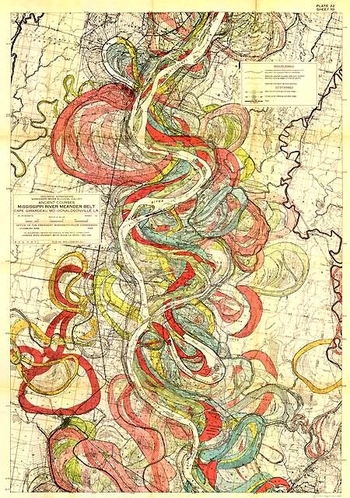
of mountains and lengths of rivers, or the grouping of all the world’s lakes, or the divorce rate map of the United States at Centennial, or the heights at which different sorts of trees are found, or geological speculations on the thrust of the Appalachian chain, or the wanderings of the course of the Mississippi River (below), and other hosts of things.
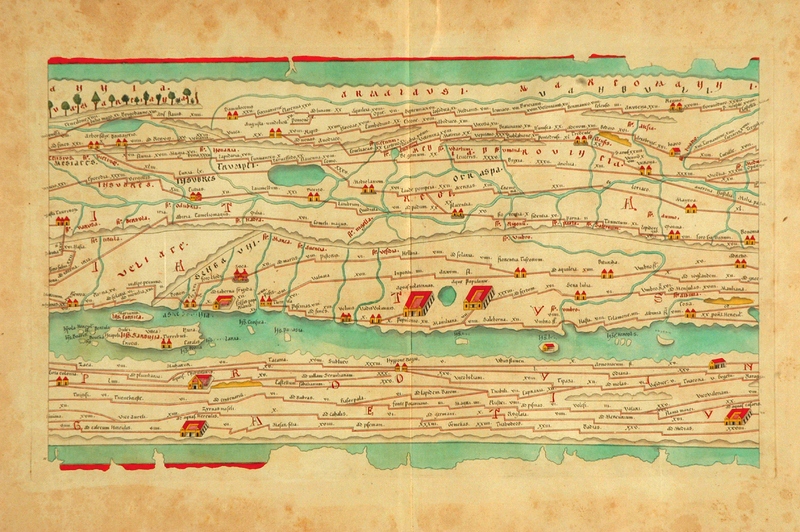
As much as detail is attractive to me—complex, staggering information correctly displayed—there is also the opposite: the quick, thoughtful, spare map. The Tabula Peutingeriana is sort of like that—this is a 17th century reproduction of an ancient Roman map that was, basically, a road map of the world (or the Roman World) that was linear and included all manner of detail of the roads themselves, with little else. It is a spectacular thing—one version I had once was 14 inches high and 16 feet long, just a skinny map of how to get around in the world from 2000 years ago. There was of course nothing “quick” about how the map was made, coming at the expense of countless hours of careful observation, keen observation, and lots of general human tragedy.
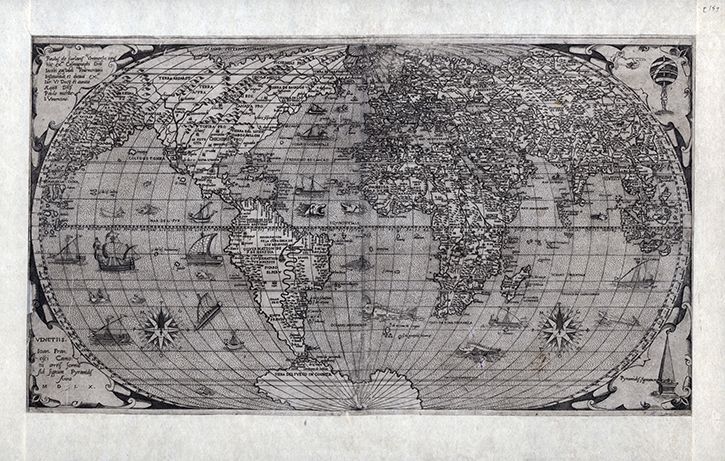
Folrani’s world map of (ca.) 1575 (which appeared in Antoine Lafrery’s (1512–1577) Geografia tavole moderne di geographia) is a glorious thing and a fantastic accomplishment for its time (and also being the first map to use the name “Canada”). It has a sumptuous artistry to it in addition to including (and excluding) certain of the newly known discoveries. In this version of the map he chose to not use the newly-incorporated Straits of Ainan
[I’m sorry to say that I’ve misplaced the original source for this map–I will try and supply. My apologies.]
In another edition of the m-which appeared a few years later–North America is still attached to Asia, but now there is added another bit, a gigantic land mass to the south, Terra Incognita. This was basically put together by some sightings in the southern seas that located different land masses, and Forlani took it upon himself to connect all of those pieces of information and draw them into one continuous land mass, greatly expanding his own version of Antarctica from a few years earlier. It is a wonderful example of leaving something(big) out and making something else (even bigger) up.
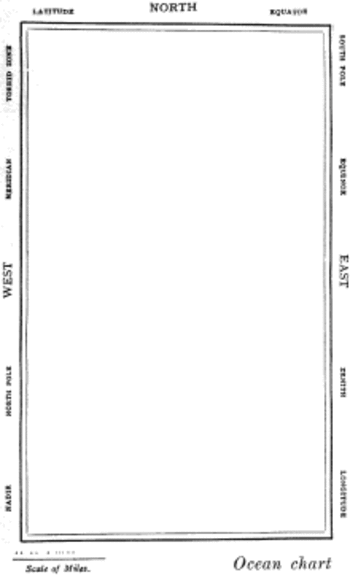
But the map that I think I love the most illustrates Lewis Carroll’s The Hunting of the Snark, an Agony in Eight Fits, and occurs in the Bellman’s tale, starting the second fit. It begins:
The Bellman himself they all praised to the skies- Such a carriage, such ease and such grace! Such solemnity too! One could see he was wise, The moment one look in his face!
He had bought a large map representing the sea, Without the least vestige of land: And the crew were much pleased when the found it to be A map they could all understand.
“What’s the good of Mercator’s North Poles and Equators, Tropics, Zones, and Meridian Lines?” So the Bellman would cry: and the crew would reply, “They are merely conventional signs!
“Other maps are such shapes, with their islands and capes! But we’ve got our brave Captain to thank” (So the crew would protest) “that he’s bought us the best- A perfect and absolute blank!”
Sometimes there is nothing so fine as something that beautifully illustrates the nothing that isn’t there, and this lovely map, unencumbered of all of the elements and details that define the mapness of something, perfectly explains the origin of its need.
For a lovely work on the complexities and simplicities and just sheer beauty of what things like maps are check out former Ashevillean Peter Turchi’s Maps of the Imagination, the Writer as Cartographer.
[Part of the Atomic and Nuclear Weapons series and the History of Blank, Empty and Missing Things series.]
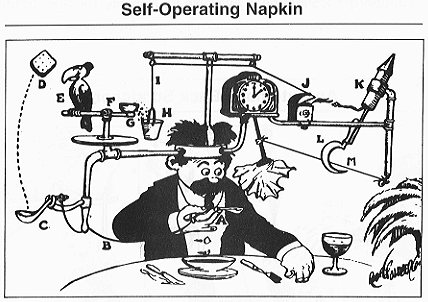
I think no plumb line was ever so worked with pulleys and wheels, strings and catclaws and other Rube Goldberg devices as were the demographic studies of nuclear warfare.It is as though their compass rose had no compass, with everything centered on the center, no way out, no way in: just there.A faceless clock face describing “G-2 o’clock” whenever it pleased.These studies seem to me the nuclear warfare equivalent of the Bellman’s map (described earlier in this blog as the most perfect map ever constructed): a pretty polygon describing a totally blank surface.
I have a number of these things here, some of which are restricted-distribution publications, works of statistical fancy/fantasy meant for other eyes in the same community dedicated to the fancies described, a tautological audience for self-referential.
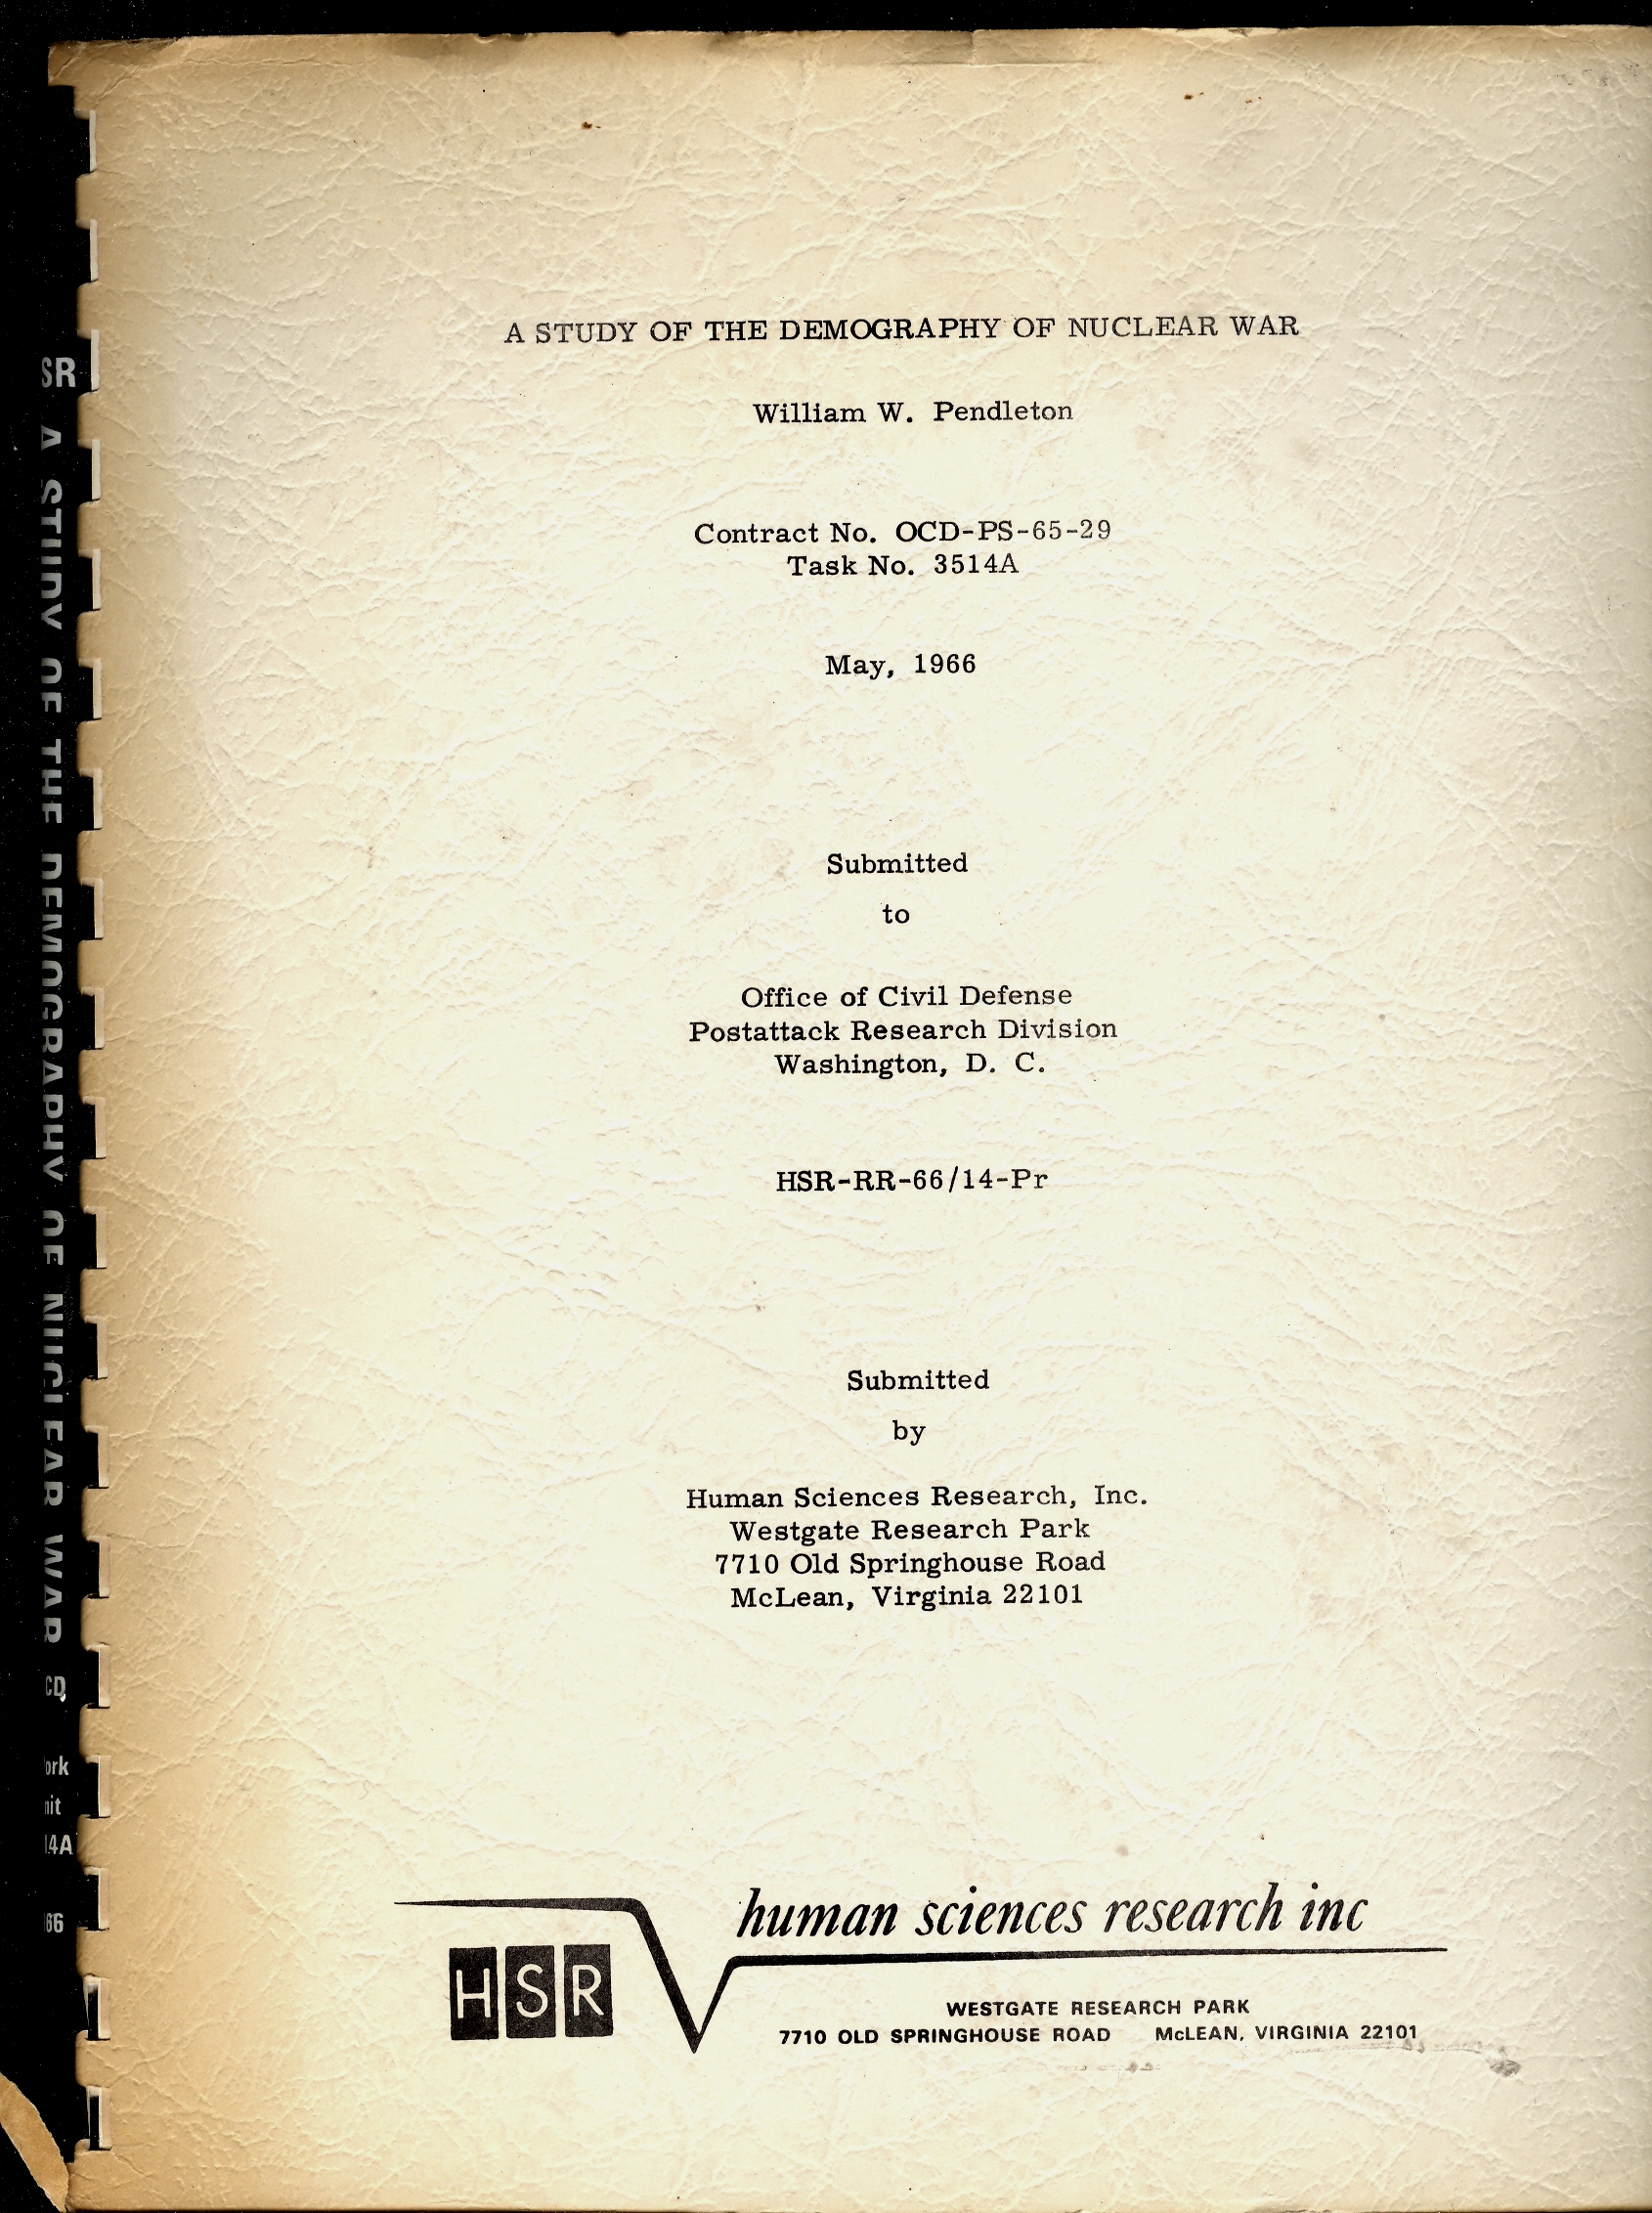
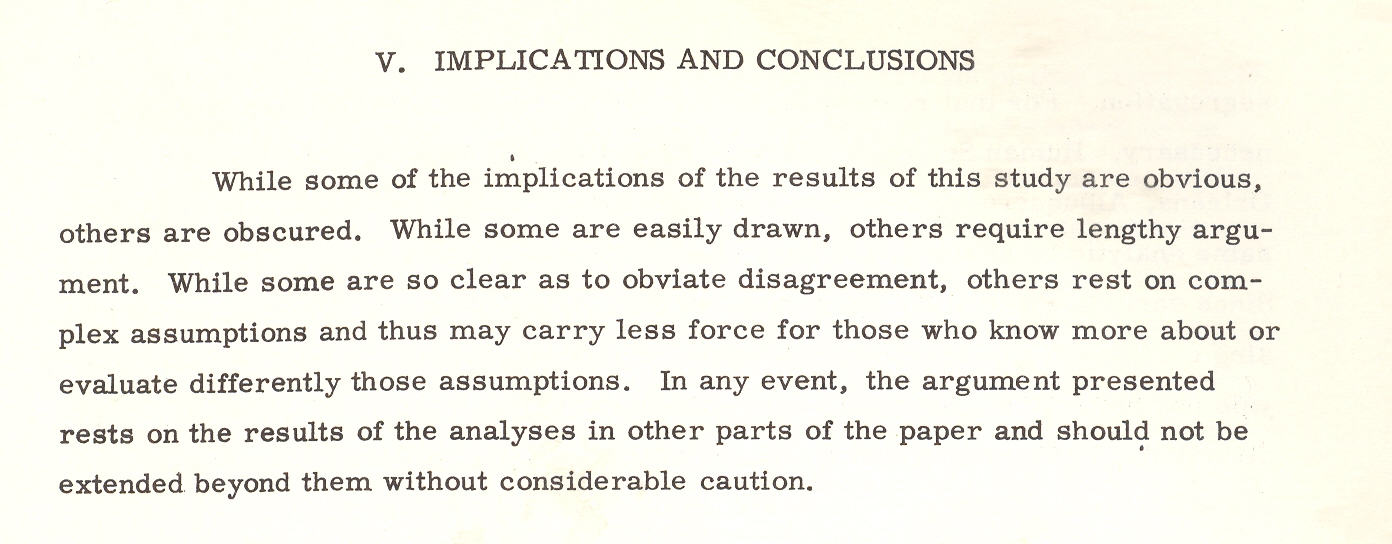
One such bit, plucked from this pile is William W. Pendleton’s A Study of the Demography of Nuclear War produced by “Human Sciences Research, Inc.” [This item is available for purchase from our blog bookstore.] Outside of its statistical foray in survivability and the procreative prospects of the left-overs of vast nuclear exchanges, the work is a solemn attempt at institutionalizing the death requirements of nuclear combat.The necessity of overwhelming carnage is presented in ironic and underwhelming language, the first bits of which are seen in the conclusion of pamphlet’s abstract1:
“Cities differ in the kinds and magnitudes of change to which they might be subjected. Considerable variation in the demography of surviving populations can be expected; that variation would be related to policy decisions; and those decisions should therefore be examined for their demographic implications.” [Emphasis mine.]
Put another way, the city is the main focus of the survivability equations, and the chances of the humans being bombed in those cities would change with—god help us—the amount of bombing.
Cities differ in the kinds and magnitudes of change to which they might be subjected.
This is the key I think to understanding documents like this, making a simple foundation statement so convoluted and tortured that it and most of what follows make any sense outside of restating themselves. Which I guess is a strength.
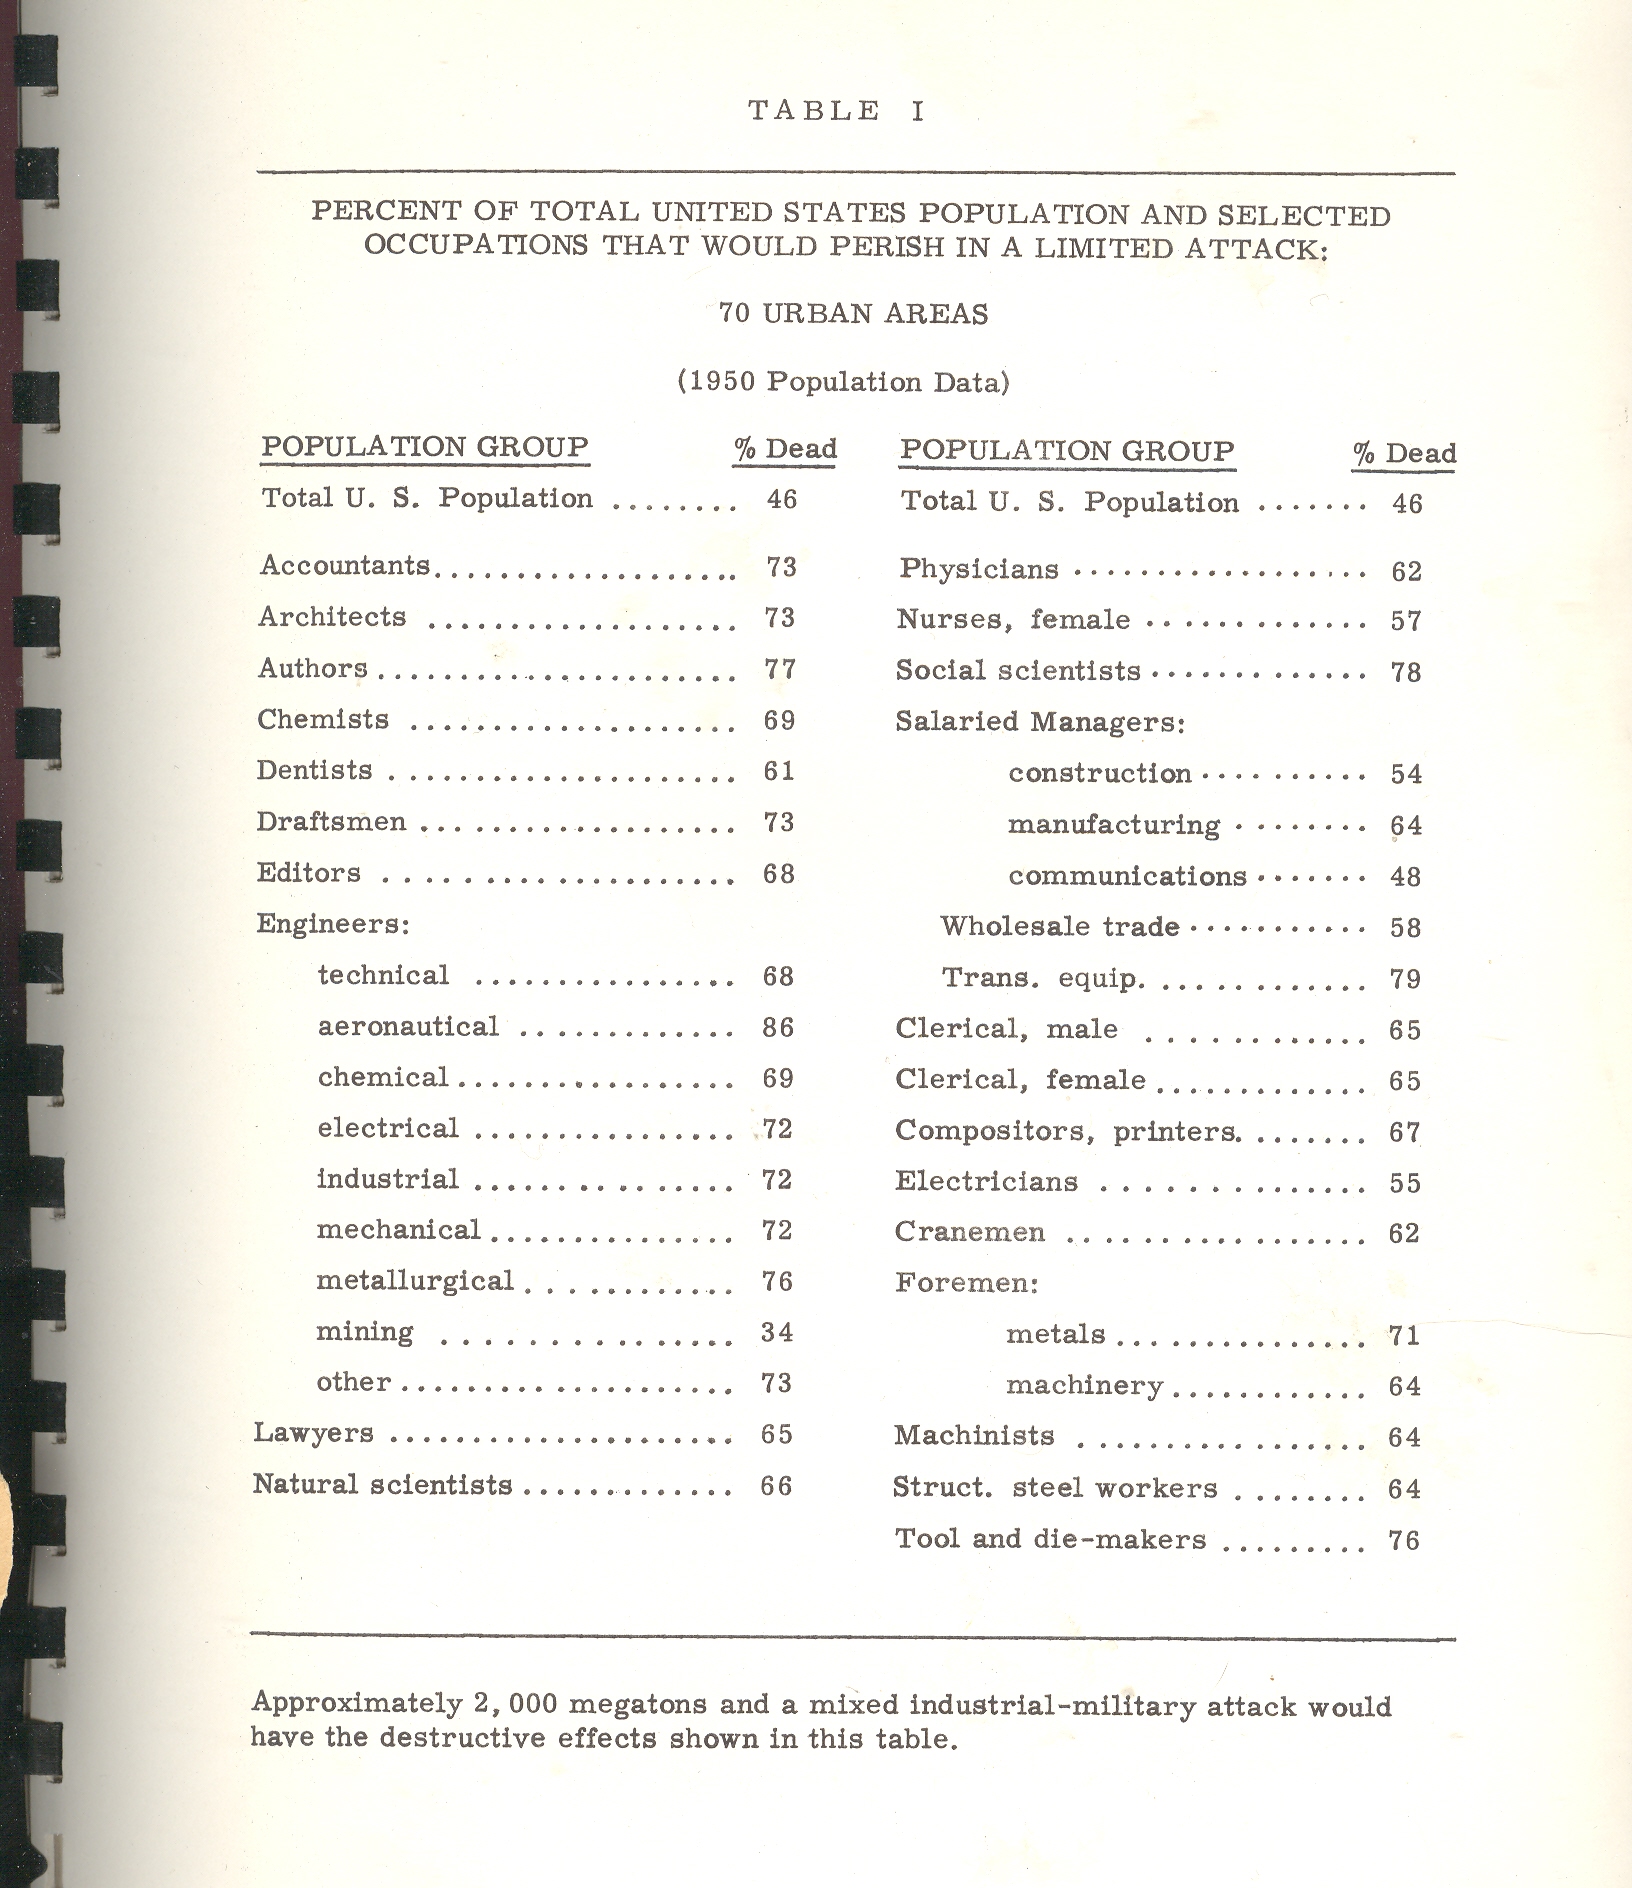
Back to the pamphlet and the interesting table that attracted my attention.According to one study [and for the sake of brevity I’m not going to describe the scenarios or data estimation methods and so on] the U.S. would suffer 46% casualties [meaning immediate deaths and not as a result of radiation or illness or starvation or the encyclopedia of whatever that would lead to death somewhere down the road].The resulting demographic of the “perished” by job description postulates that the most-killed category of worker would be: (#1) aeronautical engineers, 86% dead; (#2) transportation equipment salaried manager, with 79% killed; (#3), social scientists, with 78% of them going down with their clients; (#4), authors, with 76% gone.
Authors?Of what, I wonder?The good ones with the bad?Are authors different from writers?And what do you call folks who produce tv shows?Since the stats here are for 70 cities there’s no wonder that there aren’t any farmers in this table, as the majority target areas (some 450 cities cited elsewhere as targetable, including my own little burgh of Asheville, N.C.) would naturally have city folk in them.And so I’m guessing that three-quarters of all “authors” in 1960/6 were living in these target cities and were going to go up in smoke.The aeronautical engineers category is more understandable as every one of those industries employing 50 or more people would be a target; frankly I’m surprised that given the possible firepower of the Soviet Union in 1966 that 14% would survive; I’d guess offhand that the number would be 2%.
Even though this stuff is spread out in only 98 pages or so it would keep a person busy segregating the Orwellian gems from those not; it would be a tricky business as most of the “text” in the “not” category would be largely limited to prepositions.
Here’s another bit:a parenthetic poke at the post-attack composition of Congress. It is stated that the “postattack” (hyphenated no longer) Congress would be “quite different”. It would also be (“in their eyes”) “more Conservative than the pre-attack (hyphenated!)Congress.It isn’t a cause for great prognosticational (?) liberty to assume that the Congress might be more Conservative, but why on Earth did the author qualify the assumption by saying “their eyes”?Pish and posh.
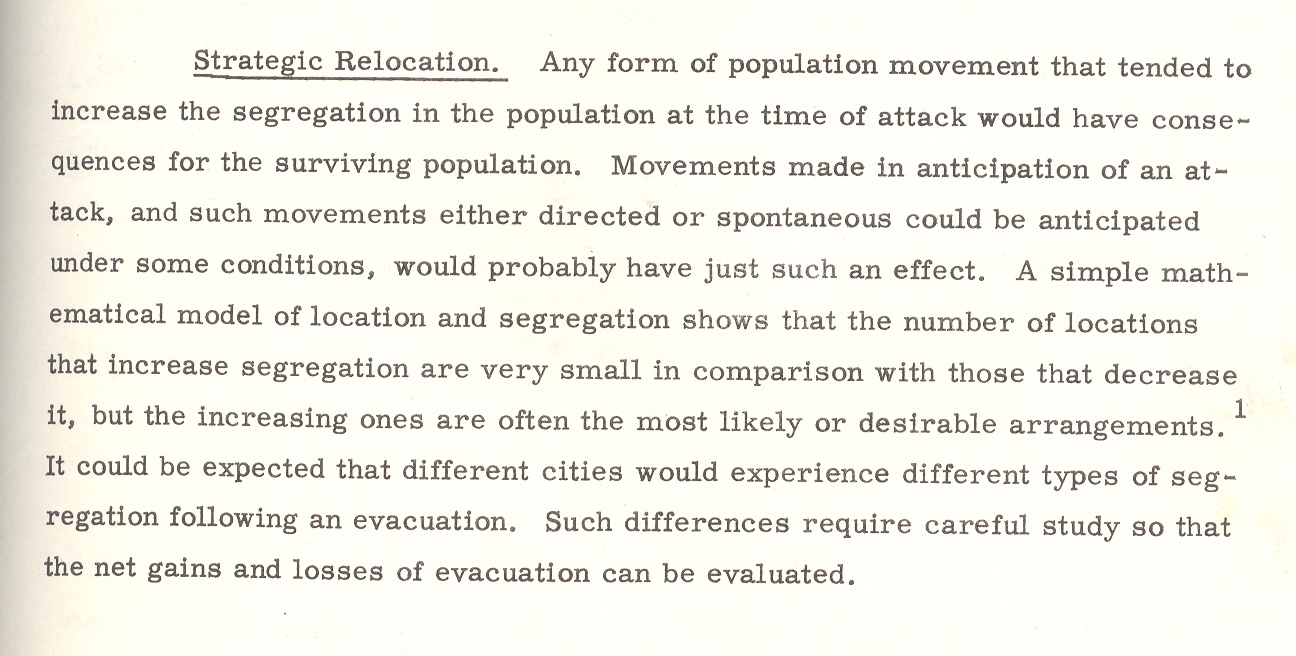
The paper goes on its merry way, connecting the necessaries of Goldbergian delight, and somehow nothing ever happened, which to me is a secret miracle.Especially given the weight of papers like this one, which seems to medicate the effects of war, assuming that there will be a Congress and that people will report back to work once the factories are rebuilt and that there will be more segregation in the colossal world of post-attack America, and on and on into the red dawn.
Mr. Mencken’s view of Warren Harding comes to mind when I read this stuff and wonder about how it was that we didn’t blow the whole place up:
“I rise to pay my small tribute to Dr. Harding. Setting aside a college professor or two and a half dozen dipsomaniacal newspaper reporters, he takes the first place in my Valhalla of literati. That is to say, he writes the worst English that I have ever encountered. It reminds me of a string of wet sponges; it reminds me of tattered washing on the line; it reminds me of stale bean soup, of college yells, of dogs barking idiotically through endless nights. It is so bad that a sort of grandeur creeps into it. It drags itself out of the dark abysm of pish, and crawls insanely up to the topmost pinnacle of posh. It is rumble and bumble. It is flap and doodle. It is balder and dash.”
Notes
1. The abstract from the above paper: “The basic problem with which this report is concerned is that of determining the kinds of demographic change that might result from a range of nuclear attacks, ascertaining the effects of those changes on the future of the surviving populations, and indicating possible areas for Civil Defense action and planning. Earlier studies of the demography of nuclear war were examined and their relevant conclusions and methodology incorporated in the report. A different methodology–expected to be more sensitive to compositional effects–was then designed. The new methodology was tested and found to be more effective than the old. Surviving populations representing a wide range of variation in attack conditions were created on the basis of both old and new methodologies, and the demographic significance of these populations was examined. Assuming a range of post-attack demographic conditions, a series of projections was made on the surviving populations. The demographic significance of the recovering populations was then examined. On the basis of the analysis a series of recommendations relevant to Civil Defense planning was made: Within the framework of this analysis the crucial variable is the demographic pattern of the city. Changes in composition, as well as size, could be of substantial magnitude and would last for generations in some cases. Cities differ in the kinds and magnitudes of change to which they might be subjected. Considerable variation in the demography of surviving populations can be expected; that variation would be related to policy decisions; and those decisions should therefore be examined for their demographic implications.”
JF Ptak Science Books Post 1613 (Post 656–expanded)
Now this was a case in which you were given the result and had to find everything else for yourself.— Sherlock Holmes in A Study in Scarlet
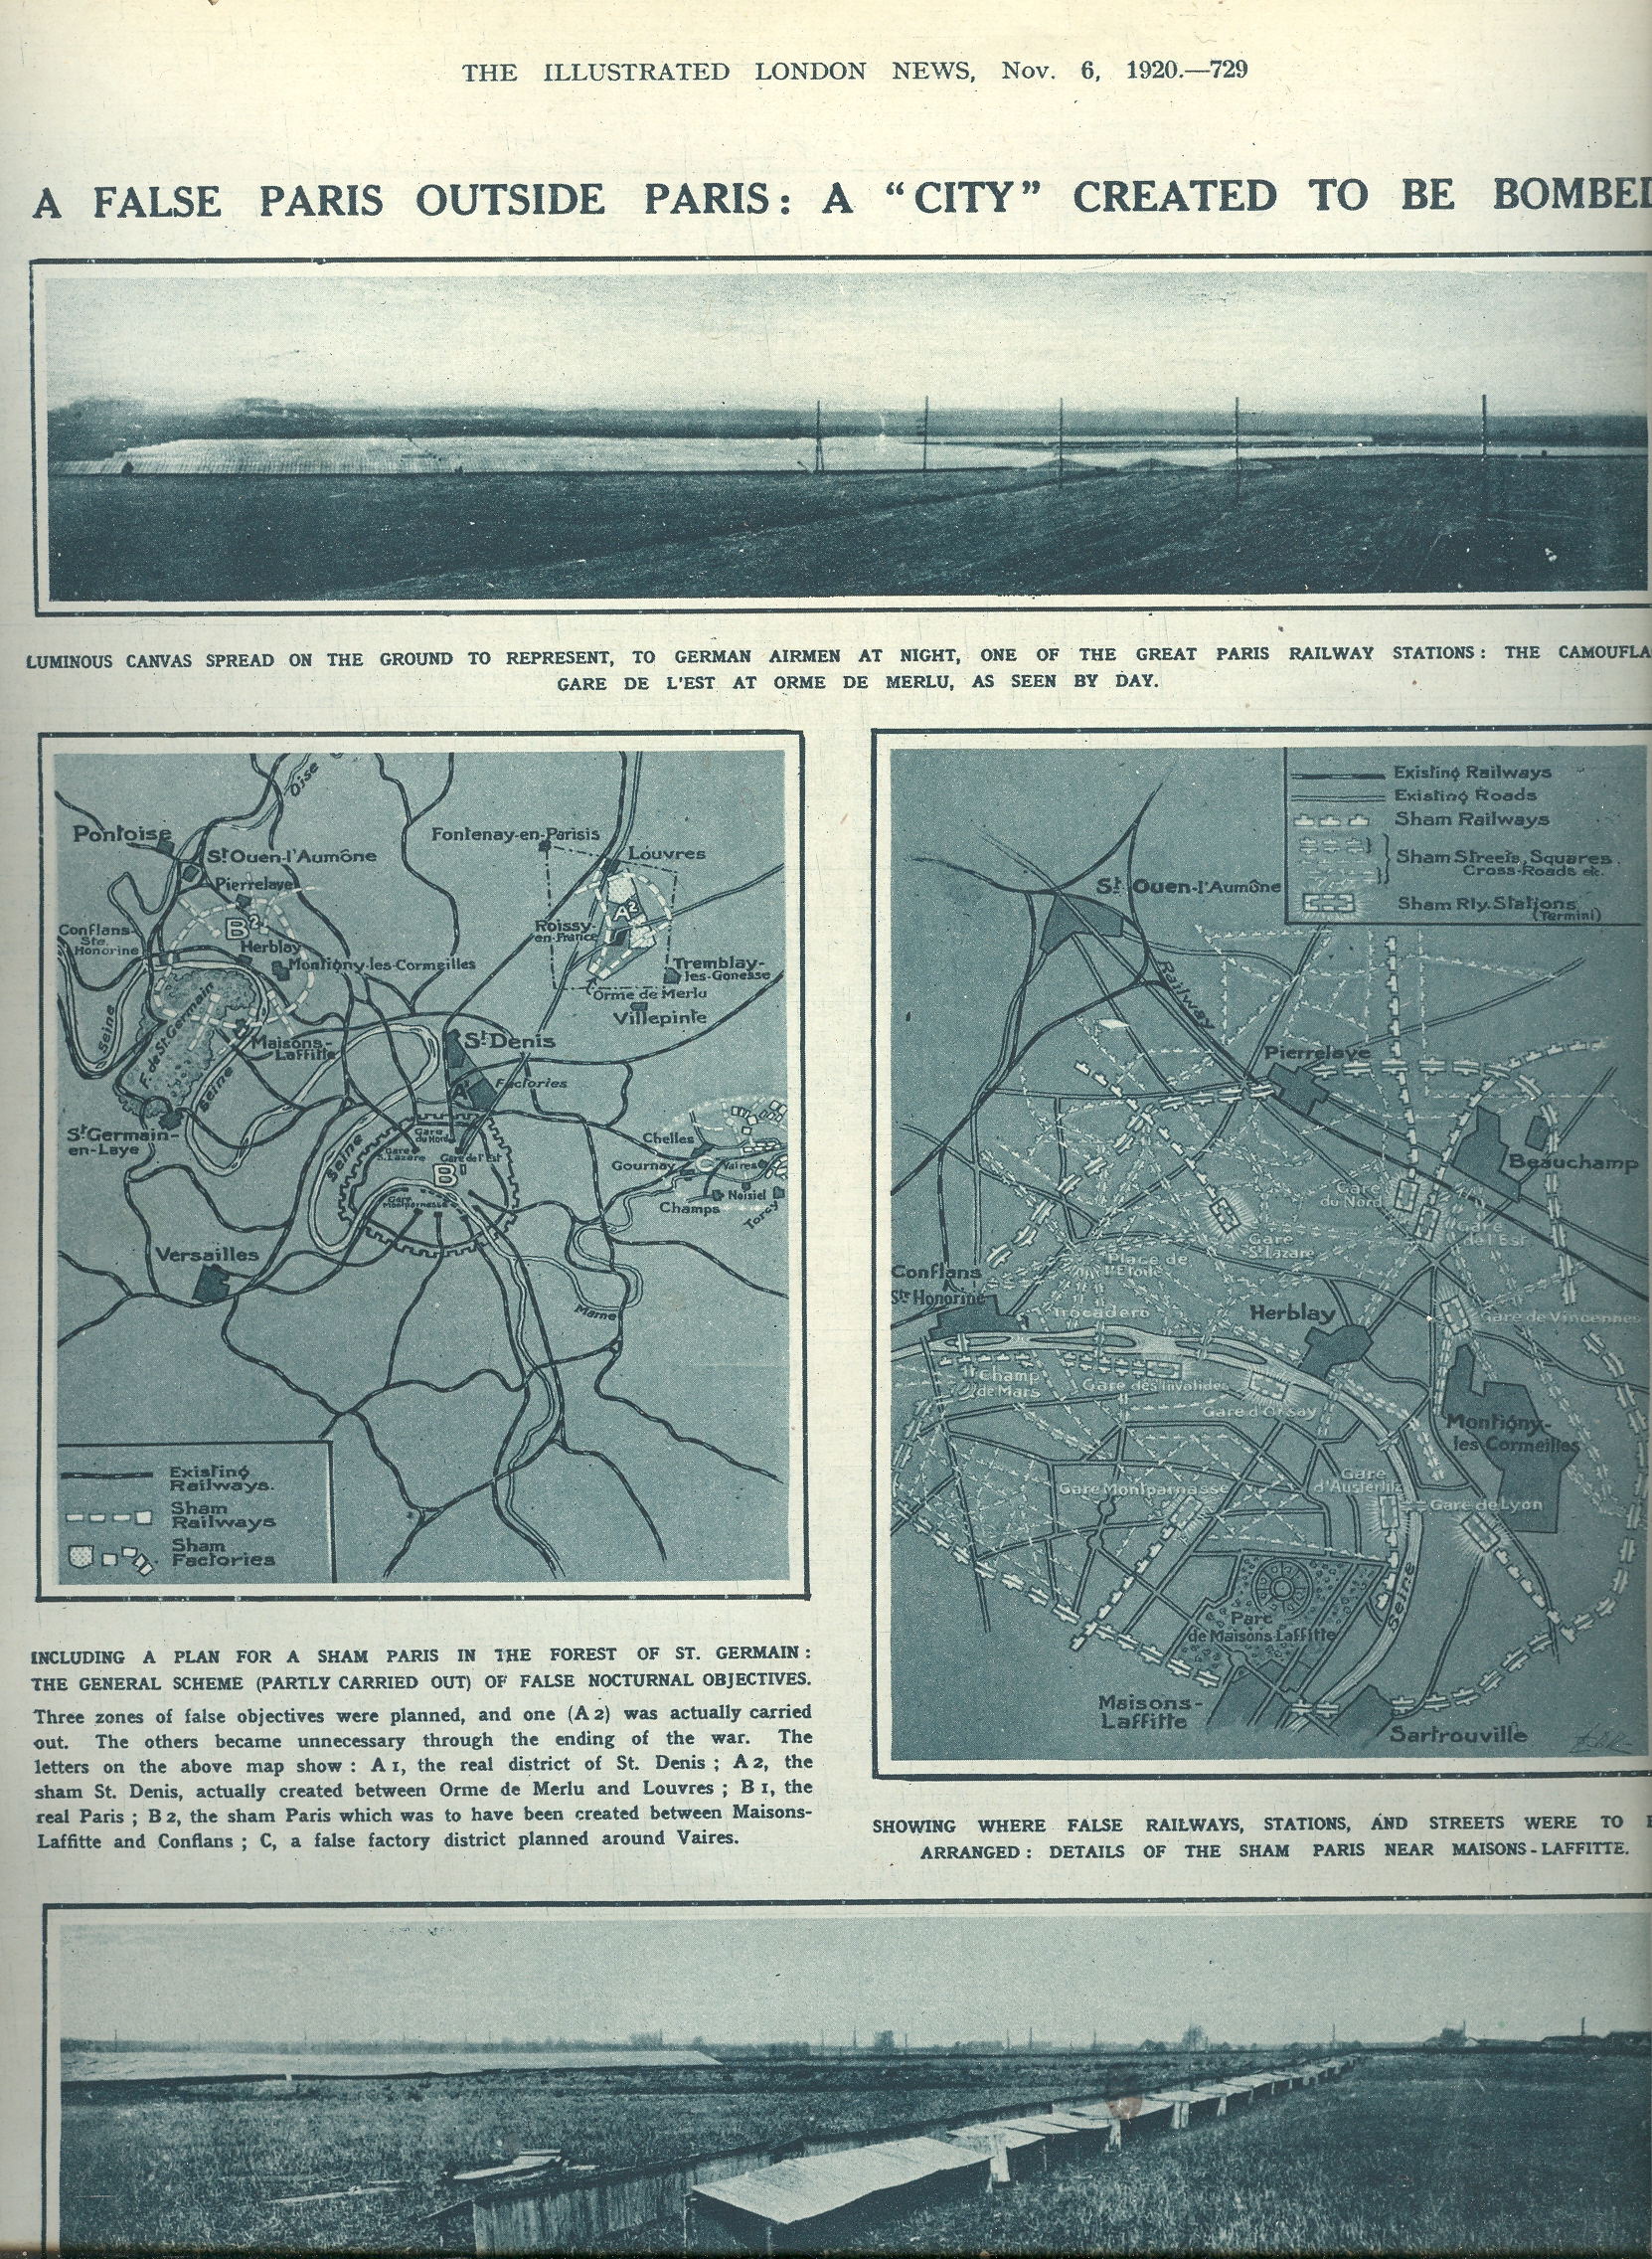
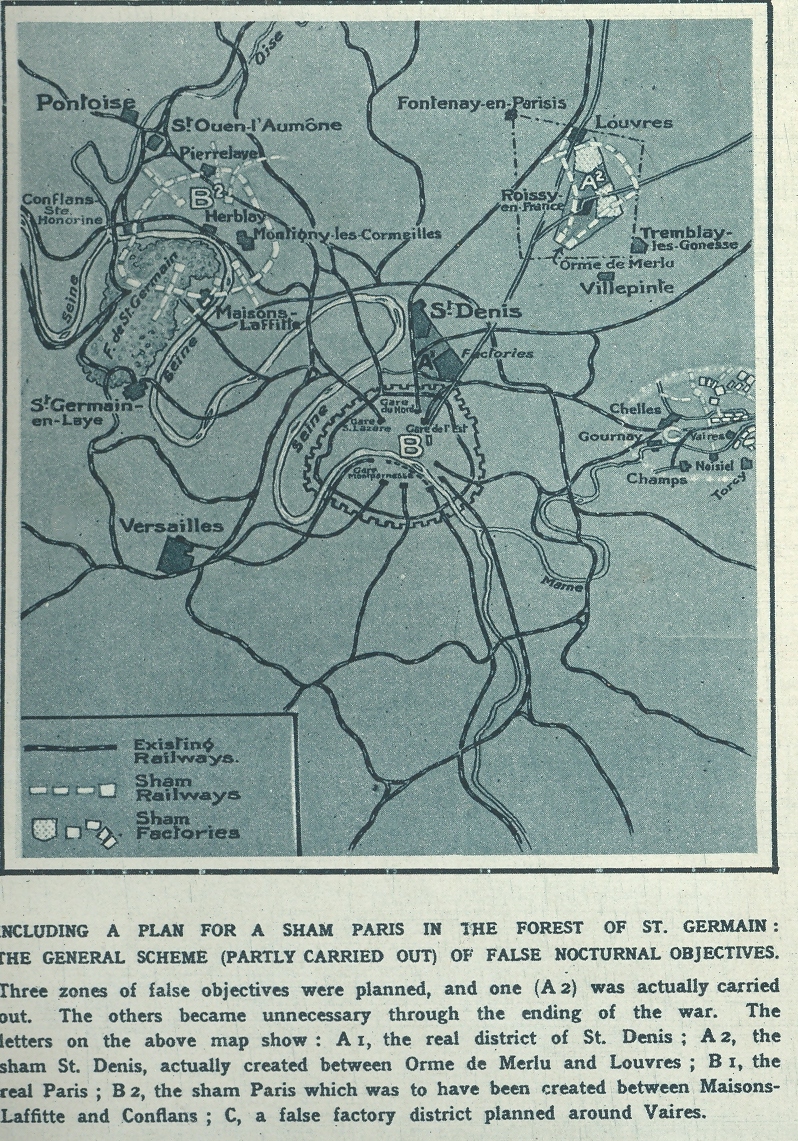
There is no doubt a history that could be written on shadow cities, cities that were built to resemble other cities, cities constructed to serve as a deterrent or double, cities set to deceive, cities constructed to be experimented upon. Some were built ot be destroyed. Like Paris–or “Sham Paris”.
Augustine cleaved two cities from one, the good and the doomed, in The City of God. The powers that were in Paris at the end of World War I tried to do exactly that—to create a Sham Paris located on the outskirts of the real city—it was to be doomed, offered with confusing lights and displays that would disorient German aviators into bombing and destroying it rather than the real city.
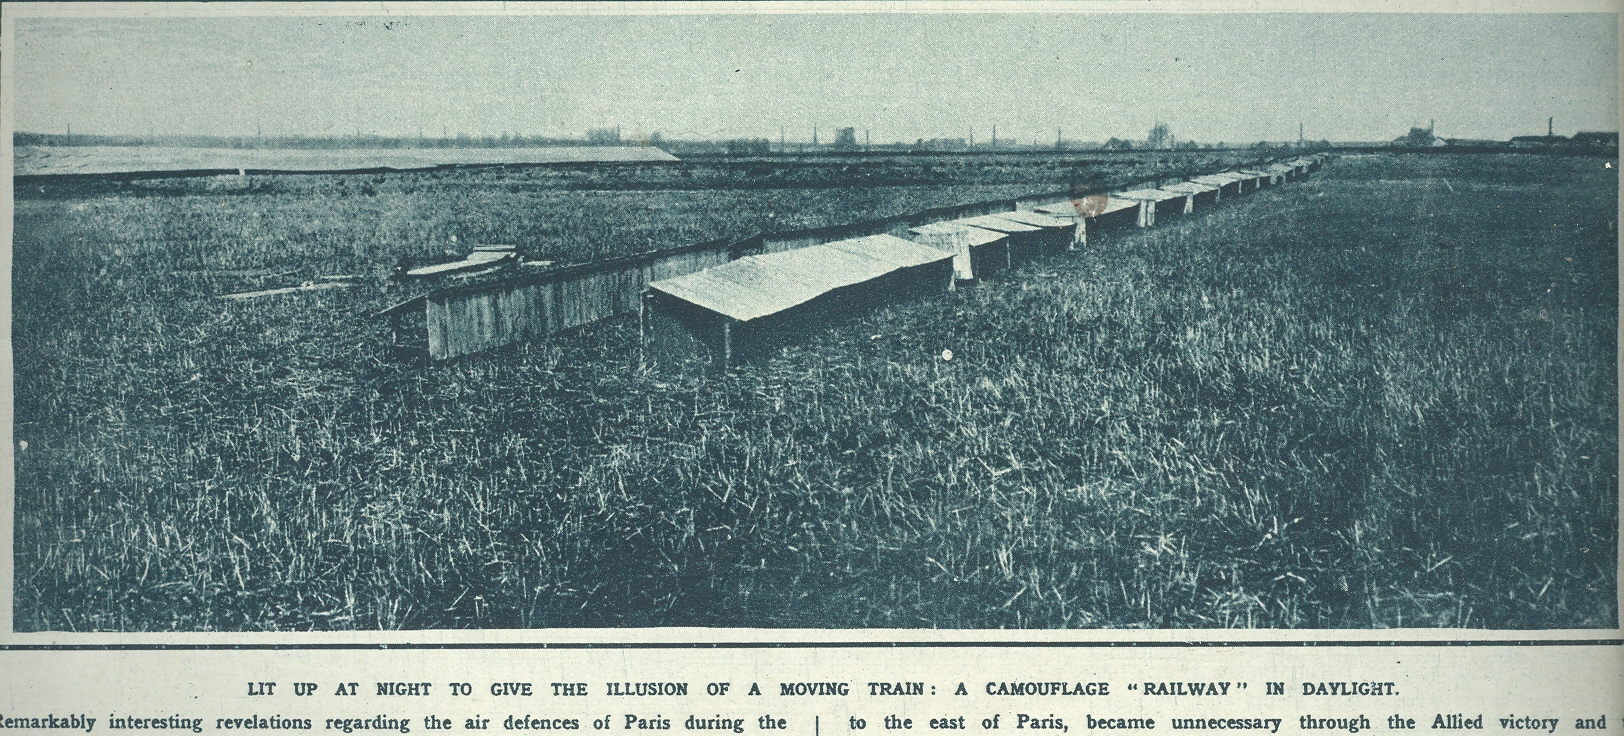
Of course these were also the days of pre-RADAR, and of aviators simply holding a bomb by its fins and letting go once a target was in sight, so the possibility of causing this sort of dissonance was at least palpable. The planes held the pilot and a lot of fuel, and not much flight weight was devoted to bombs, so the bombing runs were necessarily quick and comparatively light (by standards of just a decade later).So the idea of a Sham Paris might’ve, could’ve sort’ve worked, maybe; but not really.It had a very strong, fatal, feculent (thank you for this word, Mr. Depp) air about it, like that misty doomsday smell that lifted the Maginot Line out of the earth and dumped it in the dim and stinking past.
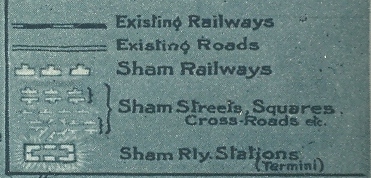
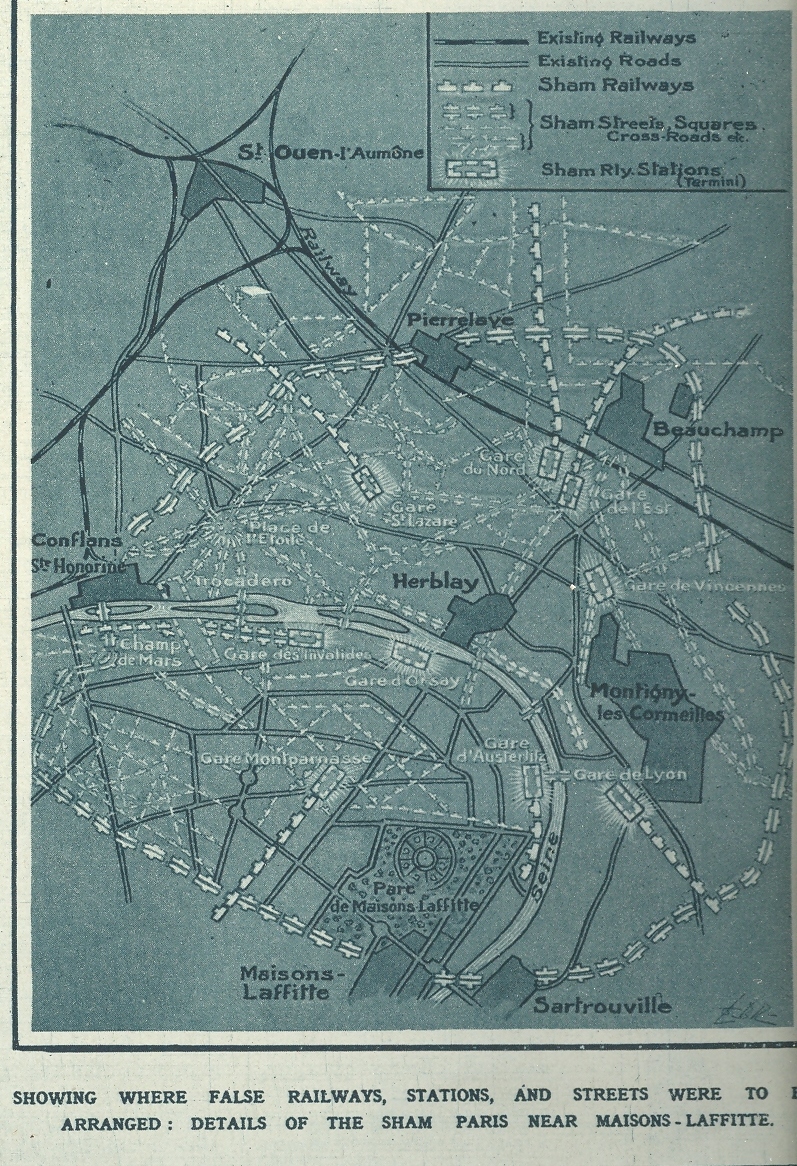
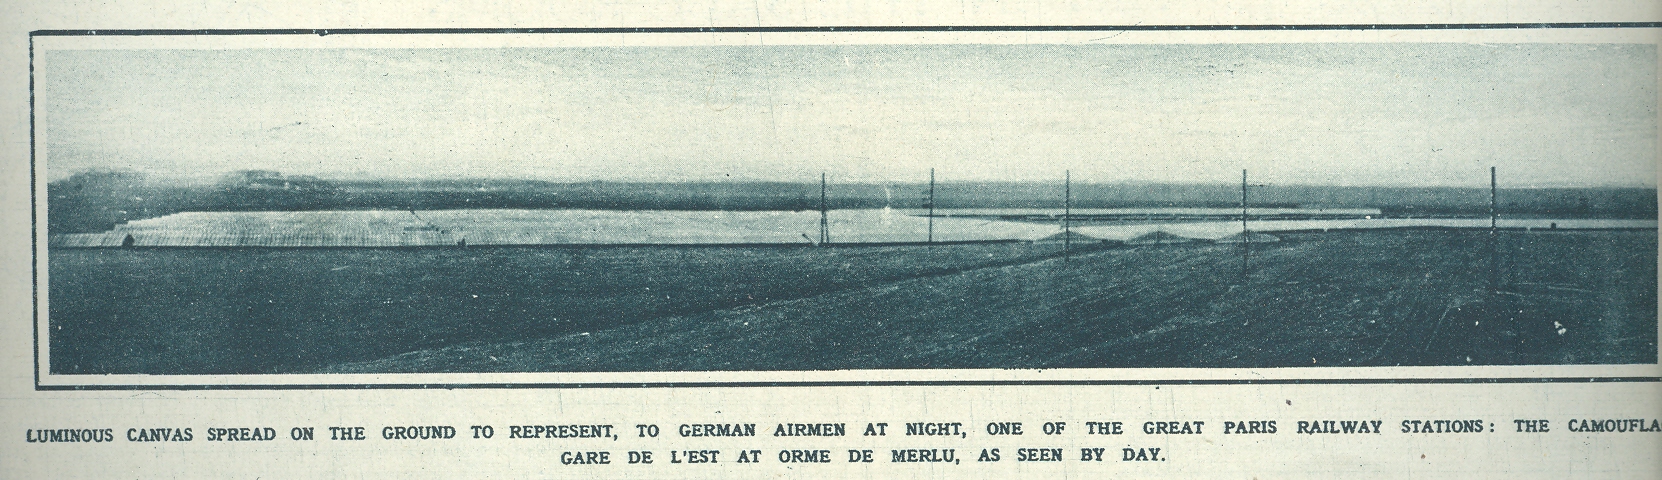
The story of Sham Paris may have been “broken” in The Illustrated London News of 6 November 1920 in a remarkably titled photo essay, “A False Paris Outside Paris—a ‘City’ Created to be Bombed”. There were to be sham streets lined with electric lights, sham rail stations, sham industry, open to a sham population waiting to be bombed by real Germans. It is a perverse city, filled with the waiting-to-be-murdered in a civilian target. Sham Paris seems to me like a reverse city. And a reverse city in the manner of the cities created by the guilty Cain and Romulus—these two were murders who created cities; Sham Paris is a city of created murders to save the innocent.
Sham Paris was only partially constructed before war’s end in November 1918.
(All images here are clickable and can be enlarged.)
Its important to distinguish Sham Cities from hidden cities, like Project Iceworm (the underground city built in Greenland) or Mt. Weather (the not-so-very-secret secure and safe bunker for the governing class in Bluemont, Virginia) and so on. Sham Cities were definitely constructed for deception and/or destruction. The next city we’ll take a look at: Survival Town, Nevada.
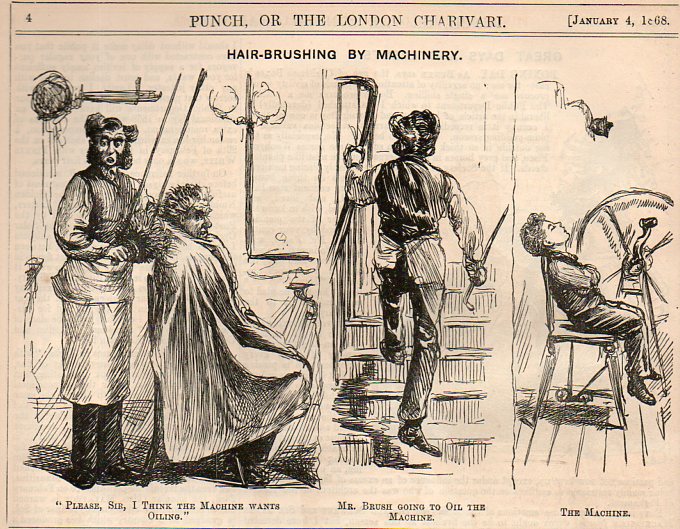
In mid-Victorian England lived high possibilities for the use of electricity, in industrialism, in tools, and machines–but I think most of all, it was the new appearance of Revolutionary Machines that seemed to me to offer itself as the new religious altar for the mass of people. After all, machines looked absolutely beautiful–and it wasn’t just the machines, but their housings as well, what with some of these massive things being housed and supported by absolutely gothic-inspired designs, making the entire unit seem as though it was not only used by was the seat for some sort of belief.
[Image source: Sam Ryan, with transcription by him below.]
And like anything else, some of this belief-and-application system went a little too far, as we can see in this 1868 cartoon from Punch magazine. There were new machines that could help the barber to treat hair–or in this case, brush it–but the new machine didn’t really do that much good, so the thing might not have existed at all except to keep the barber from being bypassed by his more-modern companions. But at the base of it all, like so much in Vctoria-ville, this machine happened to by Boy-powered.
The cartoonist was just having a jab at the over-reaching of more-complex machines to do simple work, along with a sideways social poke at the idea of child labor.
“Vision: a device that belongs to those who have it. Far-reaching and fore-shortened, it is something that works best when used closely, loosely, finely and not at all. A gift-and-a-half and a half-a-bother.” The imagined Devil’s Dictionary of Not Ambrose Bierce
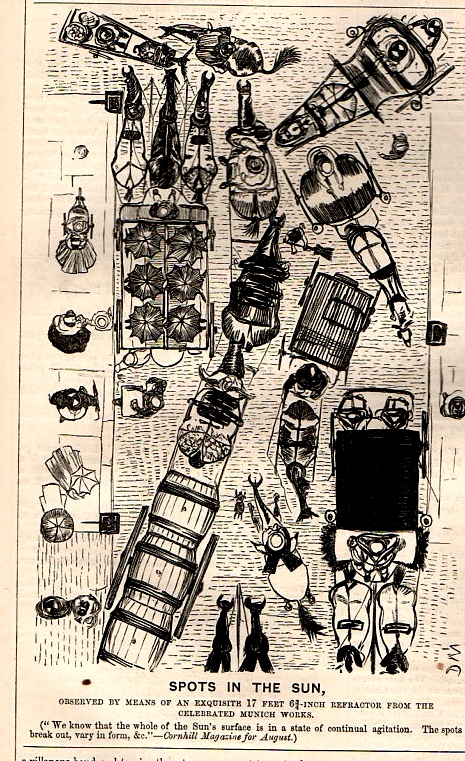
In the many years that I have been looking at antiquarian prints, I must say that in the hundreds of thousands of them that it is very rare to see an image that looks straight down from a height upon its subject. And that is exactly what struck me about this print in the 22 August 1868 issue of Punch, or the London Charivari magazine. Straight down ti is that we’re looking, straight onto a busy city street, presented here as though it were the face of the sun, the hansom cabs and people in the thoroughfare being sunspots.
The sunspot were in the mind of Mr. Punch the very life of the sun, and so too for the bits of humanity filling the streets.
At first I wasn’t sure that “sunspots” were chosen for this cartoon for any particular part of their history in 1868–that is, if 1868 wasn’t a particularly big year for sunspots. In general they were certainly known by this point for more than a thousand years, though the greatest recent attention with optical instruments occurred with Thomas Harriot, Johannes & David Fabricus and Christoph Scheiner all around 1610-1612, and then most famously with Galileo who recorded them in 1612 in his Istoria e Dimostrazioni Intorno Alle Macchie Solari e Loro Accidenti Rome (or History and Demonstrations Concerning Sunspots and their Properties, published 1613). And closer to this time (among other things) Heinrich Scwabe had published (in 1843) a major advance on the cycle of sunspots. But as it turns out, though, the word “sunspot” had just entered the language in 1868, according to the Oxford English Dictionary, coming via Sir Norman Lockyer’s Elementary Astronomy (1868), arriving as “sun-spot”. High delightful! Punch was really quite on its toes on this one, employing a brand new word for a well-established astronomical phenomena to a rare view of looking straight down at a bustling street, cycles and all. (Another sort of cycle would soon come to be applied in the next few years in the pages of Nature to sunspots from the brilliant logician (and other things) William Stanley Jevons–this bit of thinking done in trying to correlate sunspots and economic depressions. This one wouldn’t hold, though it was a very interesting idea.)
The United States Patent (And Trademark) Office is the keeper of millions of tiny flames of inspiration and invention, and was given its offices in Article 1 of the Constitution (“”The Congress shall have Power … To promote the Progress of Science and useful Arts, by securing for limited Times to Authors and Inventors the exclusive Right to their respective Writings and Discoveries”).
There are now 6,800 patent examiners working away in the Alexandria patent building, up from 4,200 just six years ago. Still, that’s a lot of patents to have to inspect, and even in the best systems with the best people working there will some things granted patents that ought not have been.
One of the great shining lights of patented inventions in the Hall of Huh? must certainly belong to Boris Volfson, who was granted a patent in 2005 for his superconducting electromagnetically-engined space-time continuum-bending dual-piloted perpetual motion space/time ship. It seems to be run on a special mixture of nonsense physics, suspended belief, and hope, though I think the power source was mostly engineered from the “hope” side. It is slightly Mayan-esque, and looks pretty. Aside from that, there’s nothing else going on here. (An article appeared in Nature 438, 139 (10 November 2005), calling the “invention” out and questioning the process behind the granting of the patent.)
There was also the “hyper-light-speed antenna”, a less-than Star Trekian invention given U.S. Patent 6,025,810 that was able/supposed against all known physics and sense to transmit energy at speeds in advance of light via (again!) holes in our space-time continuum. The inventor writes: “The present invention takes a transmission of energy, and instead of sending it through normal time and space, it pokes a small hole into another dimension, thus, sending the energy through a place which allows transmission of energy to exceed the speed of light.” I like the “pokes” and “thus” parts. [The abstract for the patent describes the invention so: “A method to transmit and receive electromagnetic waves which comprises generating opposing magnetic fields having a plane ol maximum force running perpendicular to a longitudinal axis ol the magnetic field; generating a heat source along an axis parallel to the longitudinal axis ol the magnetic field; generating an accelerator parallel to and in close proximity to the heat source, thereby creating an input and output port; and generating a communications signal into the input and output port, thereby sending the signal at a speed faster than light.”]
But it isn’t the absurdo-complex stuff that somehow drags itself through a primordial soup of caffeine-generated confusion–simple stupid stuff occasionally will get patented as well. Like the cat exercising device U.S. Patent 5,443,036, where someone somehow got a patent for showing how to use a laser pointer in cat hijinx. Or the “Method of swinging on a swing” (U.S. Patent 6,368,227), which seems to have been an experiment by a patent examiner with his seven-year-old son that got a life of its own for a little while before eventually being found out.
These of course are anomalies, and the good folks at the USPTO receive something like half-million patent applications a year, so I guess a few of these bogies will slip in from time to time. Perhaps it is time for me to try and patent Pressing the Letter “E” on the Computer Keyboard Really Hard and we’ll see what happens.
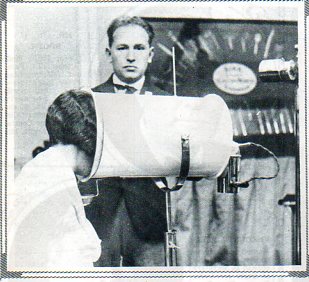
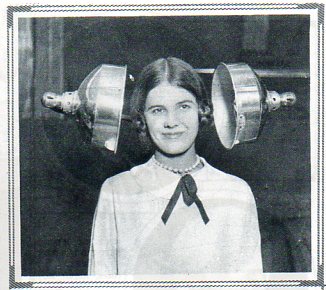
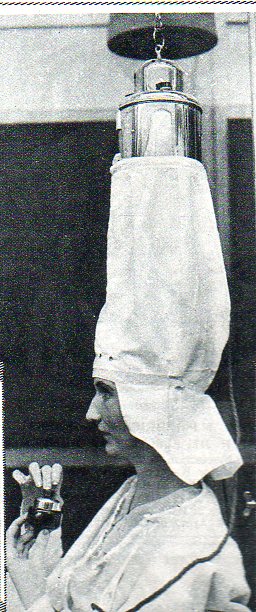
These images come to us from our not-so-dim Seussian/Medusian hair-care past, even though they seem to be instruments for hard-line delivery of intelligence. The hairdresser’s tools were simple: pore openers, hair straighteners, hair curlers, heat setting heat setters, and the like. [The source is actually The Illustrated London News, 20 October 1928, page 720.]
A metaphorical statement is not often seen in its literal sense, graphically displayed–especially in mathematics. But I did stumble across this example in the 15 June 1885 issue of Punch, or the London Charivari. It was used to illustrate an inglorious poem on an inglorious topic that we don’t need to go into just now, but the tail-piece does exhibit the curious image of being buried by numbers.

 of mountains and lengths of rivers, or the grouping of all the world’s lakes, or the divorce rate map of the United States at Centennial, or the heights at which different sorts of trees are found, or geological speculations on the thrust of the Appalachian chain, or the wanderings of the course of the Mississippi River (below), and other hosts of things.