A Daily History of Holes, Dots, Lines, Science, History, Math, Physics, Art, the Unintentional Absurd, Architecture, Maps, Data Visualization, Blank and Missing Things, and so on. |1.6 million words, 7500 images, 4.9 million hits| Press & appearances in The Times, Le Figaro, Mensa, The Economist, The Guardian, Discovery News, Slate, Le Monde, Sci American Blogs, Le Pont, and many other places… 5000+ total posts since 2008.

Category: Maps/Diagrams of Imagination & Ideas

  • Rainography: a Map of Rain in the British Isles, 1911

    JF Ptak Science Books  Quick Post

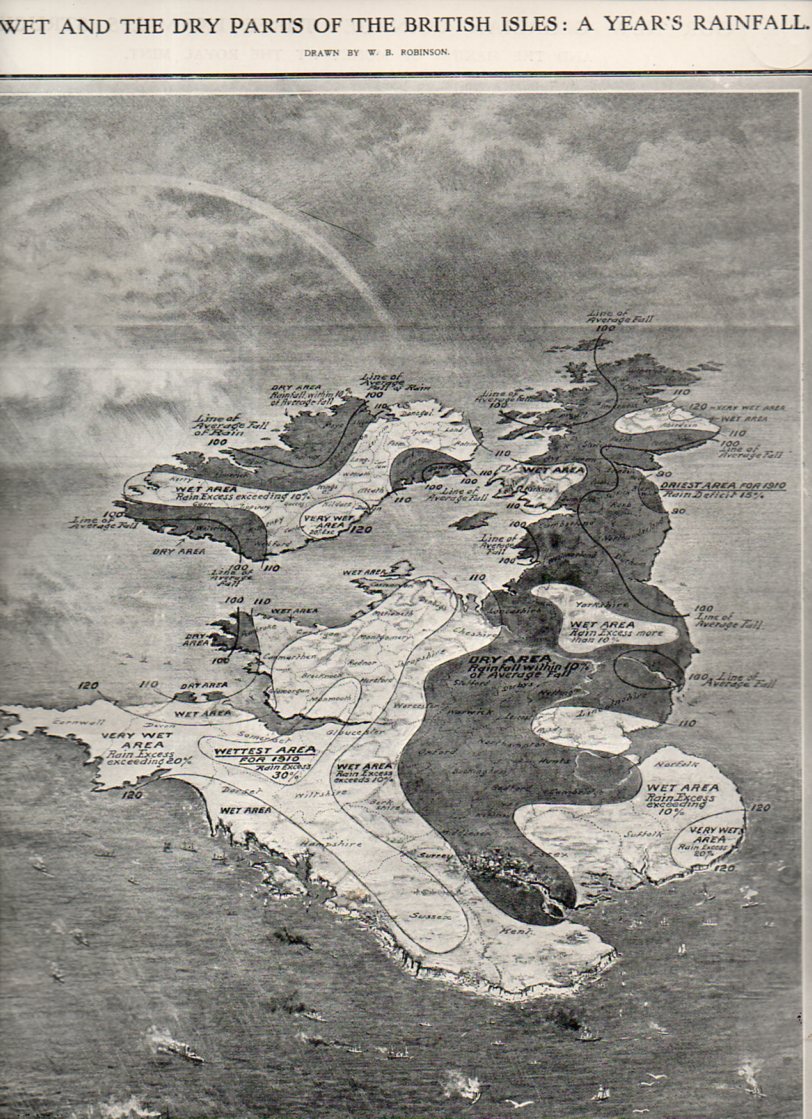
    “The Wet and the Dry Parts of the British Isles: a Year’s Rainfall” birdseye view appeared in the Illustrated London News on 28 January 1911, and it is a lovely and scarce example of a meteorological graphical display of quantitative data rolled into an oblique view.

    Rain731


  • Golfography: a Map of Golf Around London, 1920

    JF Ptak Science Books   Quick Post

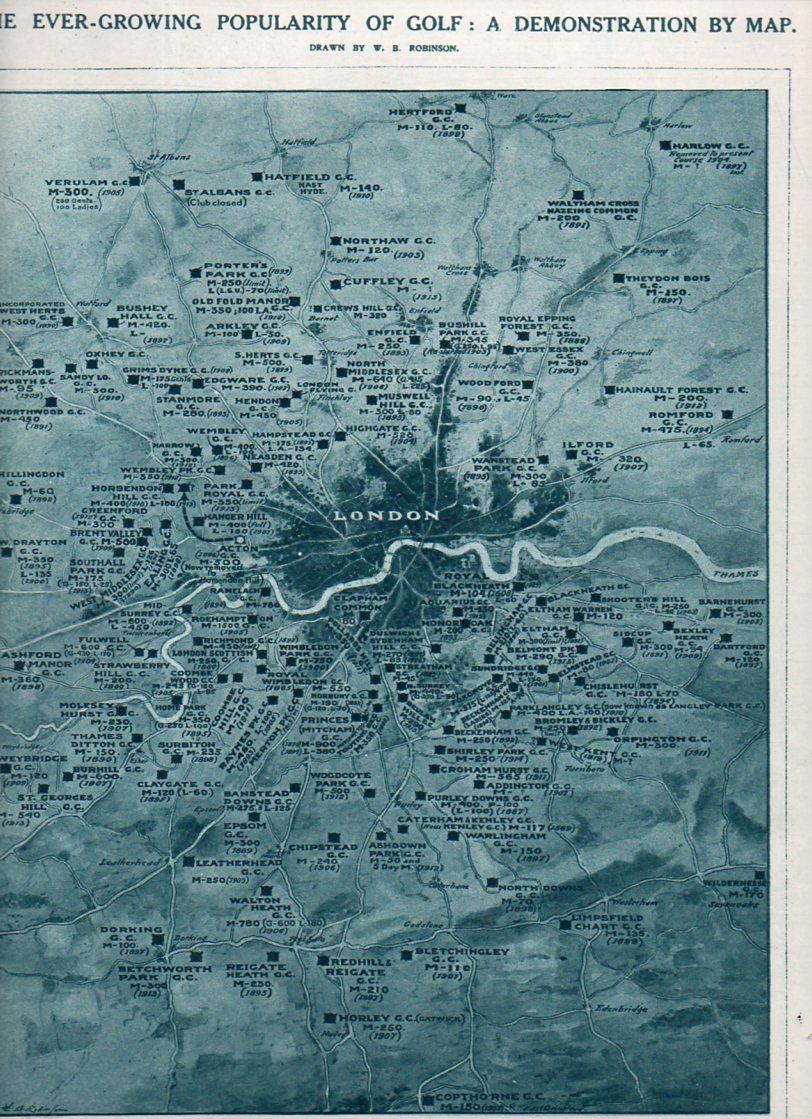
    I just happened upon this, but since it is the British Open and all I though to publish it here.  The map was composed for the Illustrated London News, 3 July 1920, by W.B. Robinson. It shows the number of links around the city of London–seems like a lot to me, and this data doesn’t even include miniature golf, which was very big at this time. The Key: M = a “membership” club; L = Ladies; A = “associate”, and the year underneath is the year the course was organized.  The game is evidently older in Scotland, but around London golf dates to the time of James I. 

    Golf730


  • A Fine Graphic: “A Table of the Cheifest Cities and Towns in England”, 1600

    JF Ptak Science Books   Quick Post

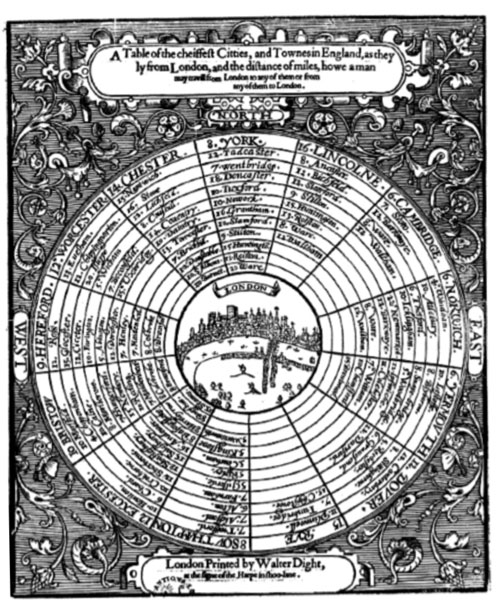
    Here’s a rather remarkable and ingenious display of information and distance usually reserved to show the structure of the solar system.  A Table of the Cheifest Cities and Towns in England, printed in London in 1600, the work of an anonymous thinker, utilized the standard and generally universal salient for the planets to show distances of cities and towns from the center of the British universe, London.  

    Source: Doug Eskew, “Coriolanus and the Paradox of Place”, here.


  • Antiquarian Comparative Analysis: Lakes, Islands, Mountains

    JF Ptak Science Books   Post 1817

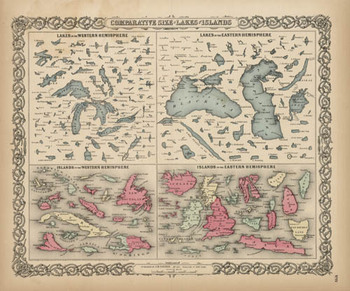
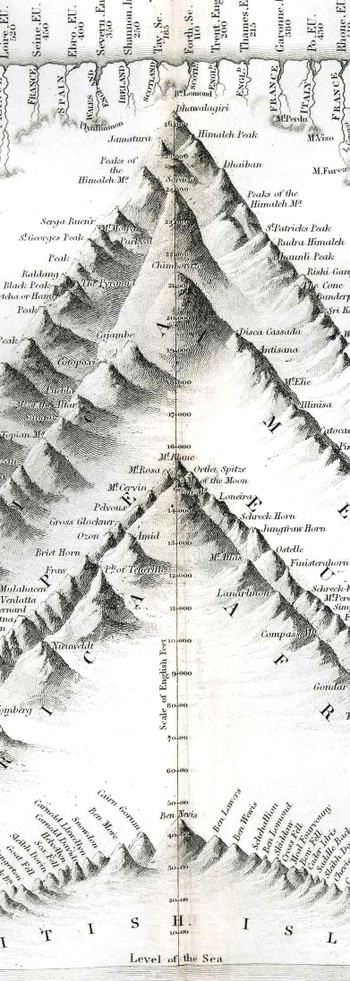
    Blogjuly_19_comparative_big_colton 1856 may have been the first time that these 150+ lakes and islands of the Western and Eastern Hemisphere were ever been printed on the same page and in the same scale exclusive of their associative land masses and placed contiguously, side-by-side.  They were, of course, seen in a common perspective before on any world map, but I think that this is the first year in which the islands and lakes of the world were displayed without oceans and land masses, and the effect is a little odd.  If you take away the color and the text the image takes on a very definite biological flavor (I keep thinking of that tiny bone in the ear for the small lakes…)  In any event it is far easier to compare these features without the distractions of the non-lakes and non-islands clouding and confusing our perspective fields.

    This was also the beginning of the heyday of publishing comparative this-and-that in atlases:  from 1840-1880 or so was the period in which the majority of descriptive comparatives were published.  This is when you would see comparatives of the lengths of rivers and the heights of mountains and waterfalls beautifully displayed in atlases.  I don’t know what happened after then, but the publication of this sort of data really fell off, with the heights of mountains/lengths of rivers stuff relegated to filling the empty areas in double-hemisphere world maps 
    Blogjuly_19comparative_1836350
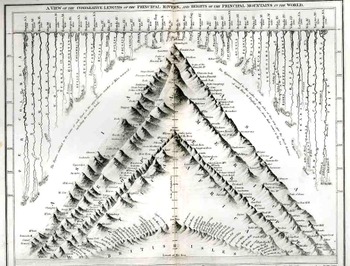
    Here’s a relatively early image of this type called “A View of the Comparative Lengths of the Principal Rivers and Heights of the Principal Mountains in the World”, published by Orr & Smith in London (1836), featuring 44 rivers and a hundred or so mountains.  It is a lovely and graphically pleasing work, and an early effort in displaying the dissected river and mountains in such a forensic-like way.
    Blogjuly_19comparative_1836_detail_

    This I think is my favorite genre of specialty map, and I plan to write on them in great detail (and heavily illustrated) in just a bit; but, for now, I’d just like to surface this map by George Colton, and admire it, and try to imagine the kind of impact it must’ve had on people back there in 1856 who were seeing this sort of data displayed so for the first tine.  It would have been a huge revelation to see the lakes and islands compared side-by-side; it was a fresh, new idea, and an insight in how to look at things in general.


  • An Interesting Concentric Graphic and the Number 12 (Twelve XII 2^3X3)

    JF Ptak Science Books   Post 1819

    Oh TIme, thou must untangle this, not I; it is too hard a knot for me t’untie! — Twelfth Night. 2.2.40-41

    Graphic bouvelles
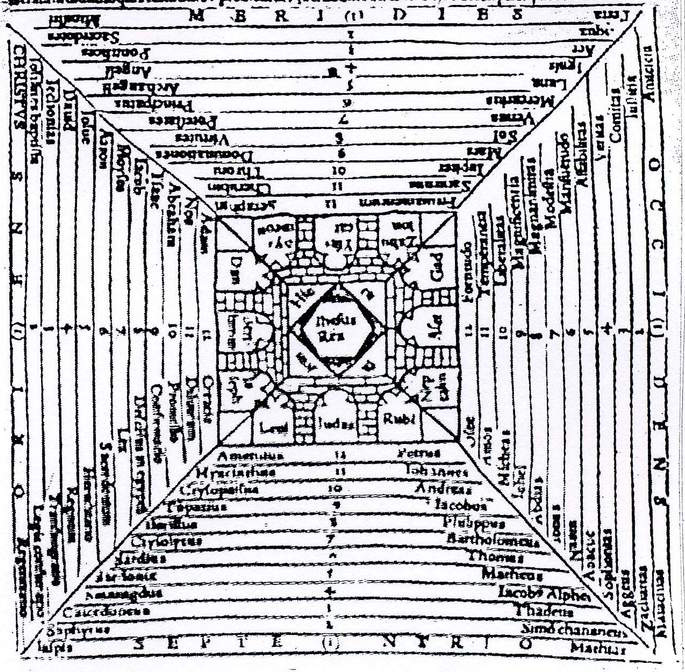
    I really should have included this in yesterday’s post about a terrific and creative image of concentric circles used early-on to display concepts of terrestrial distance and importance (A Table of the Cheifest Cities and Towns in England, printed in London in 1600,  ), as they both use this organizing concept in a bit of an uncommon way.  This image appears in  Charles de Bouelles’ beautifully titled Que hoc volumine continuentur; Liber de intellectu; Liber de sensu; Liber de Nichilo; Ars oppositorum; Liber de generatione; Liber de sapiente; Liber de duodecim numeris; Epistole complures, and printed in 1510 in Paris (from which also appears another interesting image on the “evolution” of the rock from being to thinking to being again, here), and maps the importance of the city of Jerusalem, but more importantly places its significance in the histories of the number twelve, centering on the city itself and the twelve tribes of Iraeli, and then branching out in more creative listable ways.

    Besides the twelve tribes, there are the twelve constellations of the ecliptic, Apostles, knights of the Round Table, trials of Hercules, Olympians, sons of Odin, books of Paradise Lost and the Aeneid, hues of the color wheel, inches, months, dozen, virtues, Olympians, half unit of the day, and on and on. 

    There are twelves enough to carry out just about any iconographic need, and that limited to just occidental resources.

    Source:  Les Pierres du Songe, Etudes sur les graffiti medievans, here.


  • Antique Solutions of the Knight’s Tour, 1750

    JF Ptak Science Books    Quick Post

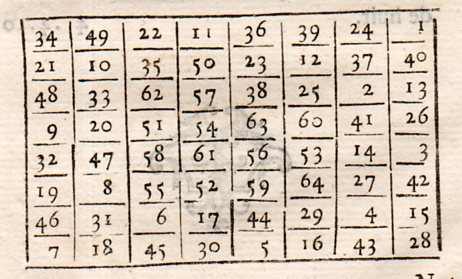
    Passing through a later and edited edition of Jacques Ozanam (RECREATIONS MATHEMATIQUES ET PHYSIQUES, Qui Contiennent Plusieurs Problemes d’Arithmetique, de Geometrie, de Musique, d’Oprique, de Gnomonique, de Cosmographie, de Mecanique, de Pyrotechnie, & de Physique. Avec un Traite des Horloges Elementaires. Nouvelle Edition, Revue, Corrigee & Augmentee… and published in Paris in 1749-1750) looking for possible expansions on what he wrote on the Knight’s Tour–a chess/math problem where the knight starting at, say, the center position must be moved to touch every square of the  board in 64 moves–I found this little diagram showing the spaces to which a knight may not move:

    It seemed just a little unusual to me–not being a reader of chess literature–to see what seemed the negative of the knight’s movements on a truncated board.  But I guess this is what we calculate and just not entirely “see” while playing. 

    The original problem in the 1672 edition of Ozanam’s Recreations  looks like this (and titled “faire parcourir au cavalier toutes les cases de l’echiquer”):

    Chess ozanam477

    in which the knight starts off life at the top right square (h8) and finishes at f3.  In the 1803 edition of the work it is pointed out that the knight can be started from any square and moved 64 times to accomplish this same feat. 

    Here are four further examples of solutions to the knight problem:

    And as they say, many more are available. 

    A more modern version of the solution, this on a 24×24 grid:

    File:Knightstour24x24.png


  • Earths inside the Earth–a Short Note on Inner Civilizations. And Maps.

    JF Ptak Science Books   Post 1782

    There should or could be an enjoyable history written on the internal living history of the Earth, or Earths-within-the-Earth, because the idea is quite old, and latches itself like a good idea on top of a bad idea inside a decent idea.  The end result though is not so great, but, given the longevity of the interior Earth idea and the people who perpetuated it over time, I would like to read a history of the thing, even if it went nowhere.  I guess the history could be fiction and come out with almost the same result, but well, some of the happened-history is stranger than fiction. 

    I was brought to think about this by a patent granted to Herbet Francis Williams-Lyouns (British, 1863-1933).  Lyouns was a painter but for some reason cooked up this idea for an international exhibition just before the year 1900.    The patented idea was for a free-standing globe/sphere with a series of stairways that would get paying folks to a lighthouse at the top.  From what I can tell the thing was to be 150 feet high or thereabouts–it is difficult to tell since there are no technical specifications in the patent itself.  There was nothing really to suggest dimension and without physical specifications I’m not sure exactly what Lyouns was patenting, except for a big globe with a lighthouse on top that could be populated with a paying crowd. 


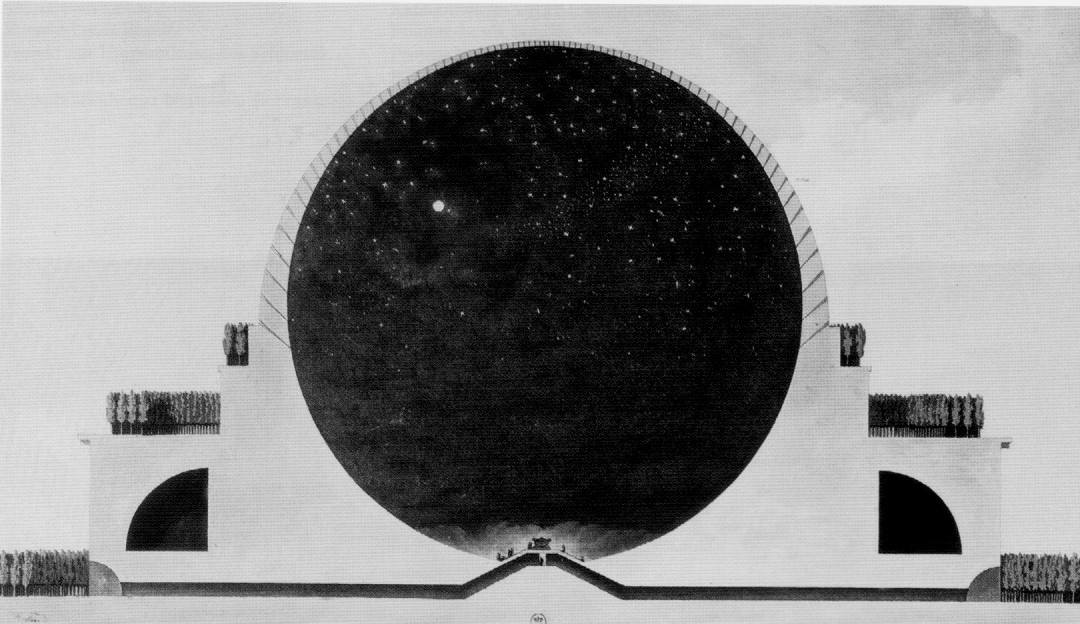
     It seems that Lyouns was patenting the idea for being able to ascend a hollow globe to a what would seem to be a redundant lighthouse (certainly there could have been some other structure a little more appropriate or crown-y) at the top, though I know I have seen several earlier visionary drawings about such a beast. One of these ideas belonged to Etienne Boullee (1728-1799), who designed a great hollow sphere for a cenotaph for Newton—Boullee however did not muck up the interior of his space with a massive stair structure, and kept it simple, with his folks milling about on the ground enjoying what was supposed to be an internal night sky.  Some of the others are pre-patent era, though I do recall one of a hollowed-globe interior for viewing a moving diorama that was definitely of the patent era–perhaps that inventor simply didn’t patent the apparatus.

    [The interior of the Lyoun globe, which I guess represent a giant winding staircase.]

    The Lyoun bit also reminds me of the Crystal Palace of 1851–rather, of a cartoon for the Crystal Palace, featuring the Palace at the top of a globe that was fully and completely, falling-off-the-sides inhabited.  Which makes it a bit different from the globe of Lyoun, which seems as though it could’ve been inhabited on the inside, only, and which steers us exactly to the opposite (?) of the Earth’s-Interior-Earth business.  After all, I started talking about other stuff and civilizations living underground, inside the Earth, possibly inside a massive hollowed out section of the Earth. 

    (Finding the top of the world was easier in 1851–at least to this illustration, showing the Crystal Palace of the Great Exhibition of 1851 sitting firmly in place above all. I can imagine that if you were sitting in Hyde Park along with the 1851-foot long building, it would be easy to think that you were indeed at the top of the food chain.  The structure was the crowning achievement of the  Exhibition:  it was almost one million feet under iron and wood and glass, and could hold tens of thousands of people who could view the enormous gardens housed there.)

    I’m talking about Jules Verne and his journey to the center of the Earth, and H.G. Well’s Morlocks, and a dim memory of Superman’s Mole Men, and E.R. Burrough’s Pellucidar sitting at some great depth below the Earth, and on and on, back into the misty past, past hollow Earth theories of even some great men like Edmond Halley, and back into mythological and anthropological stories of great antiquity.  But those stories will have to wait for a later tell.
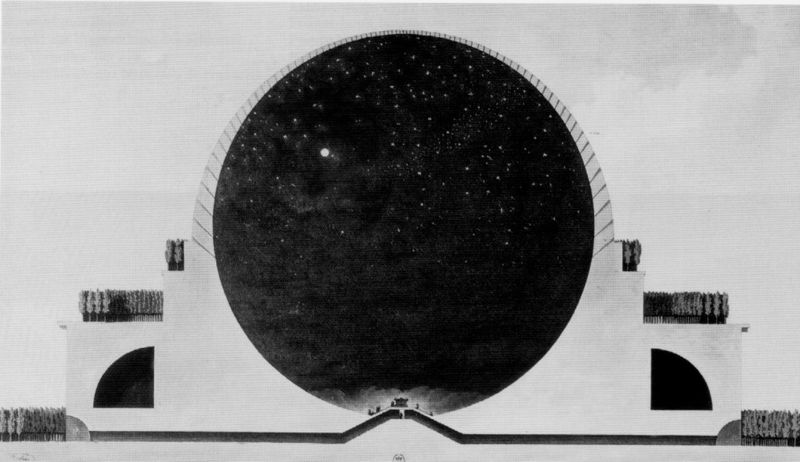
    Boulle newton

    [Boullee’s cenotaph for Newton.]

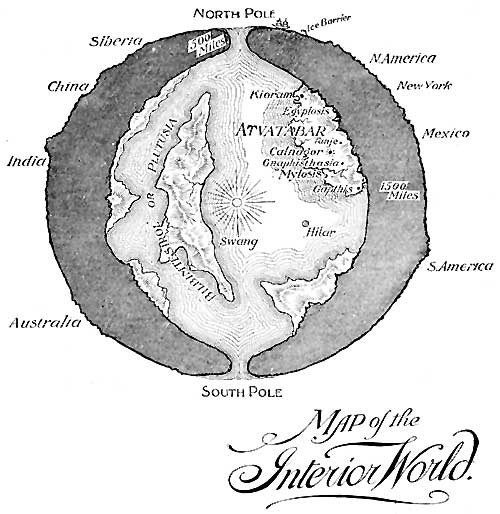
    One bit I’d like to point out is this extraordinary leap of imagination, an actual map of the interior civilization of the Earth provided by William R. Bradshaw to the readers of his Goddess of Atvatabar, which was published in 1892.  The story itself seems terribly purple and looks like a very difficult read–but the pictures are interesting in their own rippling ways.  And then there’s the case of the map–one of the very few I can think of that depict a civilization inside our own homey Earth. (I’d mention others but I can’t think of any straight away.)
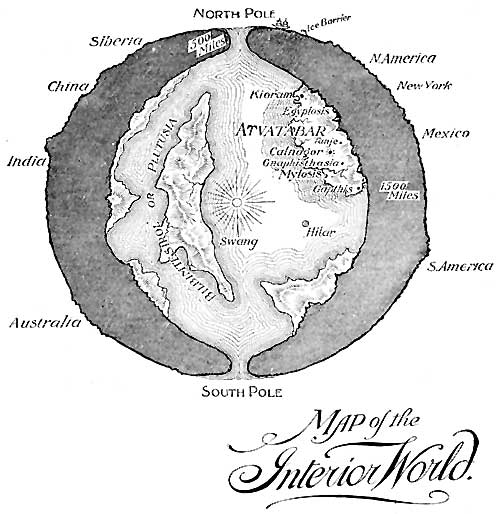
      Earth Interior William BRadshaw

    [Map of the Interior World, William Bradshaw. Source: Project Gutenberg, here: http://www.gutenberg.org/files/32825/32825-h/32825-h.htm]

    Another example of a map of interior Earths was brought to my attention by Rebekah Higgitt (of the excellent Teleskopos blog ), who sent me to the Petri Dish blog (of Katherine Pandora, and her post “Hollow Heads, Science, Fantasy, and What’s as Plain as the Earth Beneath our Feet”) and the internal Earth of WIlliam Reed (in 1906, illustrating his Phantom of the Poles):

    Reed's Hollow Earth

    And yet a third example, making my way through the Petri Dish article and found at the website of Engines of our Ingenuity by John Lienhard (from his post 2180, “Hollow Earth”):

    Americus Symmes' Hollow Earth

    [Symmes’ Hollow Earth published long after his death by his son, Americus Symmes.]

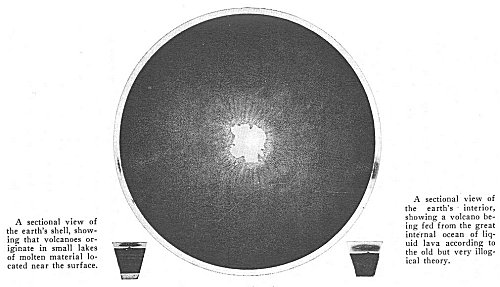
    And then another example, this from Marshall B. Gardiner, A Journey to Earth’s Center. 1920, which also shows the interior “central sun”:

    And a cross-section of the Earth from Gardiner:
    http://www.sacred-texts.com/earth/jei/img/36400.jpg

    The literature of this hollow Earth business is very wide and long and not very deep, and includes a fair amount of scientific-y whoo whoo.  The sci-fi part of it looks mor eintereting, though from the little that I have read now most of it is very tight-fisted in the good-writing department.


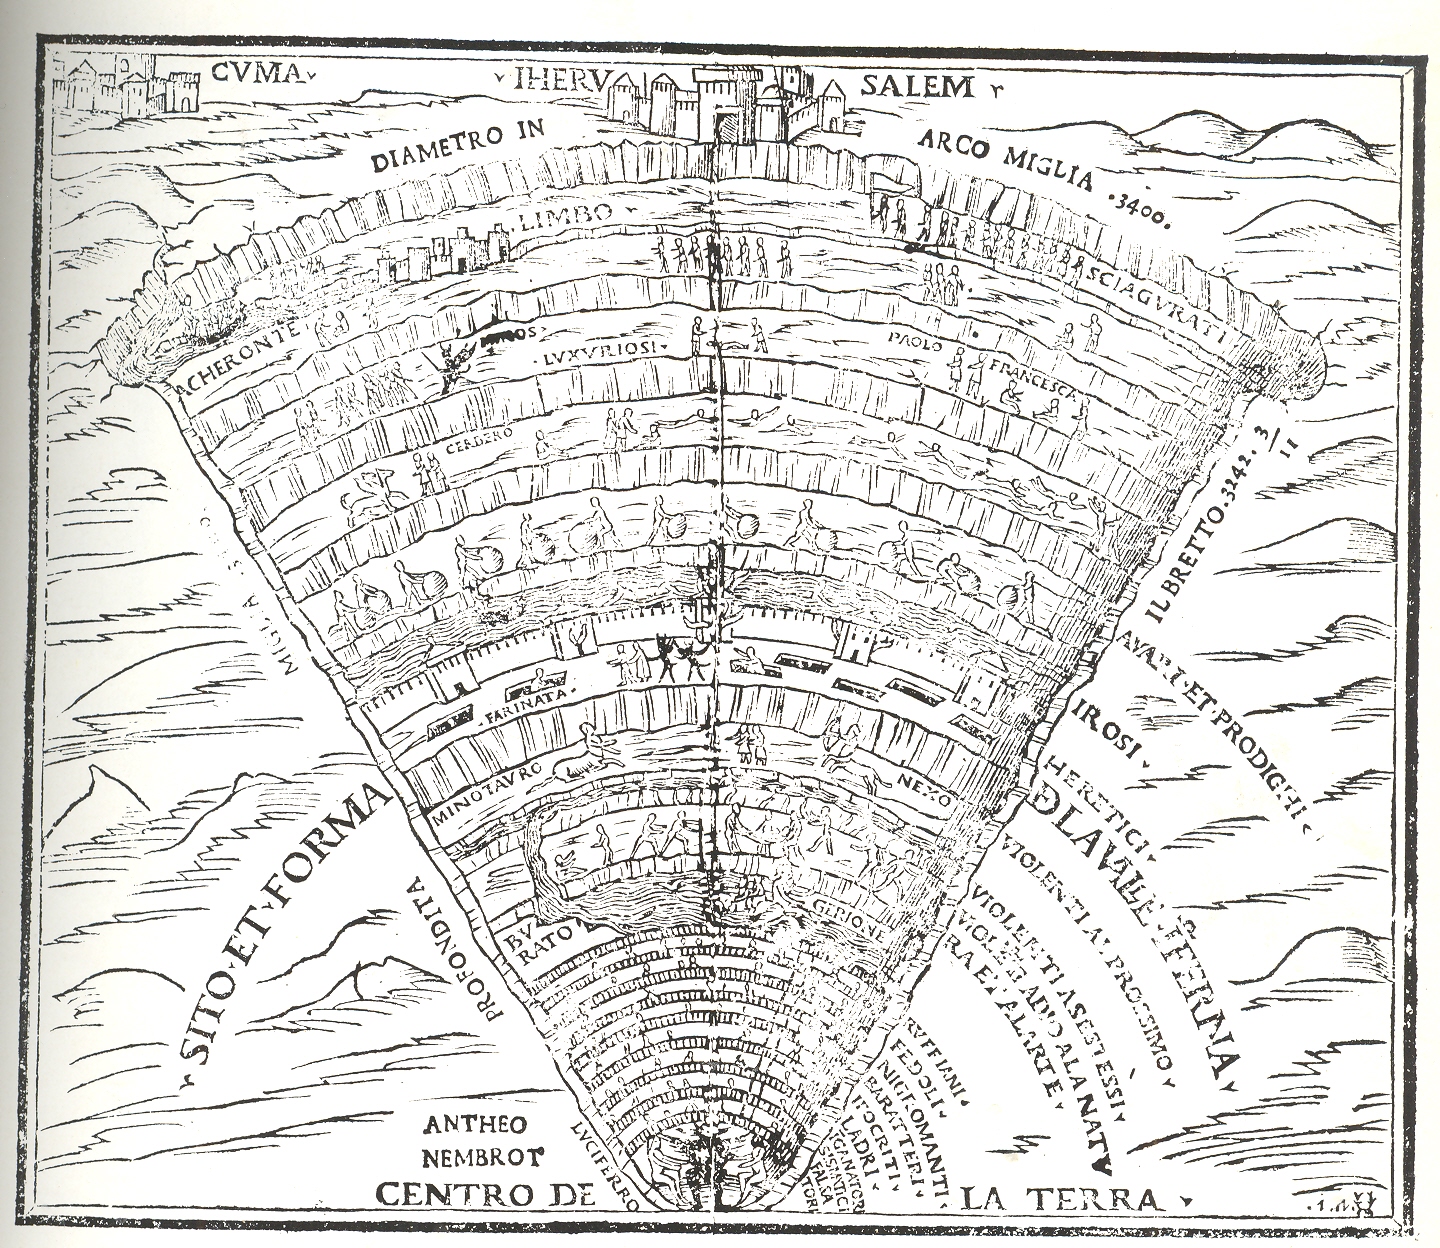
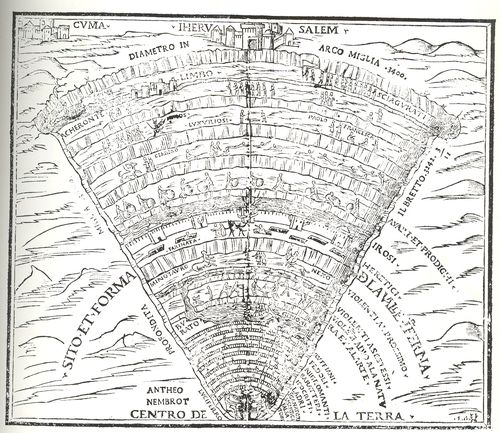
    This maps talk excludes Inferno maps like the following, for example–obviously–as there are many:
    Blog--feb 9--dante

    The classic sort of image may be something like this fantastic depiction of the Inferno of Dante (shown here in the Comedia published in Venice by Gregorio de Gregoriis in 1515.

    I should guess that there’s ample room for a collection of inner-Earth civilizations, and perhaps that will come to pass.

    A few more of the patent images for the Lyouns patent:

  • Hobo Signs Map, 1870

    JF Ptak Science Books   Post 1750

    Bloghobo_b200

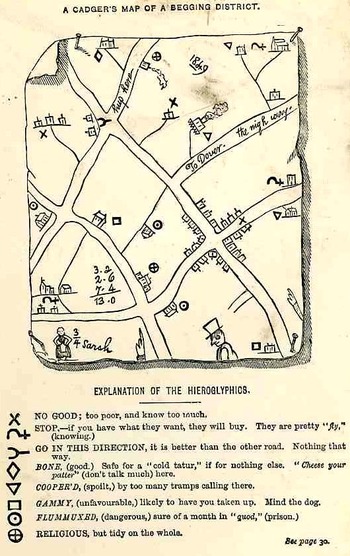
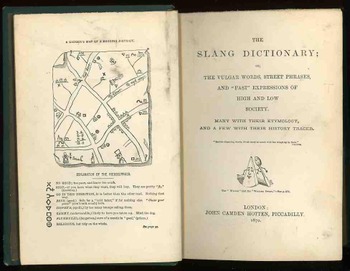
    This is the frontispiece to the delightful work with the luscious title of The Slang Dictionary; or, the Vulgar Words, Street Phrases and Fast Expression of High and Low Society… printed in London by John  Camden Hotten, in 1870.  It is a hobo or “cadger” (“a  mean or vulgar fellow who would rather live on other people than work for himself”)  map (or the map of “a tribe of vagabonds”) of Maidstone, in Kent, drawn by a “screever” (a sidewalk chalk artist who normally would draw religious images for money), and showing the various chalked and etched signs that the hoboes (“and other mendicant marks”)  would leave for one another, being a key to the town, for what was practicable, safe, dangerous, and the like.

    Recorded antiquarian hobo and tramp symbols like these are really quite rare, given their ephemeral nature to begin with; of course the need to record these obscure signs by polite society was not on a high order.  There are many indications that signs such as these existed, but not many illustrations.  For example in the book The Triumph of Wit; or, Ingenuity Display’d in its Perfection, edited by John Shirley. (1724), as well as works by Holyland and Borrow there is a description of English gypsies and their travels, and a short description of their use of boughs and sticks, set out for each other, so that a duplication of effort by different bands or families would not occur.

    (The figure of the woman, wonderfully named “3/4 Sarah”, probably connects this Sarah to a sort of popular dance.)Bloghobo_a199_2

    Hotten also published the following interesting and title-bending work in 1874:  THE ORIGINAL LISTS OF PERSONS OF QUALITY;  EMIGRANTS; RELIGIOUS EXILES; POLITICAL REBELS; SERVING MEN SOLD FOR A TERM OF YEARS; APPRENTICES; CHILDREN STOLEN; MAIDES PRESSED; AND OTHERS WHO WENT FROM GREAT BRITAIN TO THE  AMERICAN PLANTATIONS 1600-1700, WITH THEIR AGES, THE LOCALITIES WHERE THEY FORMERLY LIVED IN THE MOTHER COUNTRY, THE NAMES OF THE SHIPS IN WHICH THEY EMBARKED, AND OTHER INTERESTING PARTICULARS.


  • Travel Time in the Young Republic, 1800-1857

    JF Ptak Science Books   Post 1738    [Part of a series on the Display of Quantitative Information]

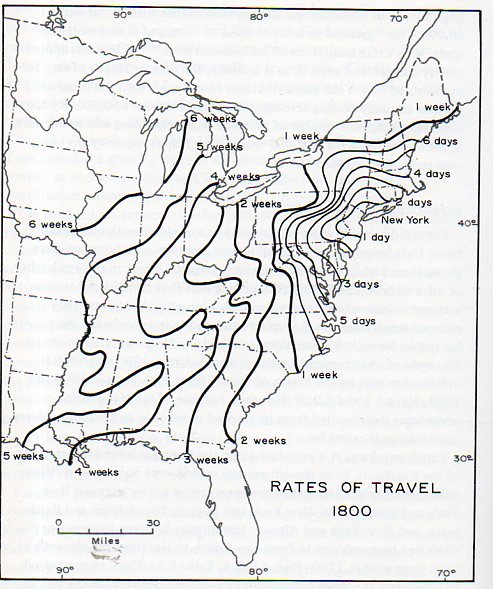
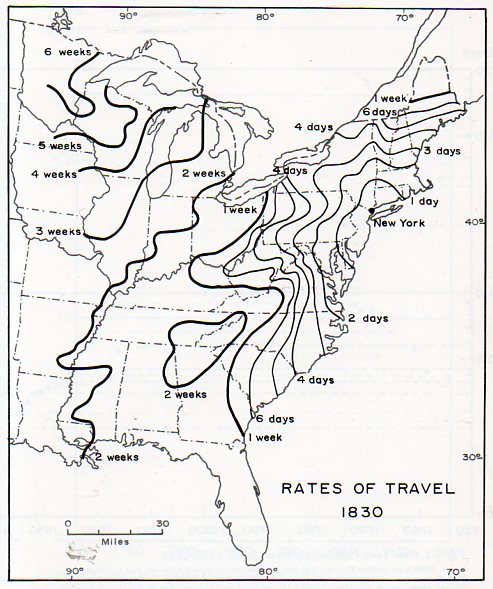
    I wanted to pass along these very interesting maps that appear in Allan R. Pred Urban Growth and the Circulation of Information, 1790-1840 (Harvard, 1973) because they give a quick and elegant view of how long it took to get to various parts of the country in the first part of the 19th century. 

    First, Rates of Travel, 1800:

    Travel time 1317
    and its complement, Rates of Travel 1830:

    Travel time 2316[Note:  all travel time based on starting  point in New York City.]

    Its interesting to see with just improvements in travel excluding the introduction of railroads and (for the most part) canals that travel time was basically cut in half in about thirty years’ time.  For example, in 1800 it would take roughly four weeks to get to New Orleans, and then six weeks to arrive in Iowa and the Upper Peninsula.  By 1830, that time was two weeks to NO, and three for the other two locations.  In 1800, it was a five day trip to the northern Outer Banks in North Carolina; that would be cut to two days by 1830.  The trip in 1800 to the vicinity of Savannah and the northern part of Florida was a two week ordeal; by 1830, that time had fallen to 6/7 days.  The Mississippi was reachable in five weeks in 1800; in 1830, that time was cut to two weeks.  This as I said would all change drastically over the next three decades, once the railroad system became slightly mature.

    And here, expanded to 1857:

    By 1857 one day’s travel time has been blasted to a ring encompassing the southern half of Maine, partially into Ohio and south into the northern part of North Carolina.  Two days of travel will get the traveller deep into Michigan and parts of Wisconsin, and half-way through North Carolina and South Carolina (excluding the mountain region in Western NC).  Three days will now get us to northern Florida, halfway through Georgia and Tennessee, and into the Midwest, past the Mississippi River. Beyond the basic reach of the railroad at this point is the rest of the country, and harder going, though one week of travel will get you deep into the central part of the country, where with some difficulty you would be able to find your way to southern California in three weeks, and the Pacific regions of Washington Territory in six weeks–basically, an entirely new world of travel and the spread of goods, service and information, not the least of which was aided by the spread of the railroads, which increased from 3,000 miles of track in 1840 to more than 30,000 in 1860.

    Again, I really just wanted to share this display of information because I have found them to be useful in the past, and the info doesn’t seem to be all that wide-spread. 

     My source for the maps has been varied from web sources, but the original work seems to have been published in Charles O. Paullin and John Wright, Atlas of the Historical Geography of the U.S., published by the Carnegie Institute of Washington, D.C. (1932), pages 138a, 138b, 138c, 138d.


  • The Porcineographic Map of the United States, ca. 1876

    JF Ptak Science Books   Quick Post

    This porcineograph

    This semi-magnificent map, The Porcineograph, produced by the Forbes Lithographic Manufacturing Company of Boston in 1876 or so, defines the states and territories of the U.S. in terms of their regional foods.  Being a vegetarian of twenty years or so, very little appeals to me, though the foods do at least sound interesting.  The again, somne of it sounds fantastically bad, like the selections for Wisconsin (Boiled Hog’s Heads, Hulled Barley and Blood Pudding).

    Arizona: Jerked Beef and Greasy Doings; California: Bear Steaks, Grapes and Ham Sandwich; Connecticut:  Shad, Hog’s Head Cheese and Gingerbread;  Florida: Turtle Soup, Oranges and Pickled Trotters; Kansas: Buffalo Tongues, Paw-Paw and Ham; Maine: Lobsters, Cunners, Pork-Apple-Pie and Baked Indian; Louisiana😛 Gumbo Soup, Poussoneau and Larded Beef; Minnesota: Gopher, Stewed Pork and Molasses; Mississippi: Persimmon, Bacon and Hoe Cake;  New Jersey, Pork Pie, Peaches and Pigeons; New York, Roast Pig, Fried Oysters, Strawberry Shortcake & Uninvestigated Drinks; Ohio: Sugar-cured Ham, Cream Cheese and Catawba Grapes; Tennessee: “Uncle Ned”, Bacon Roasting Ears and Corn Cake; Texas: Wild Steer and Corn Dodgers wobbled in Pork Fat; Vermont: Hasty Pudding, Maple Syrup, Succotash and Pork; Wisconsin: Boiled Hog’s Heads, Hulled Barley and Blood Pudding.

    [Map source:  the Library of Congress.]