A Daily History of Holes, Dots, Lines, Science, History, Math, Physics, Art, the Unintentional Absurd, Architecture, Maps, Data Visualization, Blank and Missing Things, and so on. |1.6 million words, 7500 images, 4.9 million hits| Press & appearances in The Times, Le Figaro, Mensa, The Economist, The Guardian, Discovery News, Slate, Le Monde, Sci American Blogs, Le Pont, and many other places… 5000+ total posts since 2008.

Category: Maps, Cartography, History of Mapmaking

  • On the Heightiest Heights of Traffic Height

    JF Ptak Science Books  Quick Post

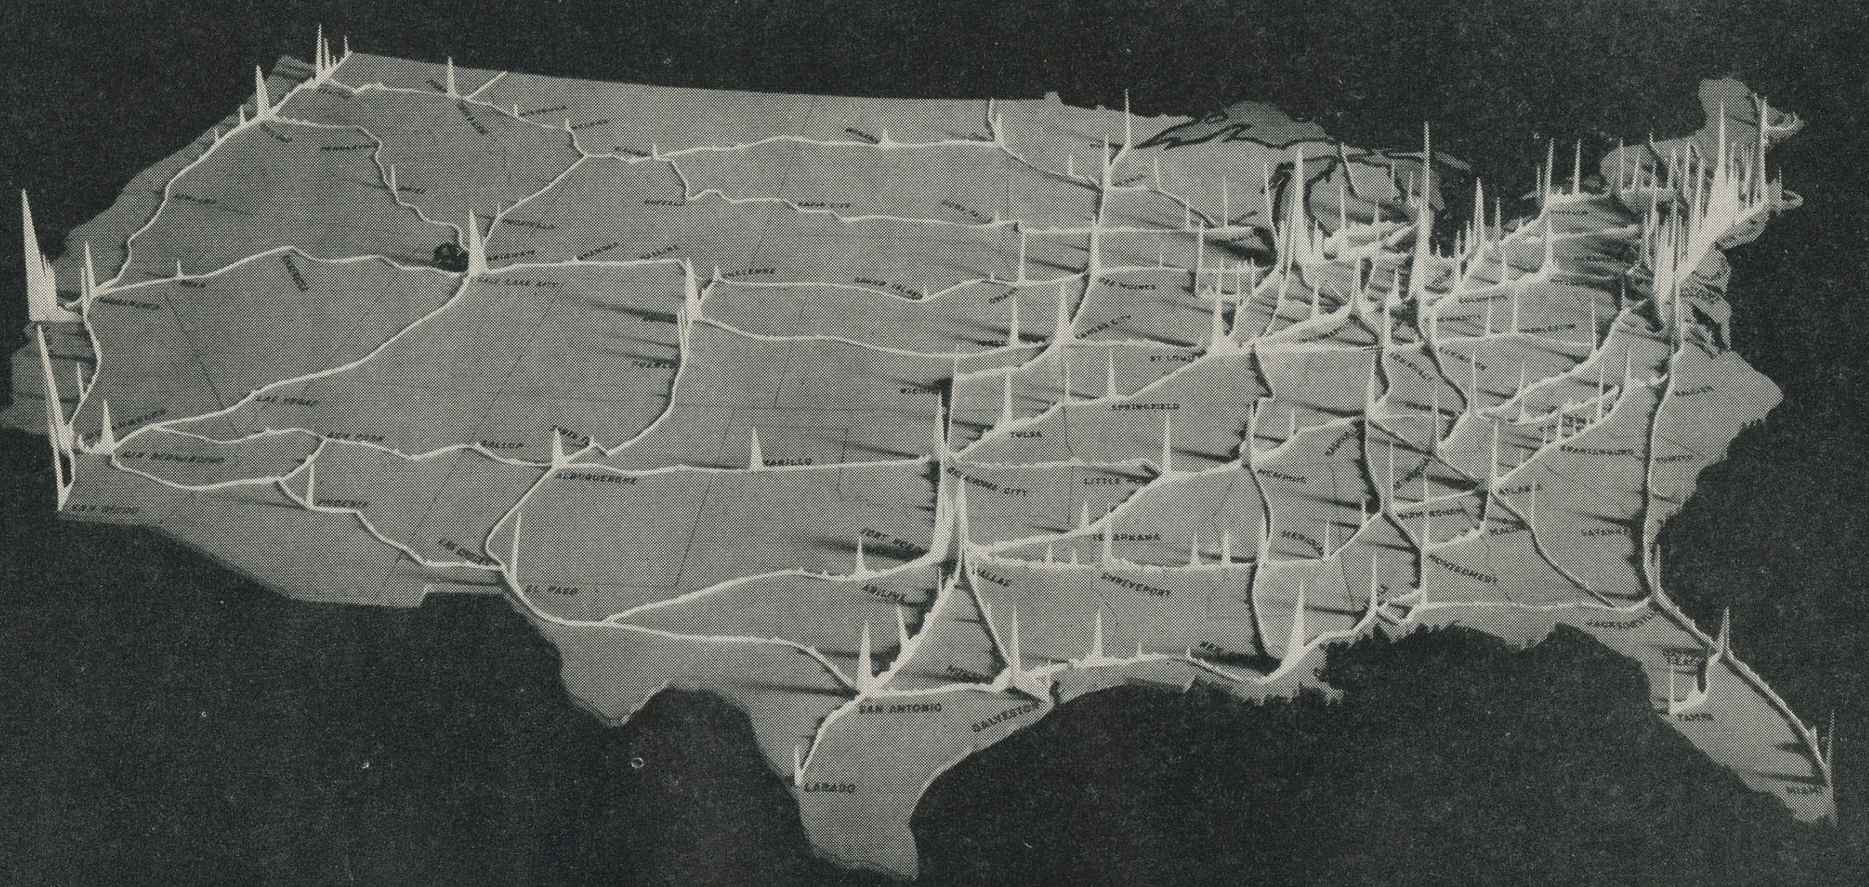
    I found this fabulous map of concentrations of U.S.A. (1944) traffic flow somewhere in the hinterlands. When I started to research its origin I found that the background and story of the map and its source is dealt splendidly by Eric Fischer in a 26-photo Flickr set here: https://www.flickr.com/photos/walkingsf/albums/72157632238833323 


    Map height of traffic

    Map height of traffic

    [Source: Interregional Highways: Message from the President of the United States Transmitting a Report of the National Interregional Highway Committee, Outlining and Recommending a National System of Interregional Highways, January 12, 1944.]


  • Away, Down the Dark Tunnel of Creation….

    JF Ptak Science Books   Quick Post

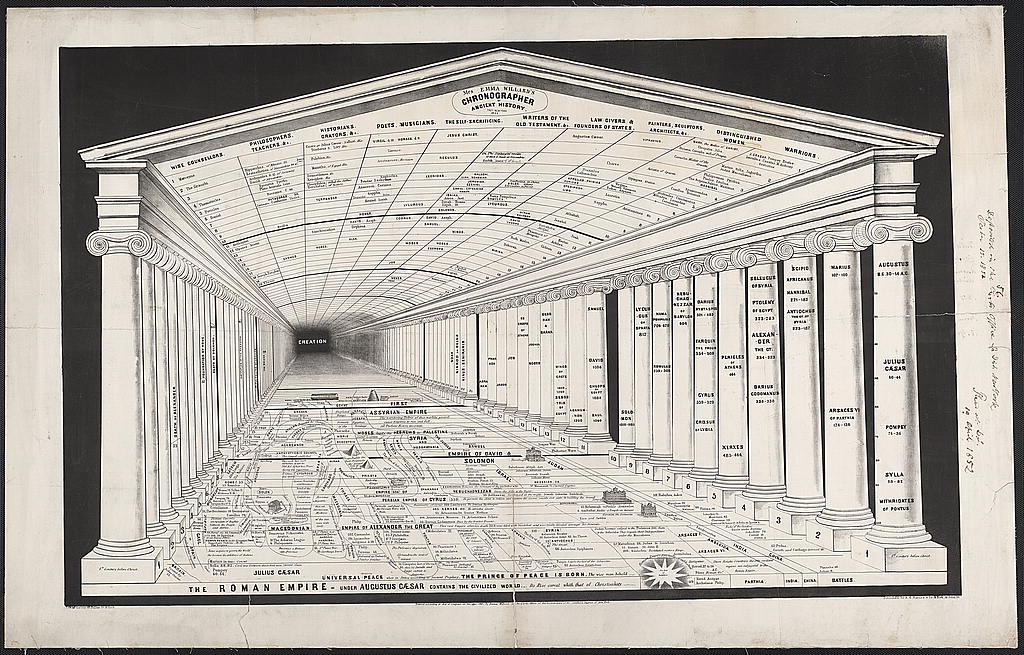
    Infographic Emma Willard detail

    Emma Willard (1819-1870) has been described as an “apostle” of female higher education in the U.S. She wrote some interesting texts on American history, concentrating in the telling of the story by chronology, and using some interesting visual aids to focus the readers’ attention in a condensed manner. She created several memory palaces in her imagery, making it easier and perhaps more elegant for her readers to be able to more easily record the progression of history.

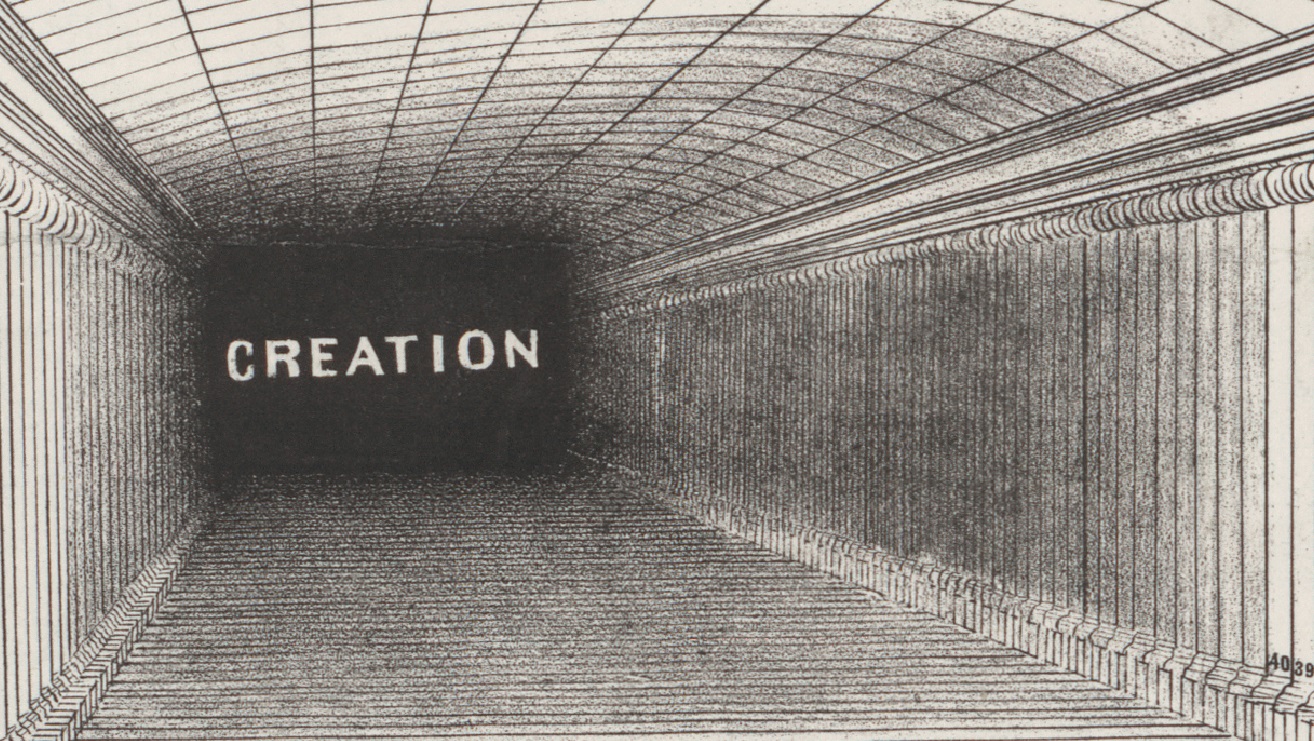
    The “dark tunnel of creation” here is the background of the events of history housed by an ionic temple–in the original (from the Library of Congress) the word “Creation” is really quite small, and then surrounded by a considerable well of darkness, the millennia slipping by without index or notice, until they don’t. 

    And the full image (images via the Library of Congress, http://www.loc.gov/item/2005694445/):

    Infographic emma willard small version

    (Mrs. Emma Willard’s Chronographer of ancient history, published in Troy, New York, printed by lithography via Sarony of NYC.

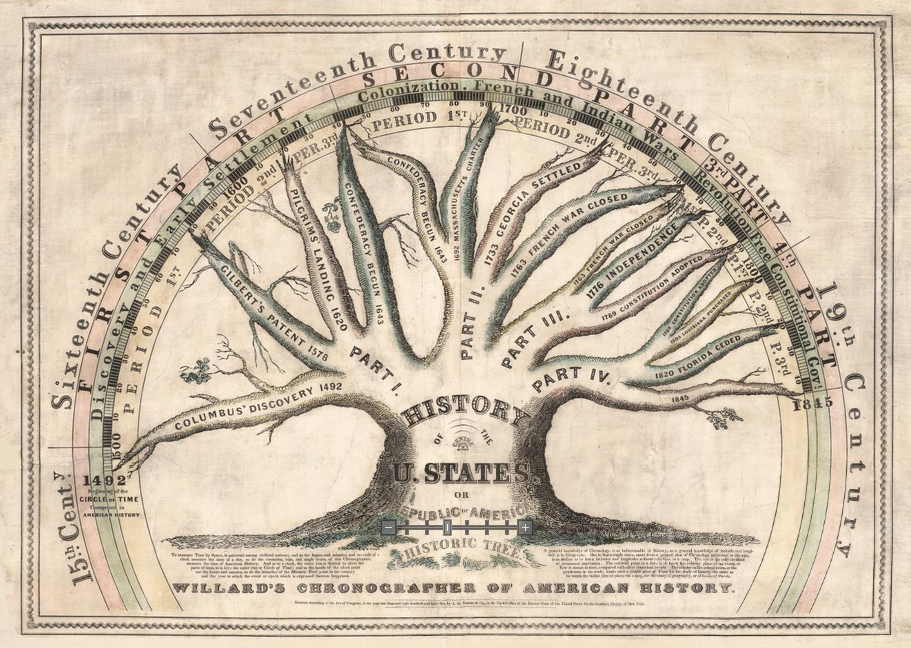
    Emma Willard also produced this beautiful chronological print, meant to be displayed no doubt on a schoolroom wall:

    Willard chronographer of american historyTree of chronology [Source: via DavidRumsey.com maps:  http://www.davidrumsey.com/luna/servlet/detail/RUMSEY~8~1~240521~5512286:Willard-s-Chronographer-of-American?utm_source=hootsuite]


  • Now *That’s* a Front-page Newspaper Map…(1863)

    JF Ptak Science Books  Quick Post

    Georgia map

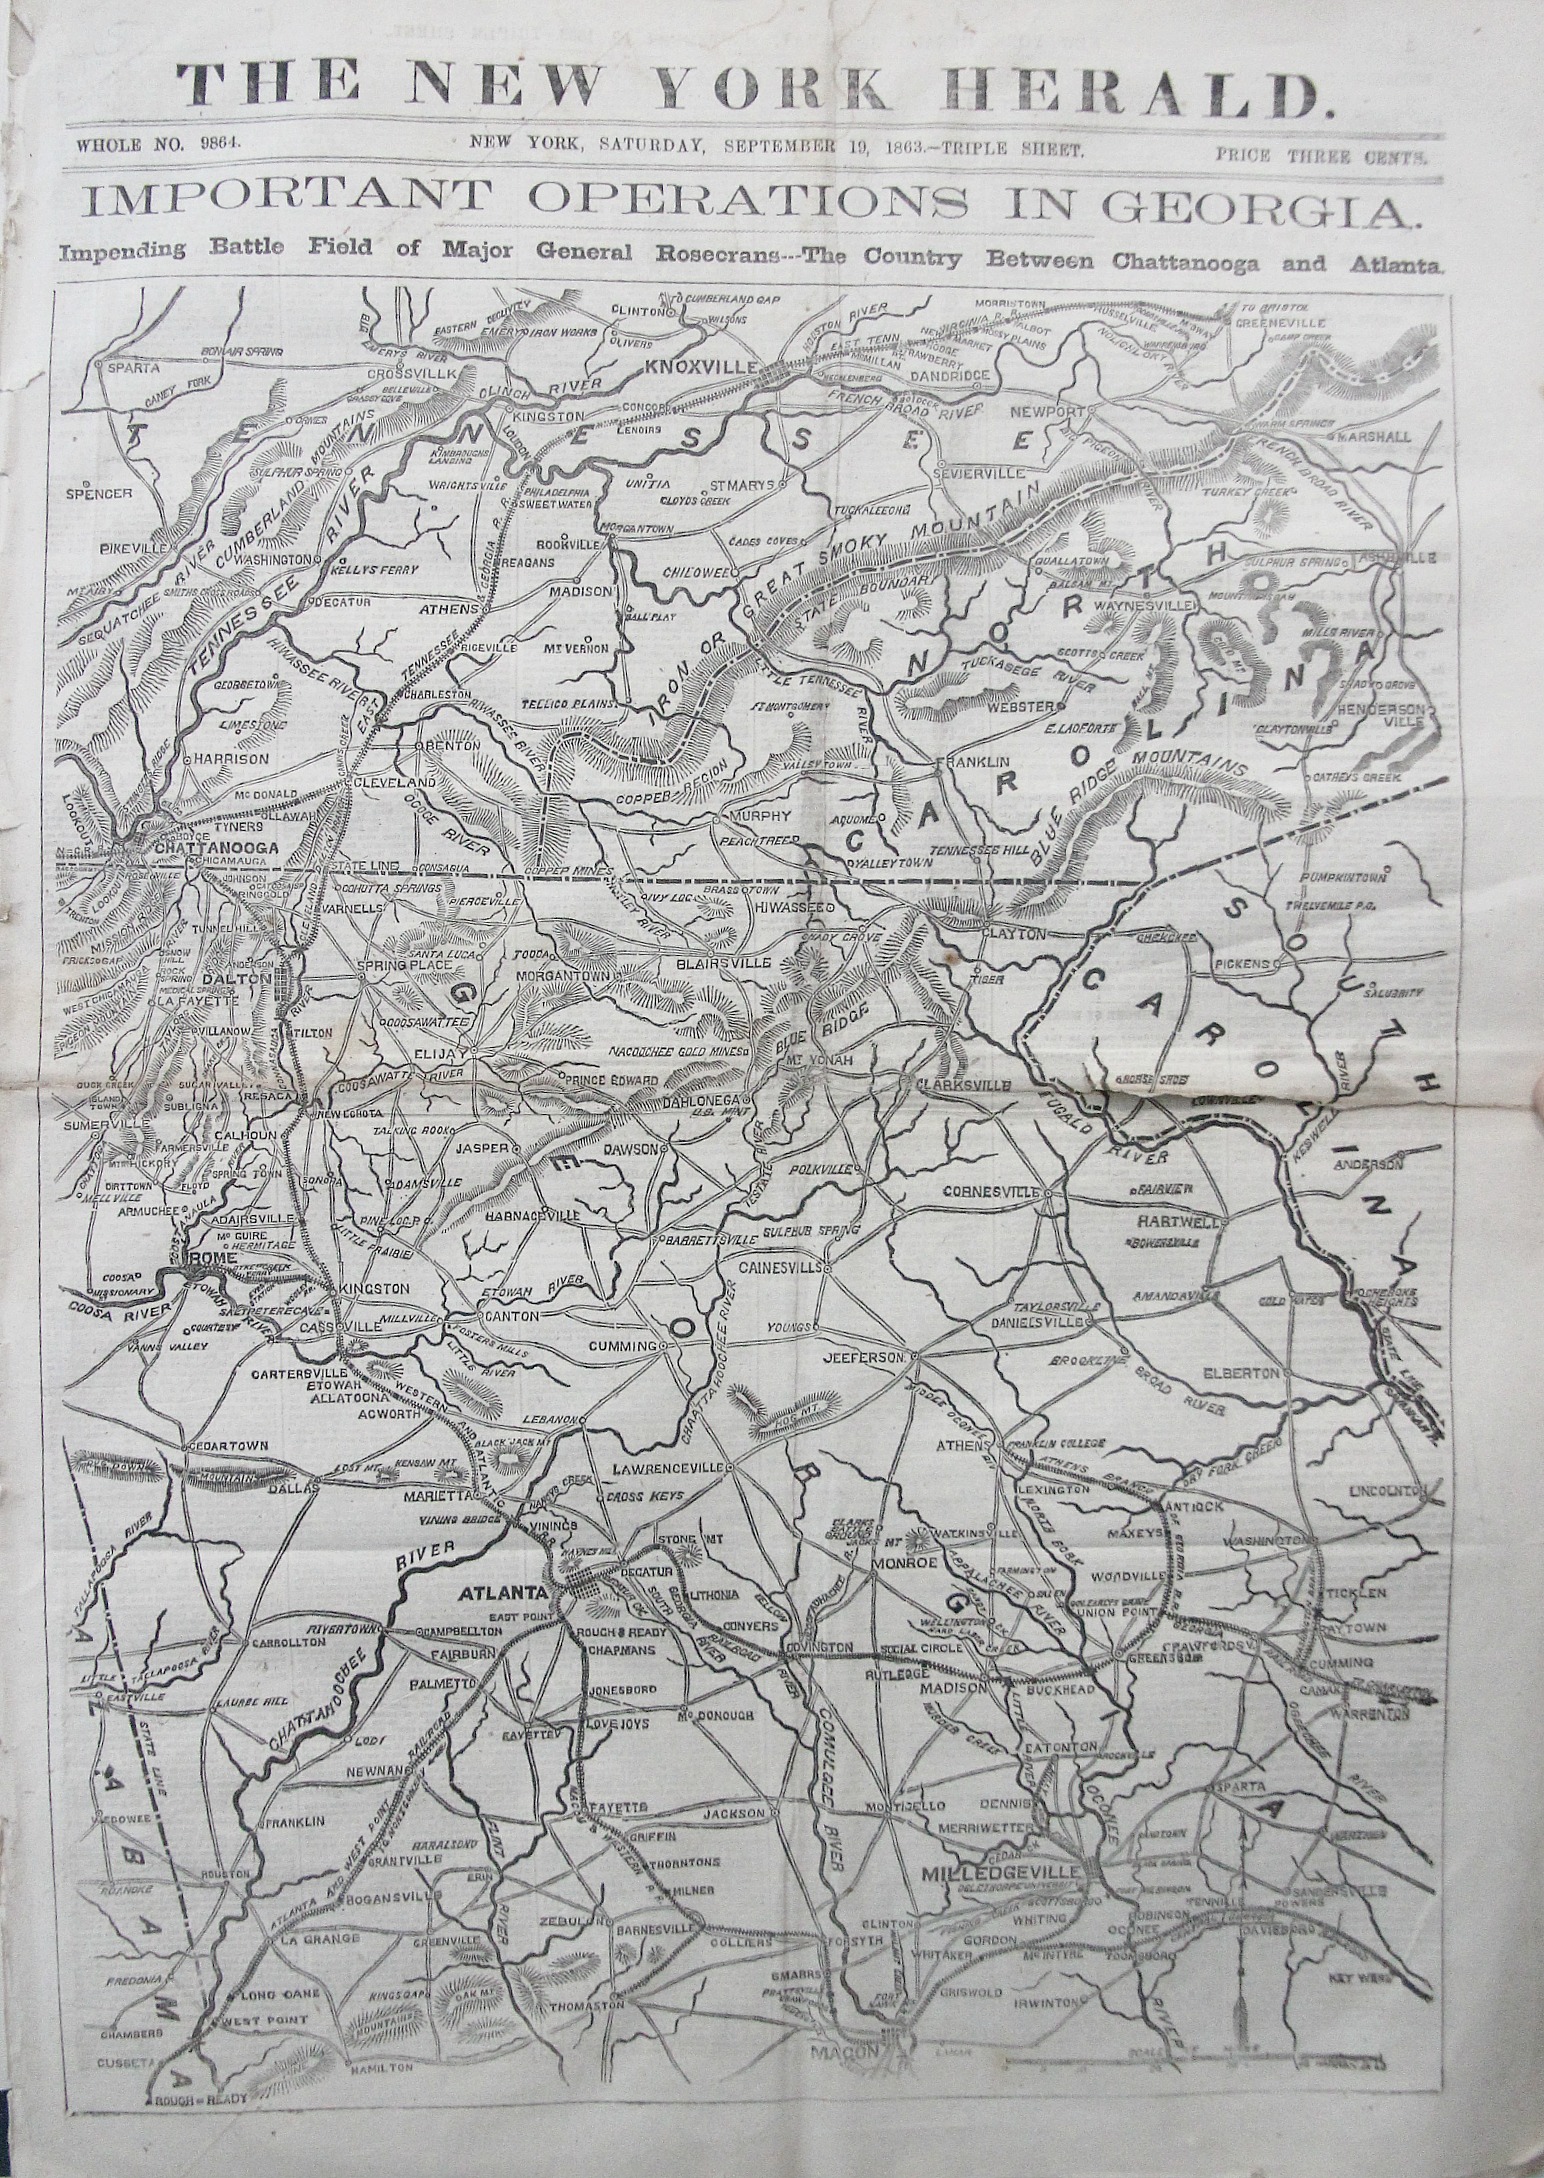
    This fine map popped out at the warehouse today–the New York Herald, September 10, 1863, with a fantastic full-page/front-page map of the theater of war in Georgia (and southern Tennessee and south-western North Carolina), back when newspapers were newspapers.  But the map centers on Georgia, and comes just a week before the second bloodiest battle of the war at Chickamauga. (The town appears right underneath the label for “Chattanooga”.)

    My own Hendersonville appears at the extreme east portion of the map in North Carolina, just north of the South Carolina line.  Most of the mountains seem to not make a very formidable entrance on this map (though Cold Mountain is seen just to the north-west of Hendersonville), and I think it is somewhat deceiving.  I’ve driven the mountains a lot in Western North Carolina and often thought of slogging around the region in the foothills, avoiding all of the mountains that I was driving through which really didn’t show up on this map.  There’s a reason that there wasn’t that much in the way of conflict in this region of WNC, northern SC, and eastern Tennessee–of course there wasn’t much worth winning, but marching through the mountains would have been a major piece of bad country to go through.  

    In any event, this was a good map for northern and central Georgia, introducing northern readers to an advancing front of the war.  


  • An A to Z-ery of Love and its Associative Bits: the Map of Matrimony, 1879

    JF Ptak Science Books   Post 2568

    Rhinoceros nunquam victus ab hoste cedit–the rhino never turns away defeated from the enemy

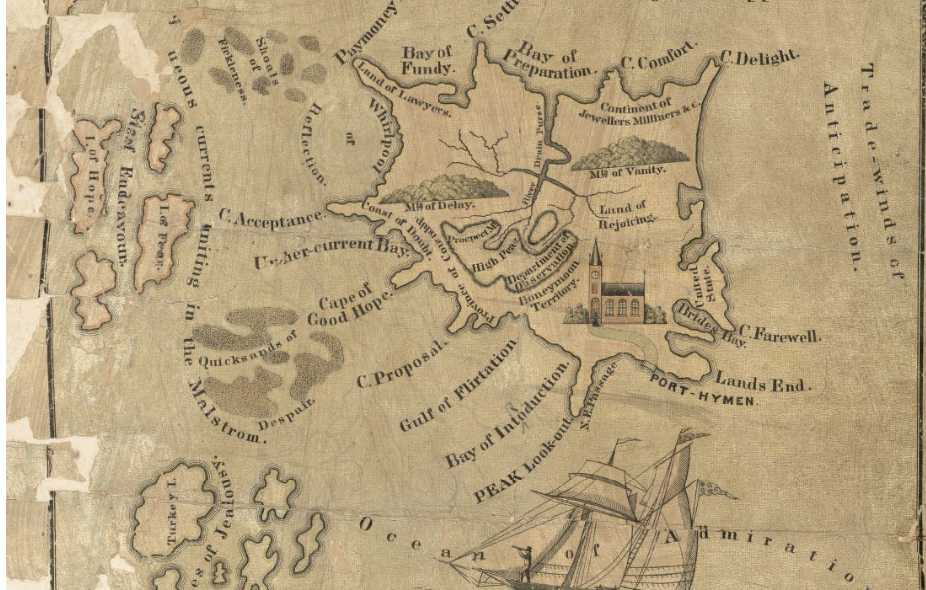
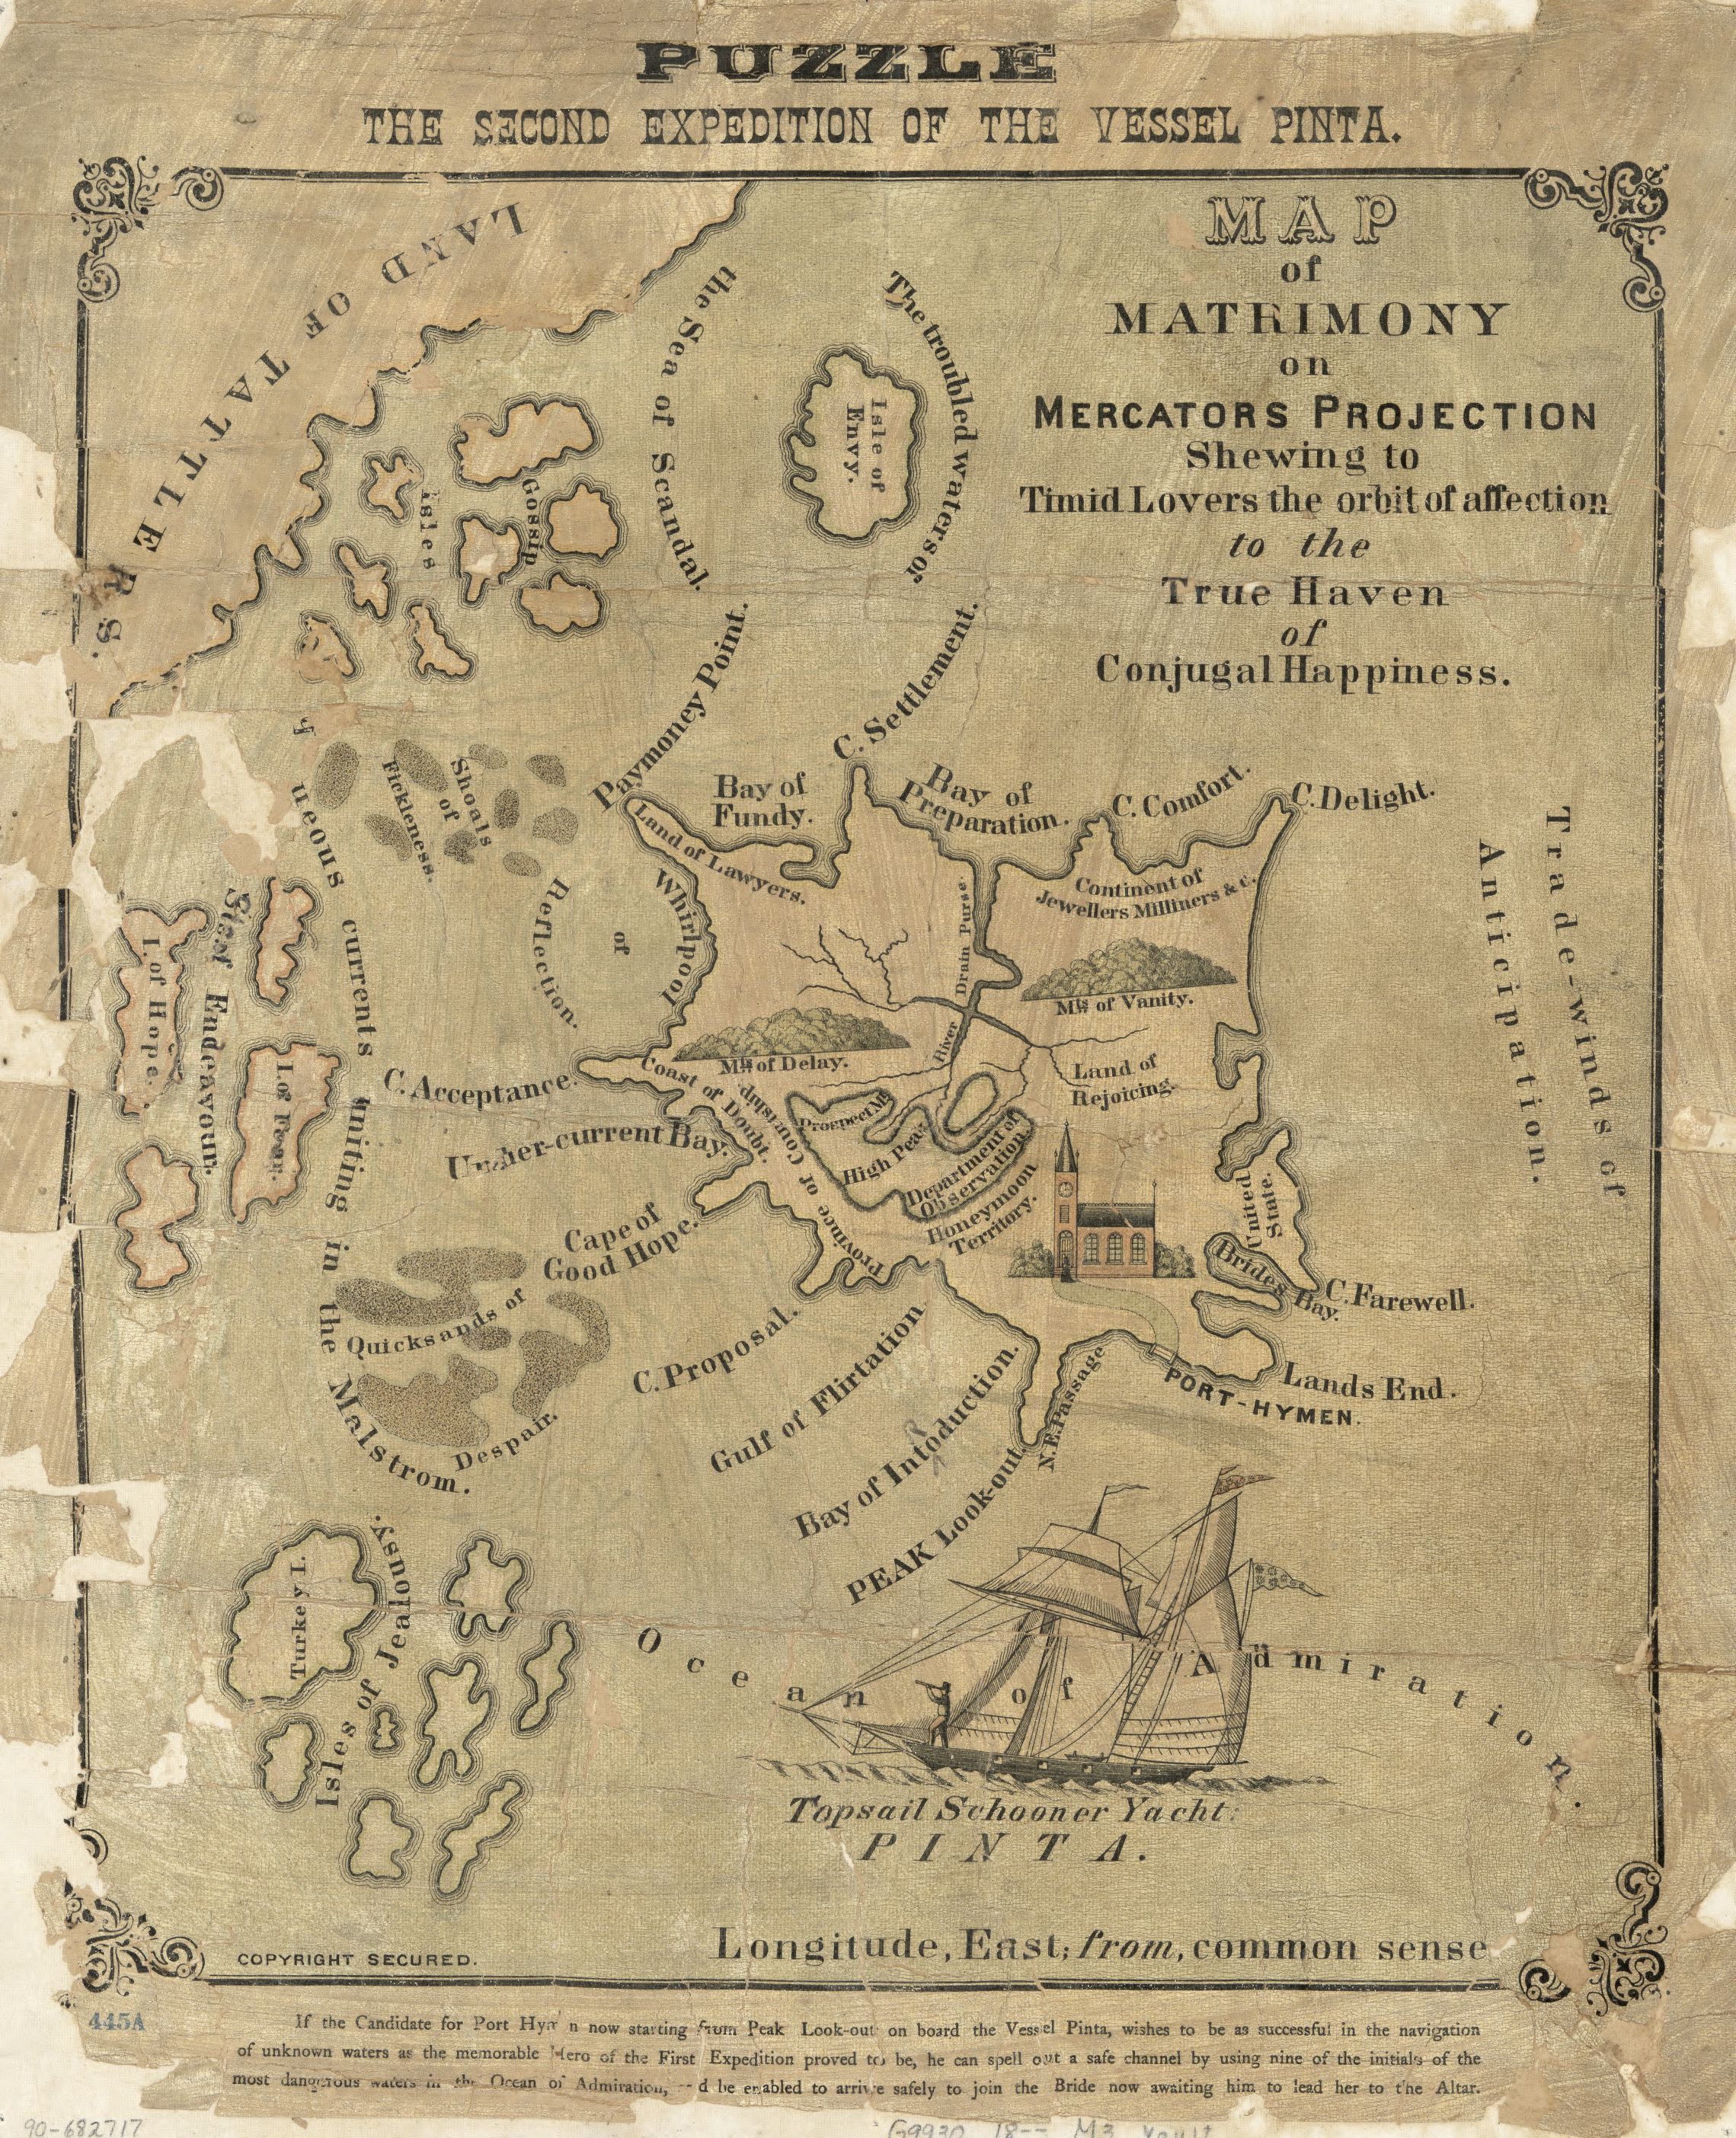
    And so we begin a look an an allegorical map1 of matrimony with an allegorical statement comparing marriage to a rhino–this is a first for me, and it may also be an original application of the epigram to (human) marriage.  I guess in the mind’s eye this looks as though it might be so, given there’s really no possibility of dealing with a charging rhino weather the Big Boy is charging in happiness or fear, anger or love–it is just going to get you.

    The map has a little more guile than this, enumerating the good points of marriage along with some of the bad–surprisingly these states nearly fill an alphabet, which is pretty unusual given that there are only about 50 states and it covers 17 letters (with nothing at all for the last four letters). 

    And so the carto-geographical indulgence of the alphabet of marriage: Acceptance, Cape of; Brides Bay; Comfort, Cape of; Delight, Cape of; Envy Point; Fickelness, Shoals of; Hope, Cape of Good; Introduction, Bay of; Jealousy, Isle of; Lawyers, Land of; Observation Point; Paymoney Point; Reflection, Whirlpool of; Scandals, Sea of; Tattlers, Land of; Undercurrent Bay; Vanity, Mount of.  


    Map of Matrimony[This is clearer when expanded. Source:  the Library of Congress http://www.loc.gov/resource/g9930.ct003856/]

    And the full version:

    Map matrimony large

    Notes

    1. Map of Matrimony on Mercators projection shewing to timid lovers the orbit of affection to the true haven of conjugal happiness. (In upper margin: Puzzle : the second expedition of the Vessel Pinta.)


  • The End is Near for You: Germany, May, 1945

     JF Ptak Science Books   Quick Post

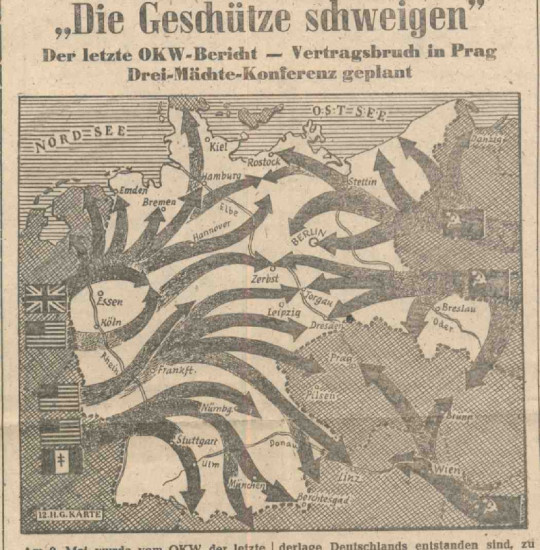
     This incredible map appeared in the May 19, 1945 issue of the Kolnischer Kurier,  It was published in Koln, in German, for Germans, but was printed and distributed as news and propaganda by the advancing U.S. Army.  It is remarkable that at the tail end of the final  offensive there were such forward-thinking people planning in terms like this, dealing with a newly-conquered enemy and trying to organize the thoughts of the population.  

    [The first twelve issues of the Kolnischer Kurier were published by the Americans; the rest of the newspaper (issues 13-62, 1945-6) were published by the British.]

    The map leaves little to the imagination except for what total defeat might bring:

    Kolnischer map

    [Kolnischer Kurier map, 19 May 1945, via Veri Josef Weber  http://veriweber.de/der-pulverdampf-hat-sich-verzogen/]

    The newspaper was extraordinarily, reporting on the Tötungsanstalt Hadamar/Hadamar Euthenasia Center in 1945, the Bergen-Belsen trials at Luneburg in September 1945, the Nuremberg trials (November 1945-September 1946), and much else.  Deserving a separate mention is a piece by Thomas Mann on the German concentration camps published nearly on the day of German surrender–Mann makes explicit, personal claims that all Germans are responsible for the atrocities of the concentration camps.  (Mann would make a radio address on May 8th exactly on the German soul and the concentration camps, and culpability, and blame, and the morality of  the war.  


  • The Illogical in Pursuit of a Logical End–a Note on the Snark.

    JF Ptak Science Books   Post 2537

       "Just the place for a Snark!" the Bellman cried,
              As he landed his crew with care;
         Supporting each man on the top of the tide
              By a finger entwined in his hair."

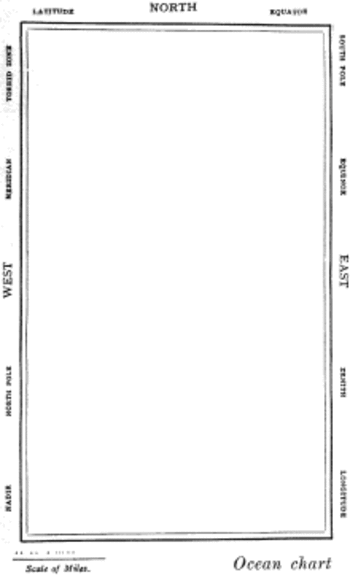
    So opens the semi- and fully-immortal The Hunting of the Snark. an Agony in Eight Fits, by the fully-and-not-partially-immortal Lewis Carroll, which (if it can said what the book is about) is about eight guys whose professions all begin with a letter “b” plus a beaver in search of a Snark.   In the second of eight Fits that comprise this lyrically nonsensical poem, we encounter a map of the route of possibilities taken by the group, this being in the charge of the Bellman. This is not only the finest map illustrating a Fit that exists, it is also (as I’ve stated earlier in this blog) one of the most beautiful maps ever published. It is a beautiful map of nothing, showing nothing, and marking the route of nothing.  Perfect for the Snark story.

    The Bellman himself they all praised to the skies-
    Such a carriage, such ease and such grace!
    Such solemnity too! One could see he was wise,
    The moment one look in his face!

    He had bought a large map representing the sea,
    Without the least vestige of land:
    And the crew were much pleased when the found it to be
    A map they could all understand.

    “What’s the good of Mercator’s North Poles and Equators,
    Tropics, Zones, and Meridian Lines?”
    So the Bellman would cry: and the crew would reply,
    “They are merely conventional signs!

    “Other maps are such shapes, with their islands and capes!
    But we’ve got our brave Captain to thank”
    (So the crew would protest) “that he’s bought us the best-
    A perfect and absolute blank!”
    Snarkmap

    Sometimes there is nothing so fine as something that beautifully illustrates the nothing that isn’t there, and this lovely map, unencumbered of all of the elements and details that define the mapness of something,  perfectly explains the origin of its need.

    The Snark evidently occurred to Carroll while he was out walking on one bright summer day, on a hillside–actually, it was one line of poetry, and it wound up being the closely line of the book.

      In the midst of the word he was trying to say,
              In the midst of his laughter and glee,
         He had softly and suddenly vanished away—-
              For the Snark was a Boojum, you see.
    
                       THE END

    So we had those eight guys and a beaver, setting out from points unknown and going to places not seen.  

    This was all started by that string of poetry that entered Carroll’s head on his walk.  He didn’t know what it meant, and didn’t know where it was going; he did however set out to figure it out for himself.  (“I know not what it meant, the; I know not what it means, now…”1) I find it such a lovely thing that Carroll would spend so much time trying to retrieve the intellectual evidence of where this line came from.  And what his investigation revealed was The Hunting of the Snark.  And at the end of the day, Carroll was no closer to knowing what a Snark was, in spite of all of the writing and commentary and criticism.  Throughout the rest of his life Carroll insisted that he didn’t know what the poem meant, though it could have meant something.  It was supposed to have been a work of nonsense and illogic, but I think it fits with the rest of his work on nonsense and the logic of it, so my best guess is that there was nothing quite so logically in his works as the reach of the illogical in pursuit of a logical end.  

    • Full text of the Snark, here, via Project Gutenberg. http://www.gutenberg.org/files/13/13-h/13-h.htm  Also a pdf with illustrations:  http://www.archive.org/stream/huntingofsnarkan00carruoft#page/n27/mode/2up

    Notes:

    1.  This line occurs in Morton Chase’s Lewis Carroll, a Biography, published by Macmillan in 1995, p 404.

  • Blank and Missing Things: a Map of Missing People of Europe and Russia, 1881

    JF Ptak Science Books  Expanded Post 636 (from 2009)  Blog Bookstore

    The History of Blank, Missing and Empty Things (Thread, #45)

    “Heaven and earth were one form…. (then they were separated from one another…)”

    “The mind is its own place, and in itself can make a heaven of hell, a hell of heaven..” 
    –John Milton, Paradise Lost

    In ancient times the representation of the gods and beliefs was handed from one writer or storyteller to the next, on and on, changes here and deletions there, for many generations.  This practice was possible (necessary?) because there really wasn’t a solitary scripture to follow (as in the Koran or the Bible) and no priestly class to guard and cherish a particular strong story line in all of its barbed details.

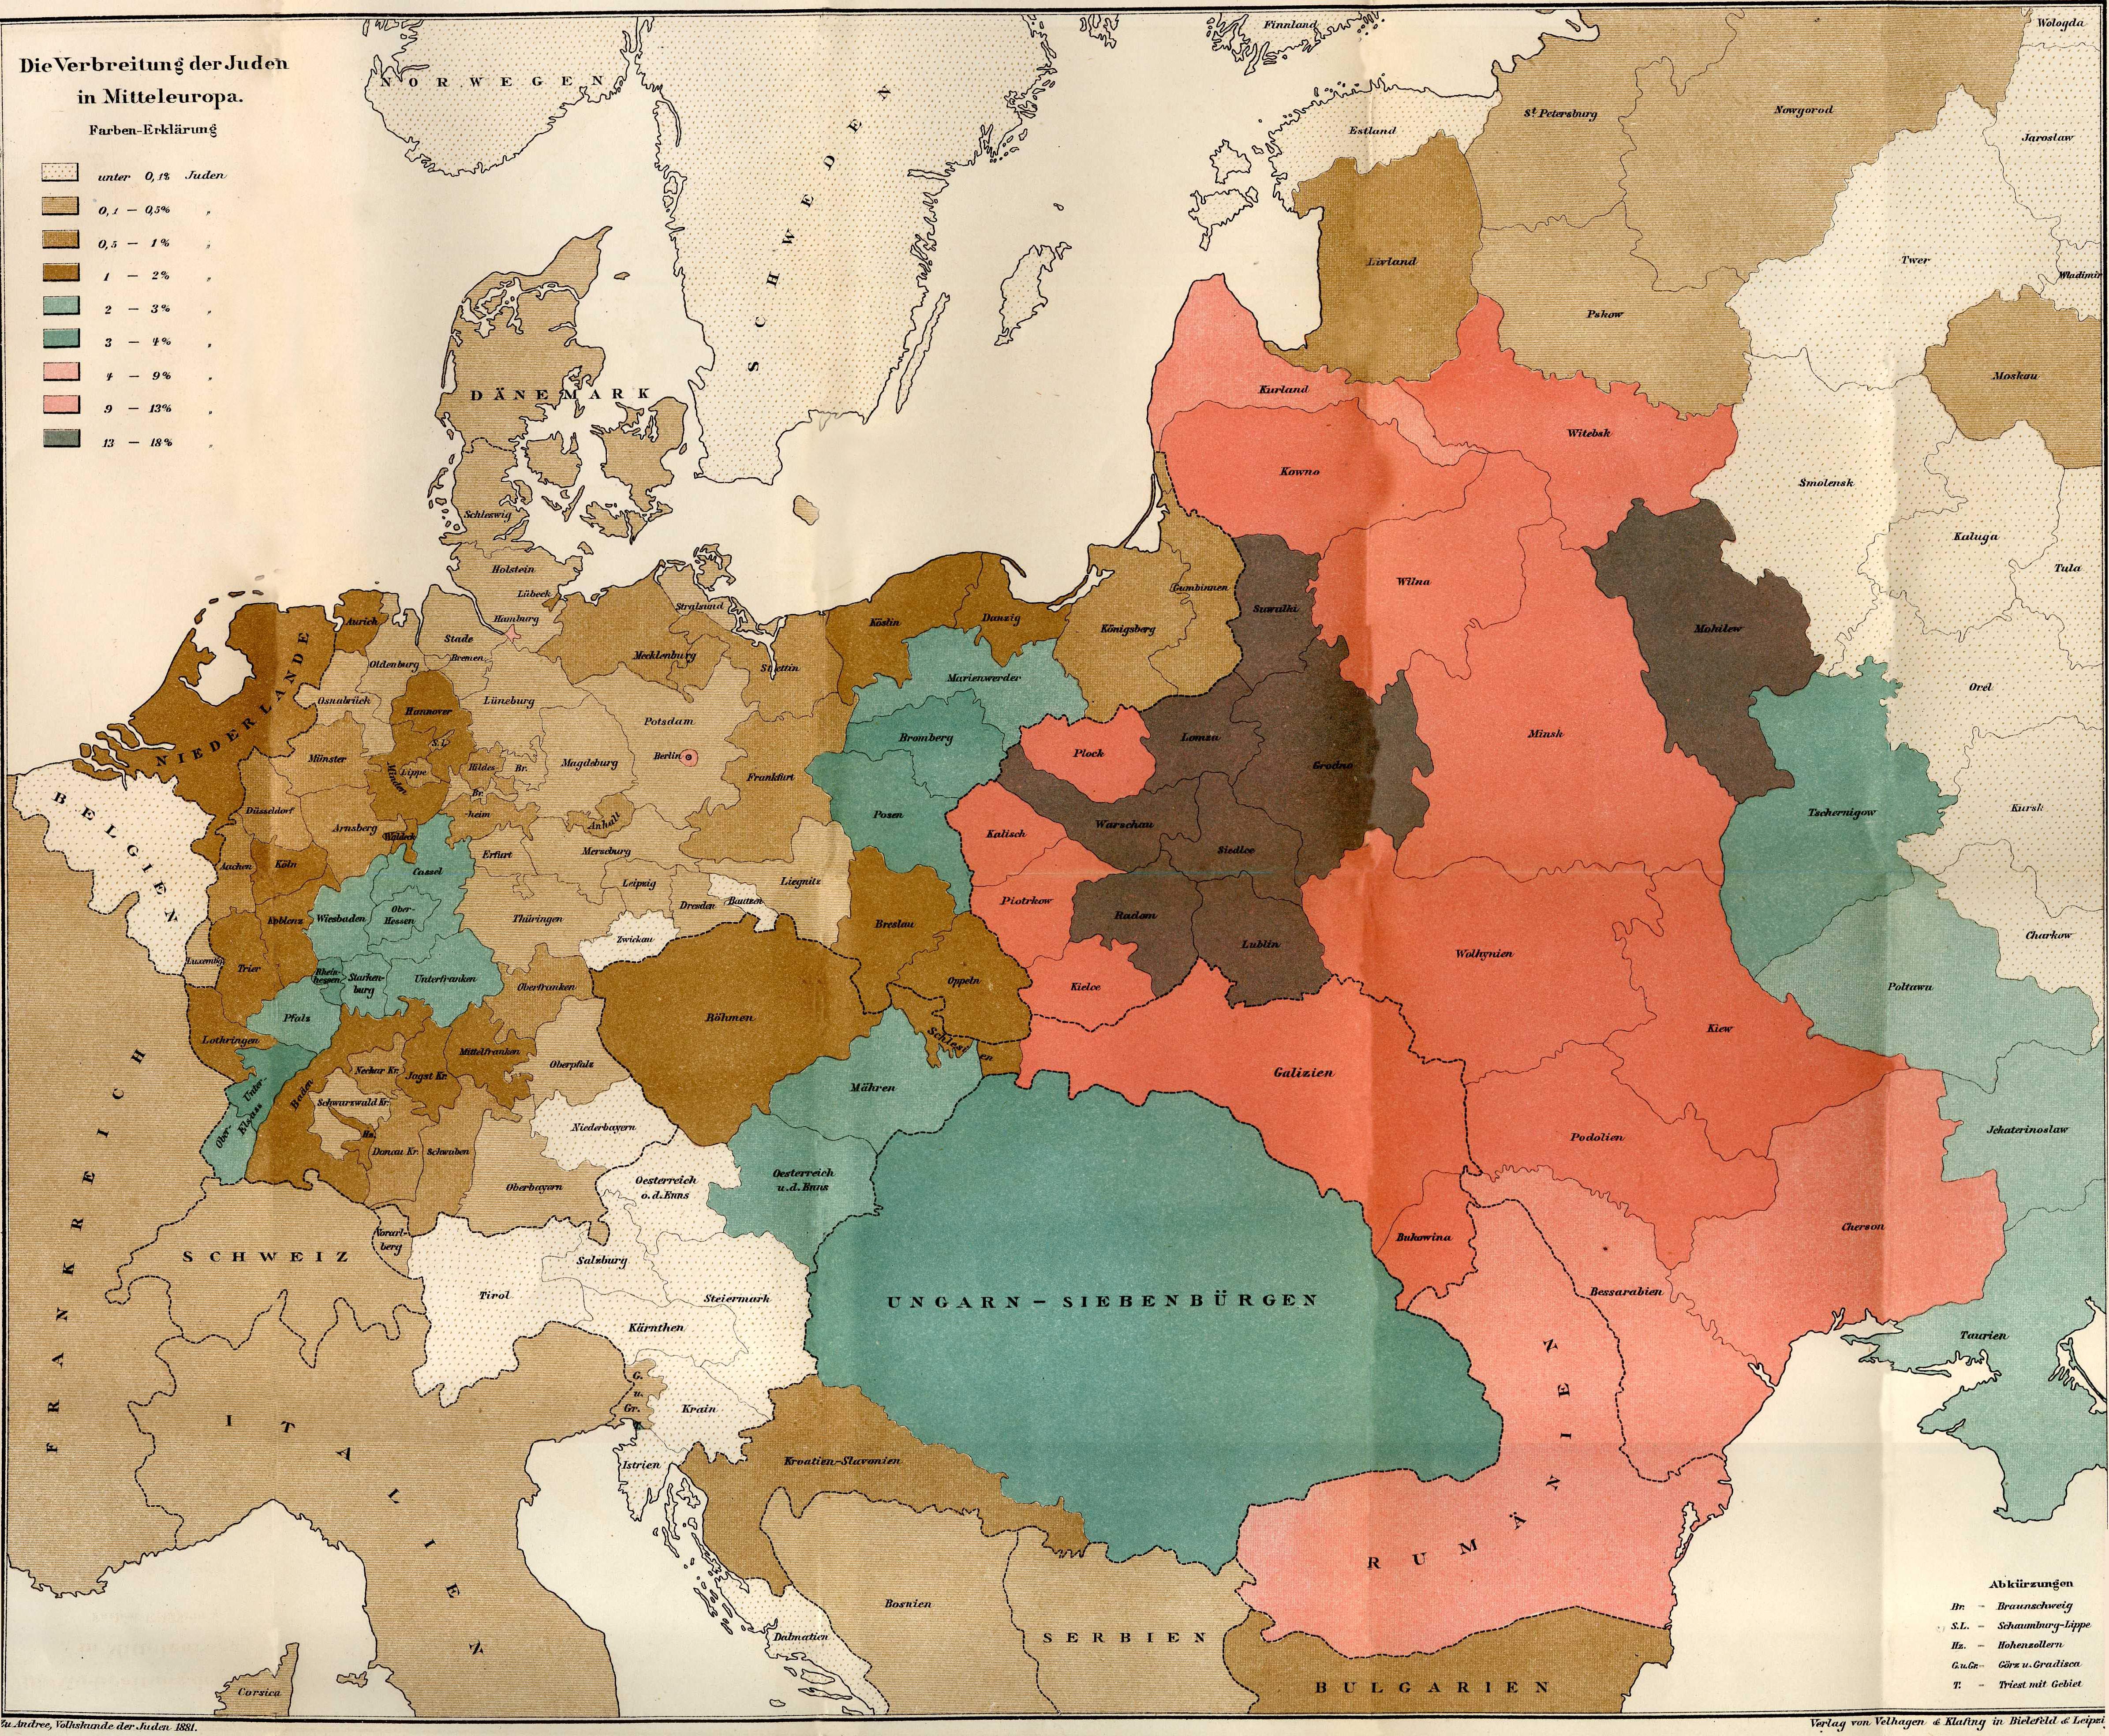
    Juden_1881  [Image source: wikicommons, https://commons.wikimedia.org/wiki/File:Juden_1881.JPG  The image is greatly expandable.]

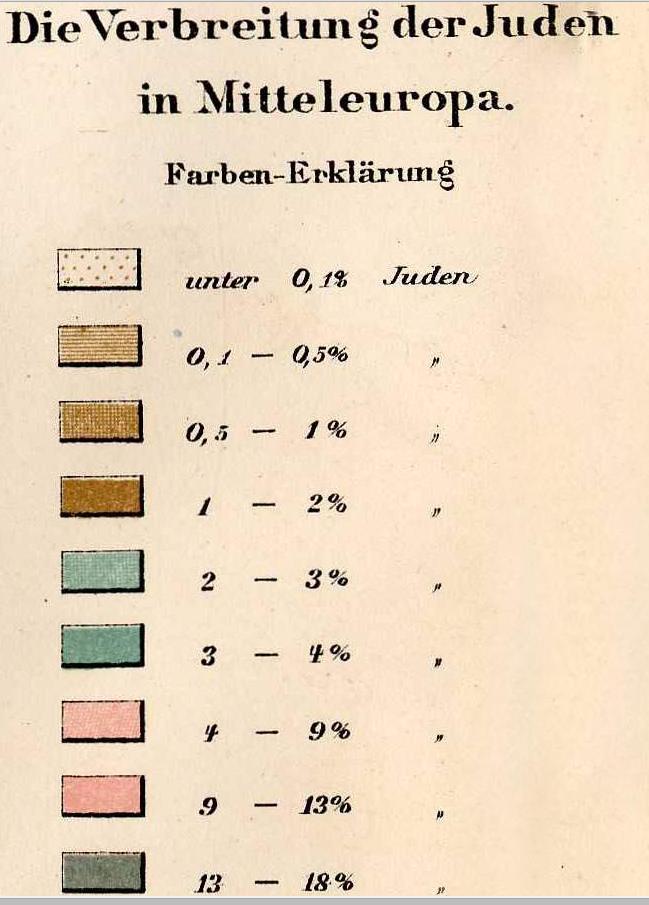
    And the key to the map:

    Maps Jewish populations in Europe

    There are of course bits that have survived intact for millennia.  One of these is this fragment from one of Euripides’ lost plays (only 20% or so are complete), The Wise Melanippe, and begins a statement of cosmogony that states the creation of all things.  The separation of heaven and earth has always stuck with me, because this separation begins with Euripides with the creation of the world seems to continue on its way with mini-separations of all things over the course of time—like the cosmological world-bearing turtles—all the way down. 

    I’m not sure how or who exactly did this heaven-rending, or to what force it owed its being:  evidently the Presocratics tended to depersonalize the actions of the gods and grant their actions to natural forces, so the issue with the heaven-separation business may well have been a motive force rather than a god.  Anyway it’s the tearing apart, the removal, the separation phenomena that got my attention to begin with, and one which has stayed with me, though I’m sure that Euripides didn’t have that sort of violent rending in mind while describing the birth of the earth.

    And so it is with this map1 showing the concentrations of the Jewish people in Europe  in the late 19th century. Between the time of the publication of this map—1881—and the beginning of the Nazi regime in  Germany in 1933, there were many persecutions and Pogroms and deportations of the Jewish people.  Nothing prepared anyone for the concentration camps and the systematic extermination of that people between 1935 and 1945.  What this map shows is the distribution of the Jewish people (by percentage of the total population) before they were eviscerated:  the difference between this map in 1881 and the map of 1945 would be completely different.  The Jews were gone:  killed.  Some deported.  Others escaped.  But they were basically torn from Europe  in the cruelest manner so that in almost every case the only indicators of their existence were shadows. 

    There are large-scale maps of this sort of evidence for other groups of people in their pre-Euripidean tearing from their home:  maps showing the locations of Indian tribes in North America (pre-Columbian, 17th century, 19th century, they’re all telling pretty much the same devastating story) is one good example of a slender category.  There aren’t maps for the mass extermination by starvation created by Joe Stalin, or the millions murdered by Pol Pot or Mao.  There are of course more small-scale, localized maps depicting the results of forced relocations or devastating war or drought or hunger or floods.  But few, I think, take such a compelling x-ray of a people’s past on a continental scales such as this. 

    Notes:

    1. “Die Verbreitung der Juden in Mitteleurope”  found in  Richard Andree’s , Volkskunde der Juden…,  Verlag von Velhagen & Klefirg in Bielfeld und Leipzig:  1881. 


  • The History of Lines: Representing the Unknown (1828)

    JF Ptak Science Books   Quick Post

    The History of Lines series

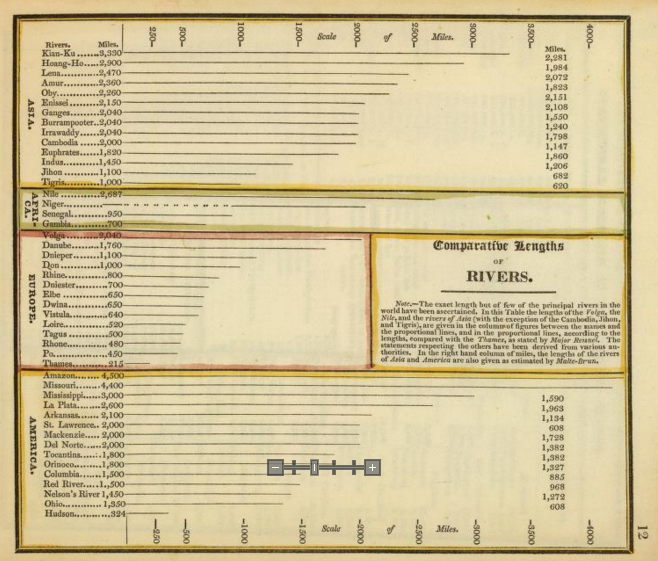
    This is another entry in a series of posts on maps and the representation of quantitative data, this one being early in the development of this genre of imagery.  The map (a little guy at 5×7″) is from An Atlas Accompanying Worcester’s Epitome of Geography, published in Boston by Hilliard, Gray & Co., in 1828. 

    Comparative River Hilliard detail

    [Source: Images of the Hilliard map found at David Rumsey’s map website, here: http://www.davidrumsey.com/luna/servlet/s/xz62g8]

    In the 46 river lengths displayed here, 45 have distinct measurements; one–the Niger–does not, or almost does.  The indistinct and suggested delineation shows what was know of the river, and what wasn’t, with bits on either side of the middle section (reached and surveyed by the fabulously-named Mungo Park, 1771-1806, at the turn of the century). Much of the Niger wasn’t well known at this point, though it had been plotted in part since antiquity–with all of that the overall length was well approximated (very close to its nearly-2500 mile length, the main river in West Africa).  The line/dot combination was an honest approximation of displaying the river’s length, and not often seen.  
    Rivers comparative Hilliard


  • “The Body as Army and Navy”, 1921–Mechanical Images of Sensory Capacity

    JF Ptak Science Books  Quick Post


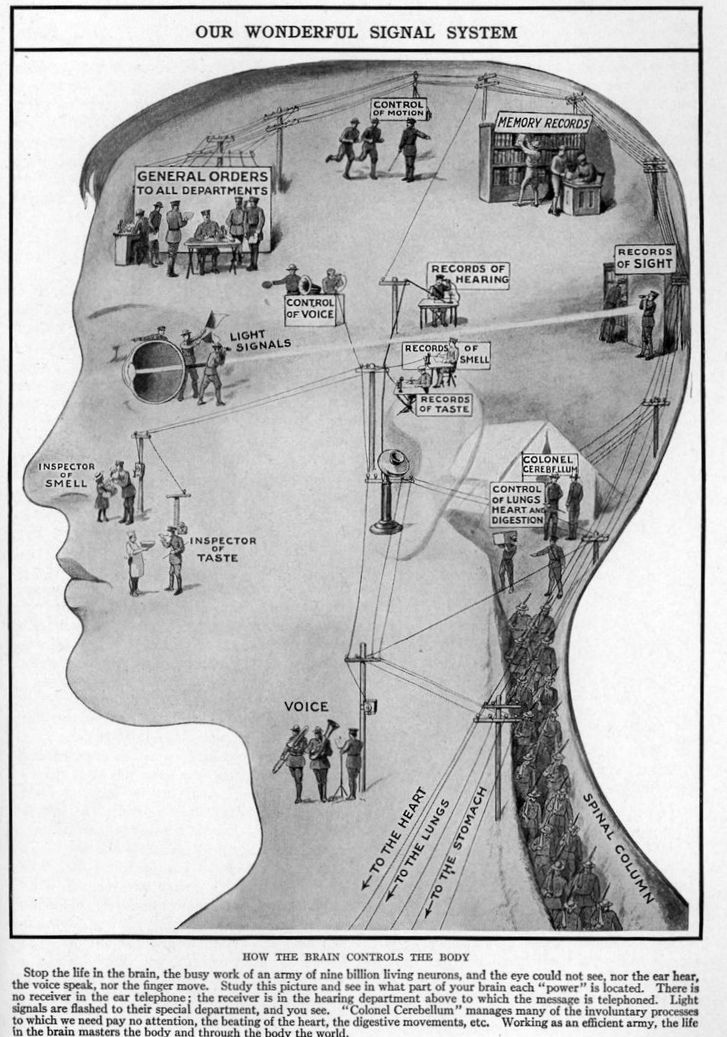
     These creative displays are found in Marion Florence Lansing’s The Wonder of Life (volume 11, Supplementary), published in 1921.  They represent a somewhat humanized-but-roboticized/automated approach to displaying he control of the senses, which seems to have been a developing style in the 1920’s giving the popular cultural appearance of mechanical people (the term “robot” appearing for the first time in this same year in Karel Capek’s play R.U.R.). The images also appear, appropriately enough, in the chapter titled “The Machinery of Our Bodies”. 

    Map of the senses


  • Children and Labor, 1910-1920

    JF Ptak Science Books  Quick Post


    Newsboy

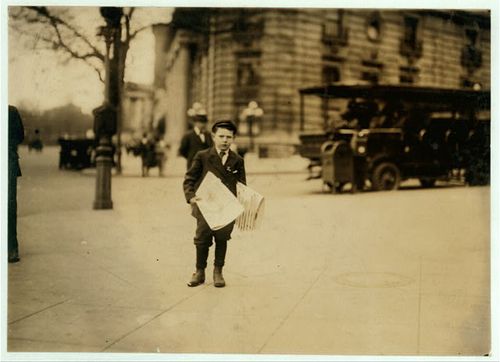
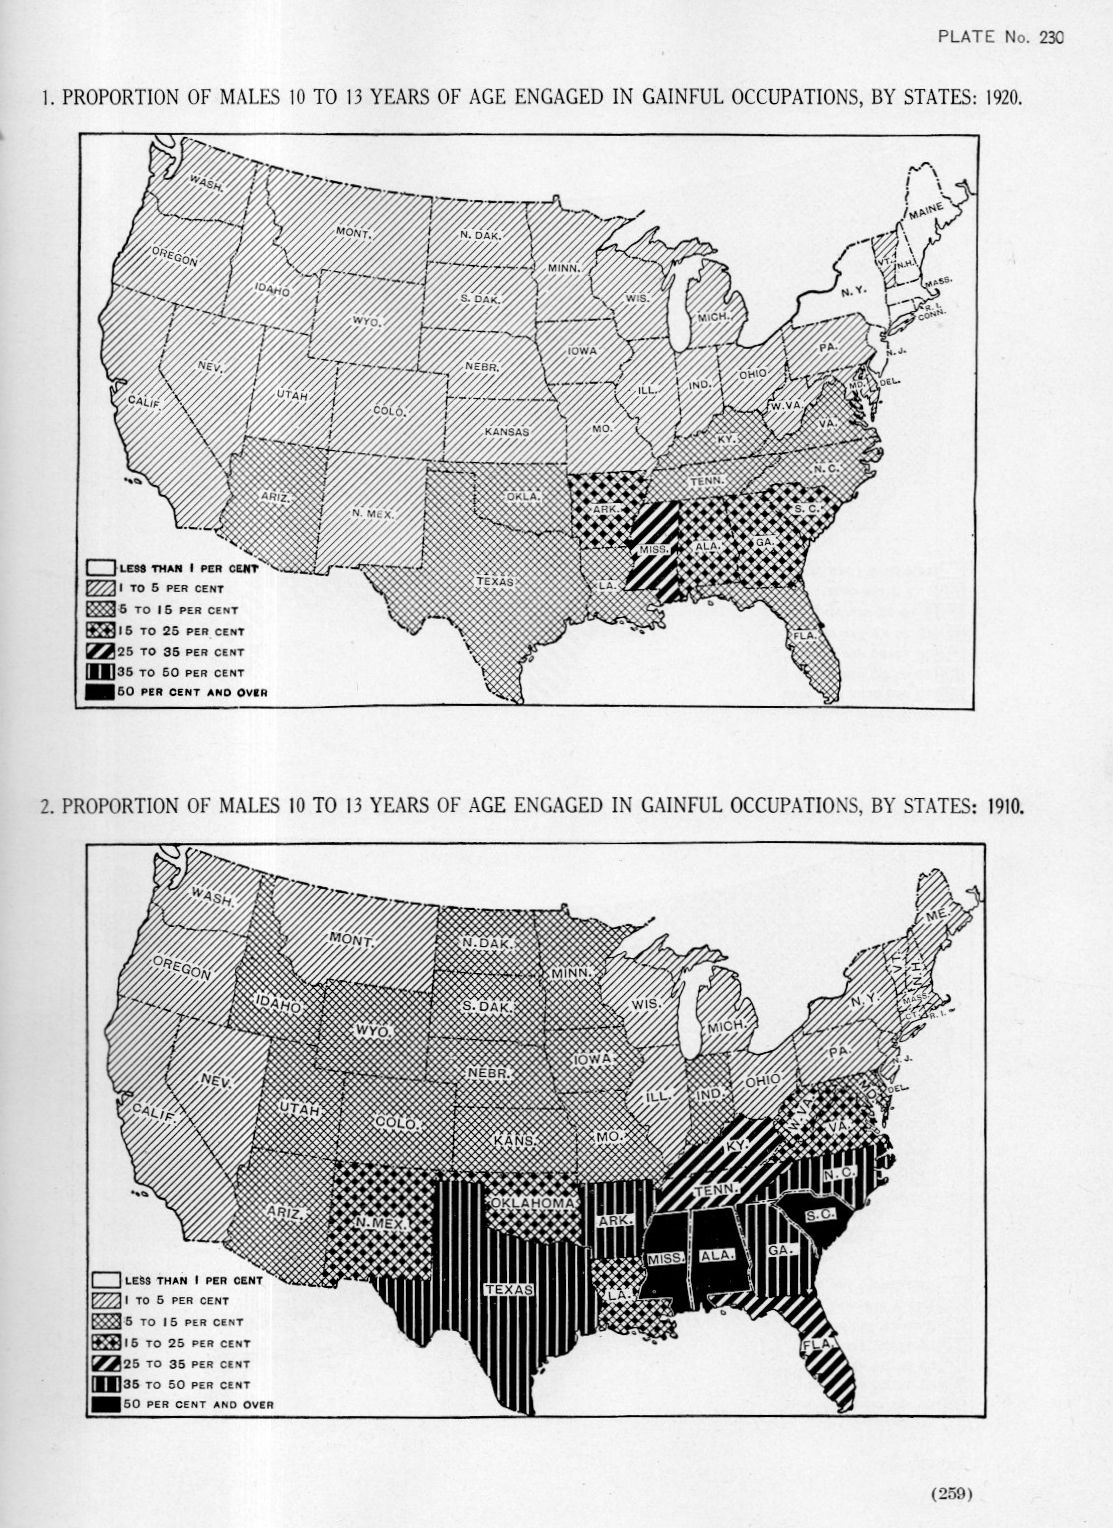
    Welcome to the not-too-distant past, the era of my grandmother, when in 1910 50% or more of 10 to 13 year-old boys in Mississippi, Alabama, and South Carolina were working, and working at real jobs.  There does seem to be a remarkable change in the employment situation in the next census of 1920.  

    [The maps below appear in Statistical Atlas of the United States, prepared by Charles S. Sloane, published in Washington, 1925, plates 230 and 232.]

    See some earlier posts on child labor: 

    among others…

    Maps employment children238

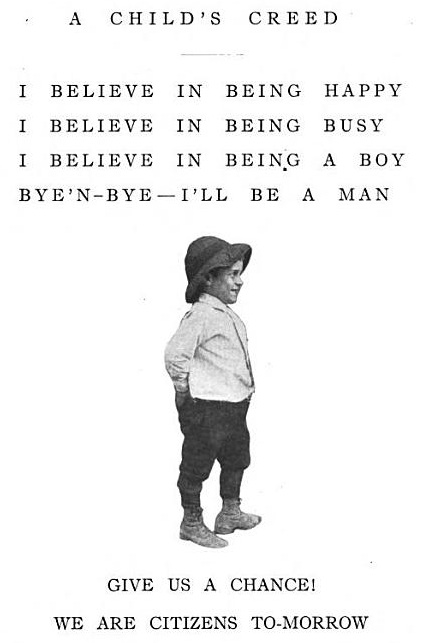
    Child work--childs creed


    Maps of the proportion of females 10 to 13 years of age engaged in gainful occupations, 1920: