A Daily History of Holes, Dots, Lines, Science, History, Math, Physics, Art, the Unintentional Absurd, Architecture, Maps, Data Visualization, Blank and Missing Things, and so on. |1.6 million words, 7500 images, 4.9 million hits| Press & appearances in The Times, Le Figaro, Mensa, The Economist, The Guardian, Discovery News, Slate, Le Monde, Sci American Blogs, Le Pont, and many other places… 5000+ total posts since 2008.
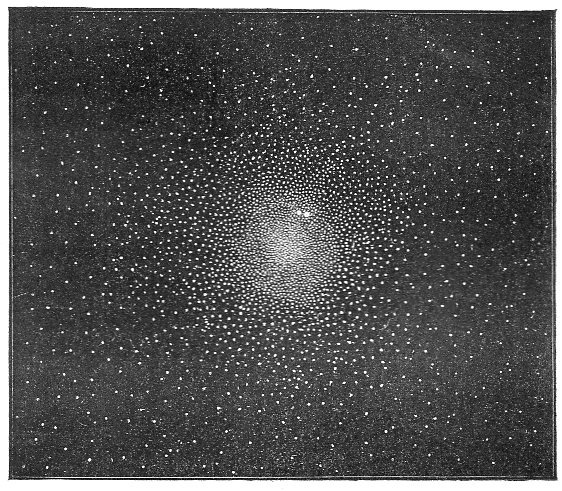
This beautiful engraving appeared in Amedee Guillemin’s Le Ciel: notions d’astronomie a l’usage des
gens du monde et de la jeunesse, which was published
by Librairie de L. Hachette and Company, and printed in 1865 (the
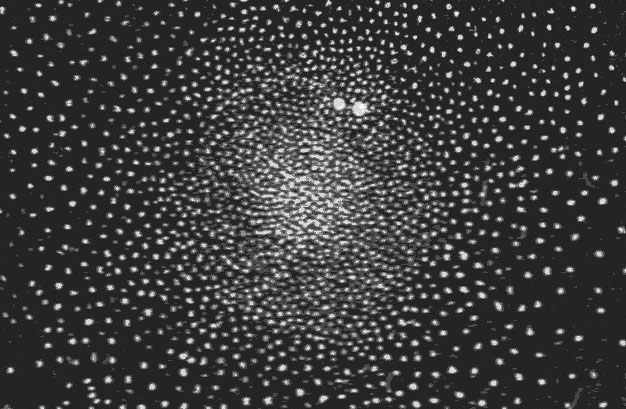
images from which are available here). There are many striking images in this book, and I’ve chosen this one because it has a certain deep depth to it, and relays a complexity and distinctness to something that is generally imaged as being less so, being a massive star cluster and all. The “Amas du Toucan”, known now more familiarly as 47 Toucanae or 47 Tuc (NGC 104), is a bright element in the southern sky, a huge clsuter 120 light years wide and 16,700 light years from Earth, visible to the naked eye in the constellation Toucan (created by Petrus Plancius in 1598 or so). And here it is, in a little 9×8 cm engraving with hundreds of white points as stars, made after an engraving of Sir William Herschel (1738-1822, a German-born Engloish astronomer who–with his sister Caroline and brother John–spent decades observing and recroding stars, double stars, clusters and nebulae).
47 Tuc was first catalogued as not-a-star by Abbe Nicolas Louis de Lacaille (1713-1762), a French astronomer who found it too be too fuzzy to be a single star, and who produced a 10,000 (Southern) star catalog, Coelum Australe Stelliferum, which was published in 1762, and which also introduced 14 new constellations. 47 Tuc made another quck appearance in the great Catalogue des Nébuleuses et des Amas d’Étoiles (“Catalogue of Nebulae and Star Clusters”), a superb and meticulous work by Charles Messier, and published in 1771.
The Guillemin work is simply a lovely and elegant thing–one of many accomplishments in a beautiful and relatively simple book.
[This is numbered post 2,000–a number that does not include another 500 or so “Quick Posts”–written for this blog since beginning in February 2008.]
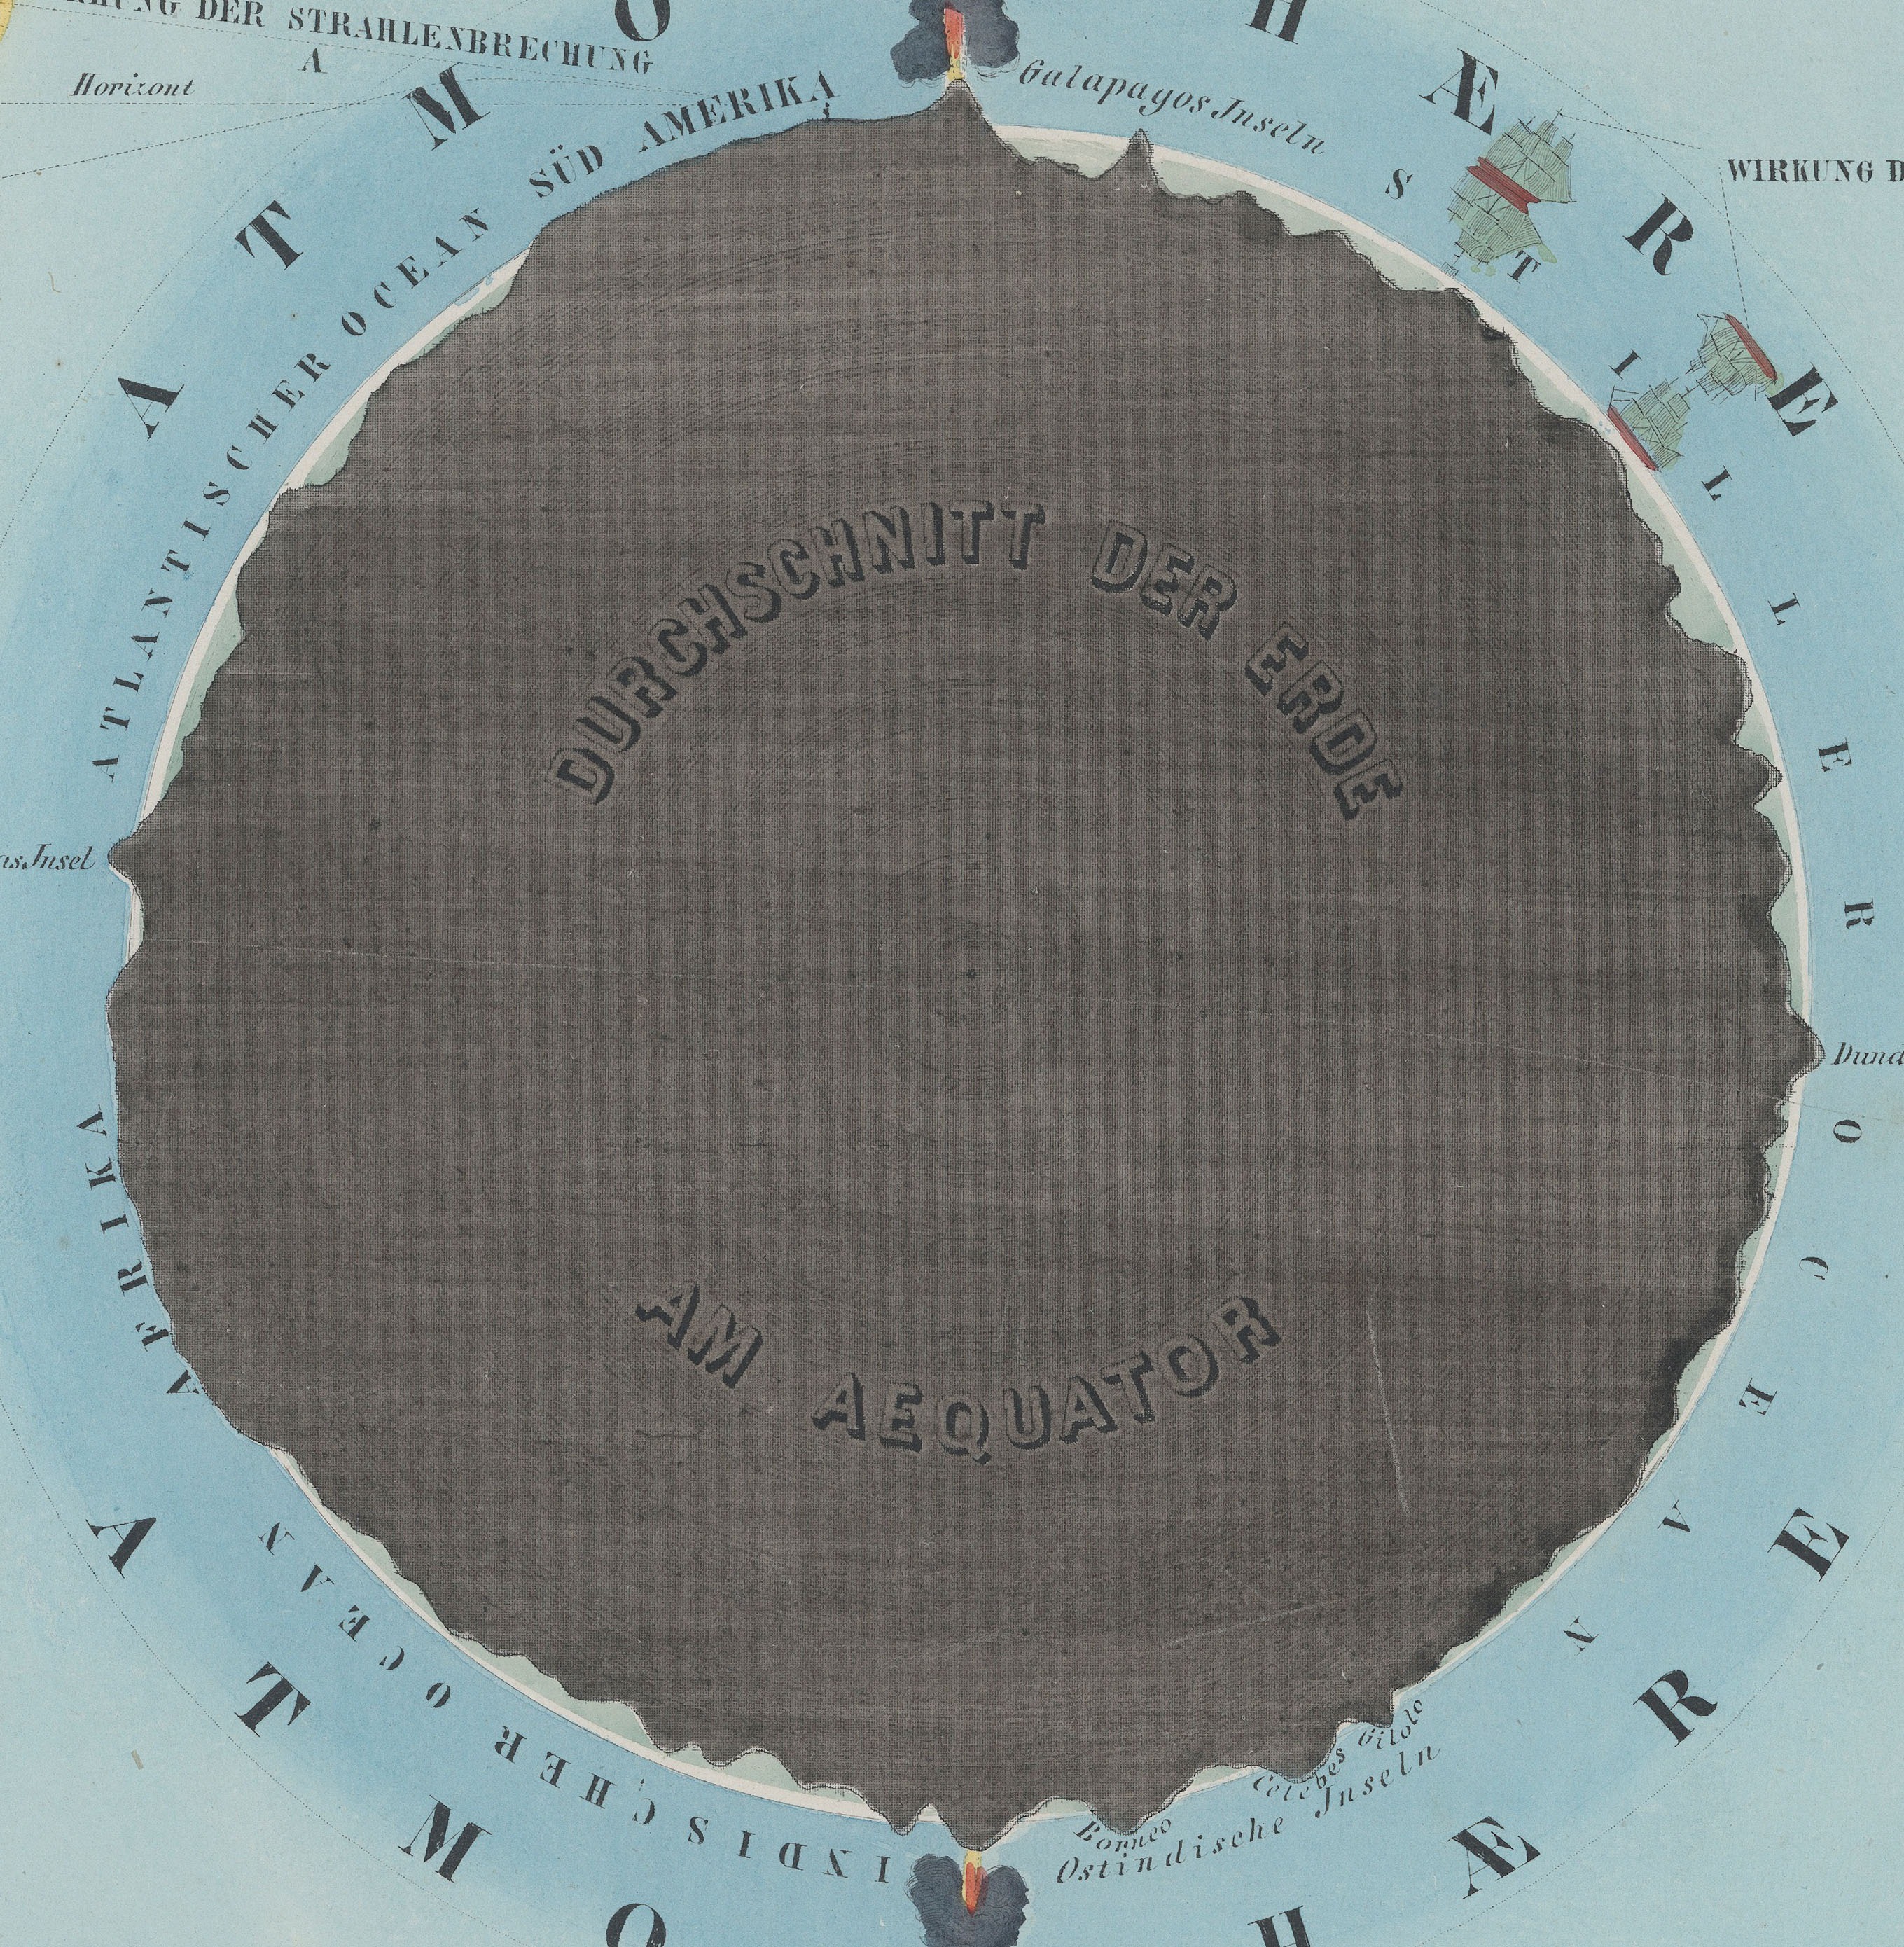
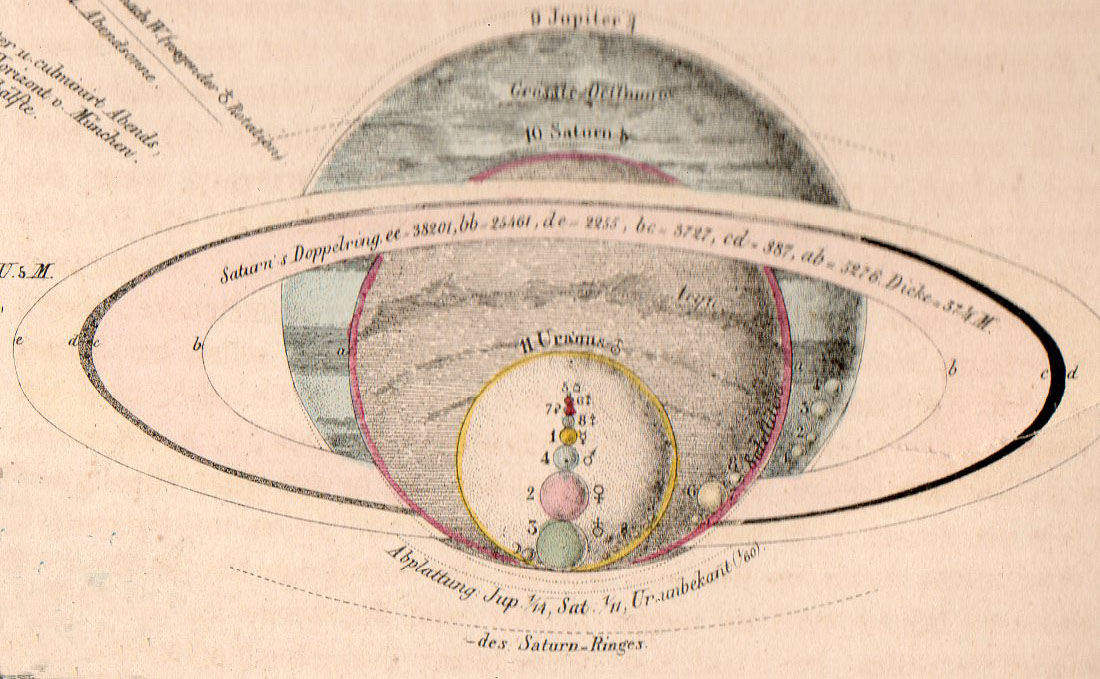
“Der Erde und Ihre Atmosphare” from Astronomischer Bilderatlas, by Ludwig
Preyssinger, published in 1853 (with 12 engraved plates1, following the
first edition of 1840, which had 10 plates). Source: found at Michael Stoll’s flickr set, a superior and large image, here.]
Our older daughter Emma asked that question years ago, when she was six or seven. It was a great question, and one of those questions, really, that only kids can come up with. It is also reminiscent of Ruth Krauss and Maurice Sendak’s A Hole is to Dig, a classic work published in 1952 with these sorts of question/responses, a kid-cratic method of inquiry and answer, that is possible generally only with a younger and fluid mind. (“What is a hole? A hole is when you step in it you go down” and “a hole is to dig” and so on.)
People from long ago certainly knew that clouds were not nearly as high as the Sun and Moon and stars, but how high could they be? How high was the sky? How thick was the envelope of air around the Earth? Exploratory balloon ascents could help that question along, but only somewhat: heights attained in the first 80 years or so of ballooning reached 43,000 feet. (The question of ballooning and the limits of the atmosphere comes up early, as we can see with Jane C. Webb Loudon, the author of the anonymously-published The Mummy!: Or a Tale of the Twenty-Second Century in 1827, interestingly published nine years after Mary Shelley’s Frankenstein: “… and the hampers are filled with elastic plugs for our ears and noses, and tubes and barrels of common air, for us to breathe when we get beyond the atmosphere of the earth.”) In 1803, the record stood at 24,000; in 1835, 26,000; in 1862, 39,000; the record of 43,000 feet was reached in 1927, and at a great cost. On the other hand, more than half of the atmosphere exists at 3 miles above the Earth, and 70% of it is at 5 miles and under; at 22 miles exists about 99% of the atmosphere, and at 62 miles the atmosphere is so thin that it is a virtual vacuum, and is basically negligible. (The exosphere reaches out though to about to about 6,200 miles, but that’s where free moving particles are able to escape the Earth’s gravity and get swept away by the solar wind.)
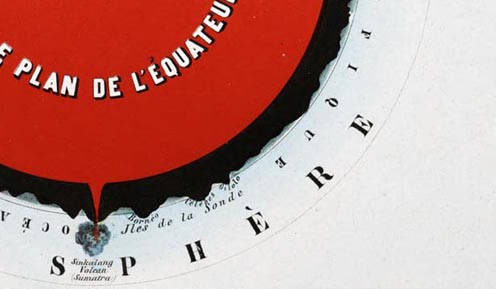
Herr Preyssinger was trying to exhibit this atmospheric density in his illustration #10 to his beautiful astronomical atlas. (I should add here that Preyssinger’s work is a very uncommon production, made so that several of the engraved plates coul dbe held up to a solitary light source in a dark room and be illuminated cut-outs in the paper which also had transparent material on the verso to difuse the light…very smart.) His illustration for the atmosphere was very effective, and was set against a plan of the earth made at the equator. I’ve also included the same plate #10 from a French edition of the same work made slightly later, though the interior of this Earth is colored in a brilliant red.
So when the engraving above was printed in 1862, the balloon ascension record stood at about 5 miles, getting humans to above 70% of the ocean of air.
Relative to humans getting high above the ground, the atmosphere is high; relative to just about everything else–like the 99% at 22 miles compared to the 7,900 or so miles of the Earth’s diameter, the atmosphere is but a thin slip. IF we reached that distance down into the Earth, we would just be touching the outer mantle.
Fromt the French edition, printed in 1862, here. French explanation (Astronomie Populaire ou Description des Corps
Celestes, Astronomie Populaire en Tableux Transparents...., published in
1862) of plate X, here.
Notes:
1. Twelve plates, as follows: Die Central-Sonne und die Ansicht von der Fixsternwelt; Himmelskarte; Darstellung des Sonnensystems; Vergleichende Darstellung der Grösse der Planeten; Die Sonne und verschiedene Erscheinungen derselben; Der Mond durch das Fernrohr gesehen; Transparente Darstellung der Mondsphasen; Finsternisse; Ansicht von den Jahreszeiten; Die Erde und ihre Atomsphäre; Kometen und Aerolithen.
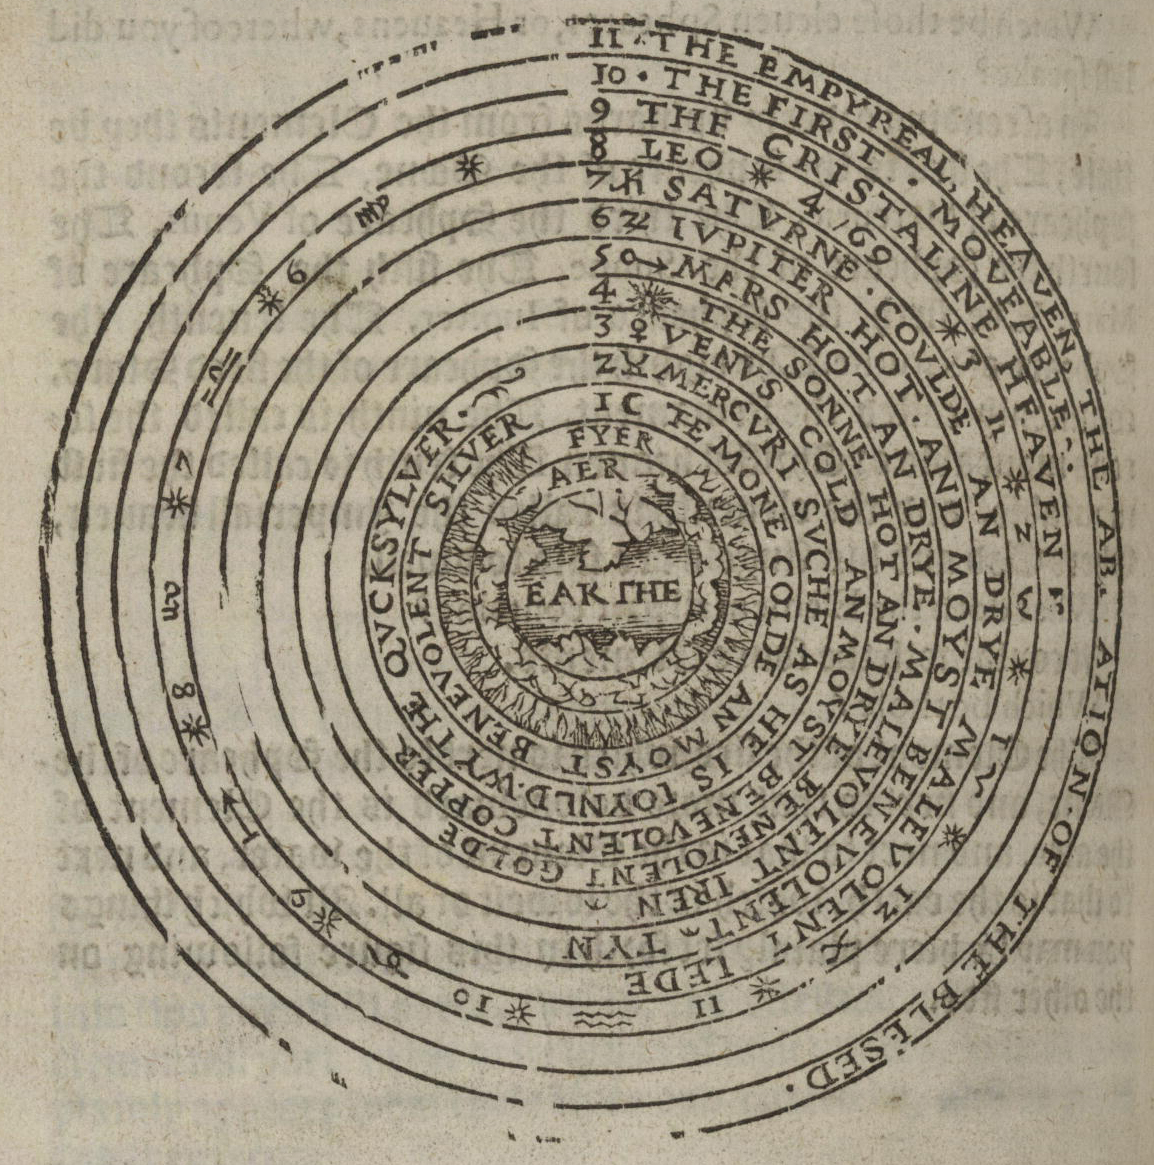
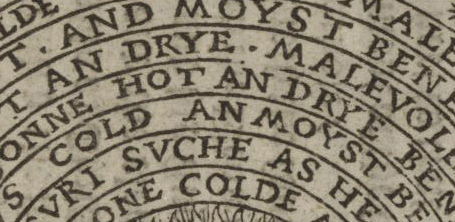
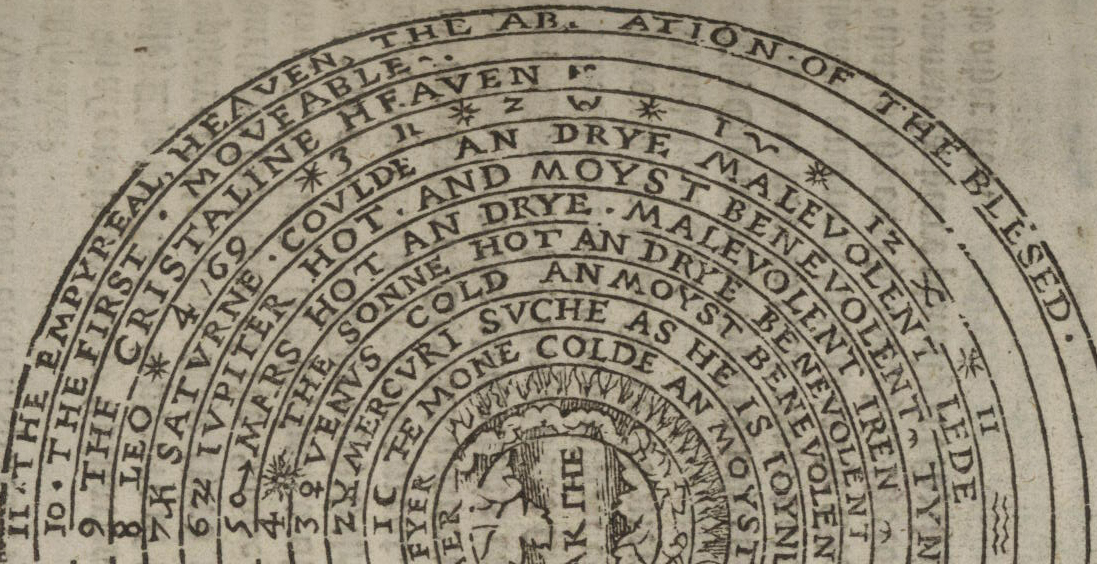
This copy of Thomas Blundeville’s (1522-1606) work on astronomy and navigation contains some very fine examples relating to imaging the history of astronomy–a high-Renaissance work of scholarship and humanism.
The book has a long and detailed title: M. Blundeuile his exercises : containing eight treatises, the titles
whereof are set down in the next printed page : which treatises are very
necessarie to be read and learned of all young gentlemen, that haue not
beene exercised in such disciplines, and yet are desirous to haue
knowledge as well in cosmographie, astronomie, and geographie, as also
in the art of nauigation, in which art it is impossible to profite
without the helpe of these, or such like instructions : to the
furtherance of which art of nauigation, the said M. Blundeuile specially
wrote the said treatises .. with this copy being the fourth edition (corrected and augmented), and printed in London in 1613–an interesting edition, which contained the new data of the circumnavigation of Sir Francis Drake.
[Sources: full text here via the Library of Congress; found via the pinterest collection of Trevor Owens.]
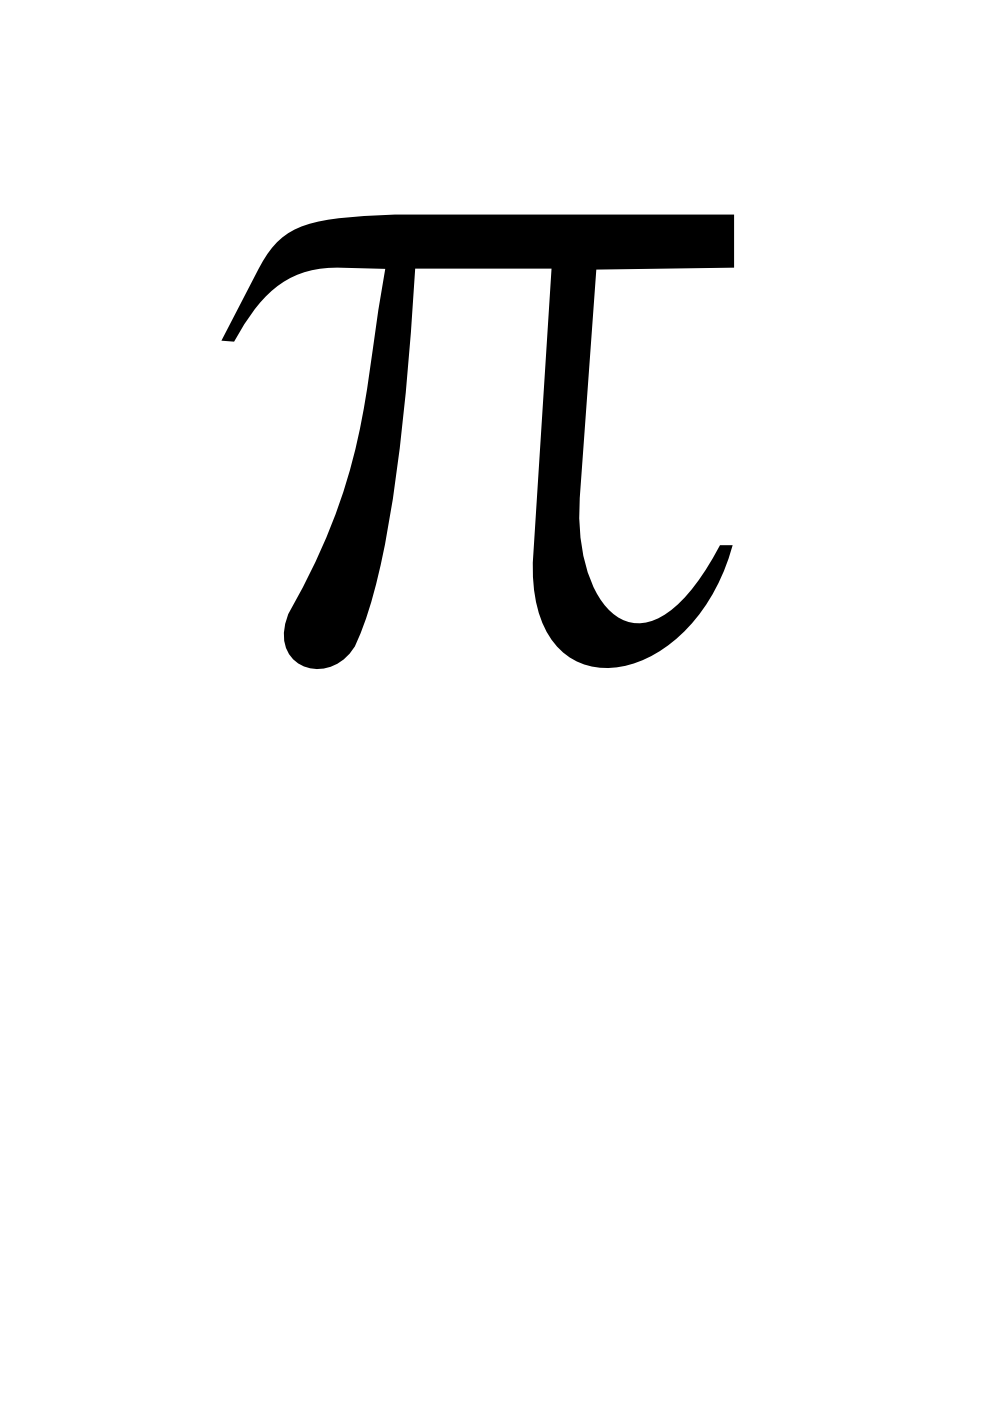
It seems that for such a great number as pi the naming of had little (where “little” = “no”) fanfare in its introduction.
Since it is just after 1:59 on this pi day of 2013 (3.14159…) it might be nice to have small bit of history on the first use of the symbol for pi. Pi the idea is ancient (on the ratio between the diameter of a circle and its circumference) but using the Greek symbol for the word is relatively new. It shows up for about he first time here:
on page 267 of William Jones’ (1675-1749) Synopsis Palmariorum…, which was in general a book for beginners in semi-advanced mathematics, and which was published in 1706. Pi is represented as a square or the Hebrew letter “mem” in John Wallis’ Arithmetica infinitorum (published in Oxford in 1655), according to Florian Cajori in his A History of Mathematical Notations (volume II page 8), though William Oughtred had used the Greek letter in fractional form to designate the ratio as the periphery and the denominator as the diameter. Still, it was Jones who introduced the letter pi as the sign for the ratio, and he did it without saying very much at all about it. Actually, he says nothing about it at all–just states the case, and that was it.
Cajori writes on to say that Jones used the symbol earlier in the book, but in a different context, and that the immediate reaction to the symbol (if there was a reaction) was also a bit of nothing, with many writers continuing to use different symbols to talk about pi for several more decades, and that it didn’t really come into use in general textbooks in German and French until nearly 1800.
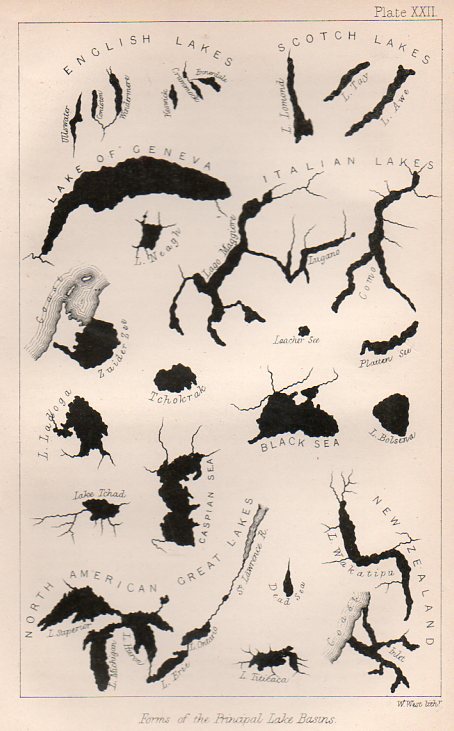
These small images are elements composing an engraving from the atlas volume to accompany the polymathic Alexander von Humboldt’s (1769-1759) Kosmos, published in 1856 (the atlas volume online here, at the Biodiversity Library). Each of the small images is about 1.5″ square, with great detail–tiny and remarkable, and very well designed.
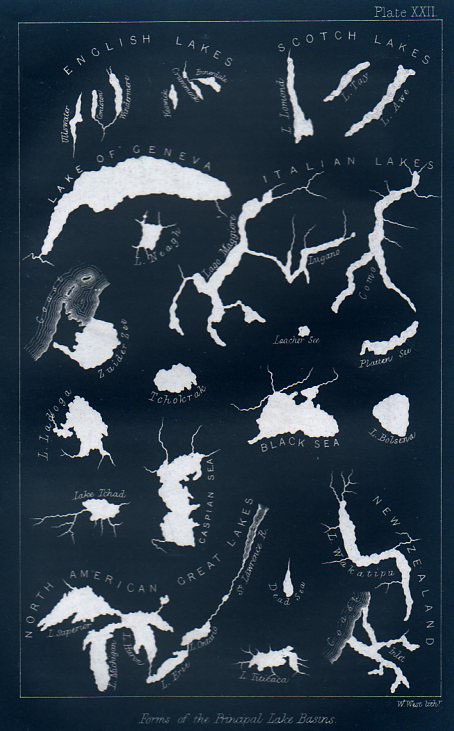
This engraving was very nearly very interesting–I mean, it is interesting in that it shows the shapes of lakes together on a single sheet of paper, their shapes presented devoid of any other non-lakes. Its really quite an arresting presentation, and coming at a relatively early time in presenting data in this fashion. What the engraving doesn’t relate, unfortunately, is the size of the lakes relative to one another.
And if the lakes were to be presented proportionally, Lake Geneva (surface area of 225 miles2 would be quite a speck compared to the likes of the Great Lakes, and Lake Superior (31,000 miles2) would speck-ish compared to the great Caspian (clocking in at 152,000 miles2).
This graphic appears still in the first decade or so of cartographic physical attributes being placed together, and was published in 1865 in the Popular Science Monthly.
Here we go with a good representation of an engraving (above), this from 1856 and which may have been the first time that these 150+ lakes and islands of the Western and Eastern Hemisphere were ever been printed on the same page and in the same scale exclusive of their associative land masses and placed contiguously, side-by-side. They were, of course, seen in a common perspective before on any world map, but I think that this is the first year in which the islands and lakes of the world were displayed without oceans and land masses, and the effect is a little odd. If you take away the color and the text the image takes on a very definite biological flavor (I keep thinking of that tiny bone in the ear for the small lakes…) In any event it is far easier to compare these features without the distractions of the non-lakes and non-islands clouding and confusing our perspective fields.
And as long as we’re at, let’s have a look at the first image inverted, which gives the lakes a good healthy dose of anthropomorphism via imaginary rips, tears, moth- and bullet-holes.
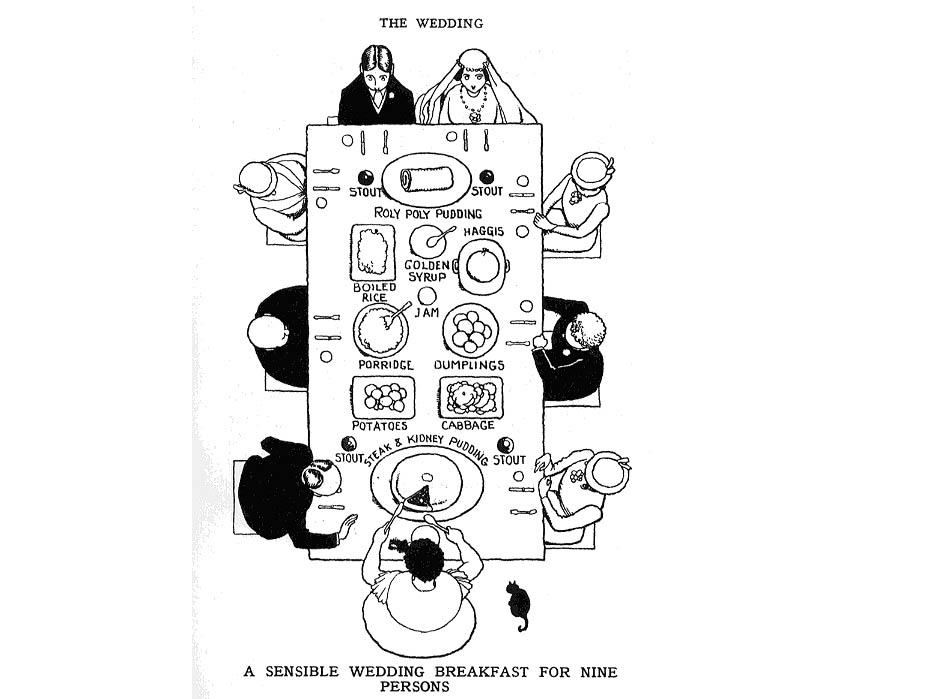
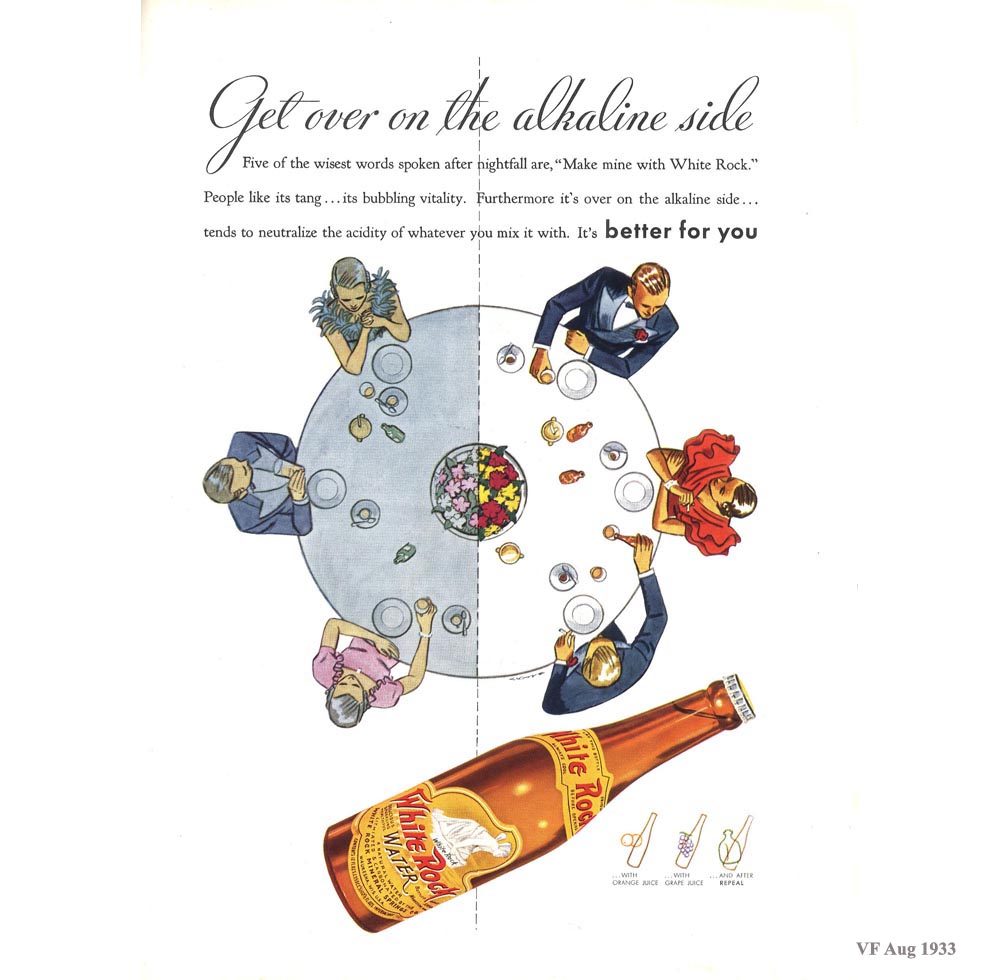
This Daily Dose from Dr. Odd combines two interesting categories today, “Looking Straight Down” and “Display of Information”, and they involve food. Rather, its the placement of food, and maps of dinner tables, seen from above–directly above–and looking straight down.
The idea of representing a view straight down, of looking straight down from some height, is a relatively recent occurrence, this view being somewhat rare in the antiquarian world pre-balloon or pre-heavier-than-air flight. The pre-human-flight reason for its scarcity is understandable, but even after the first Montgolfier ascension in 1787, there’s another 120+ years of scarcity yet to come before these views would start to pop up in common (and uncommon) literature.. Now I’m not talking about cartography, which is basically a straight-down view of the world—what I’m referring to is that same view but not as a map per se, but what you would see if you were dangling out of a plane or balloon. It is an unusual and scarce perspective.
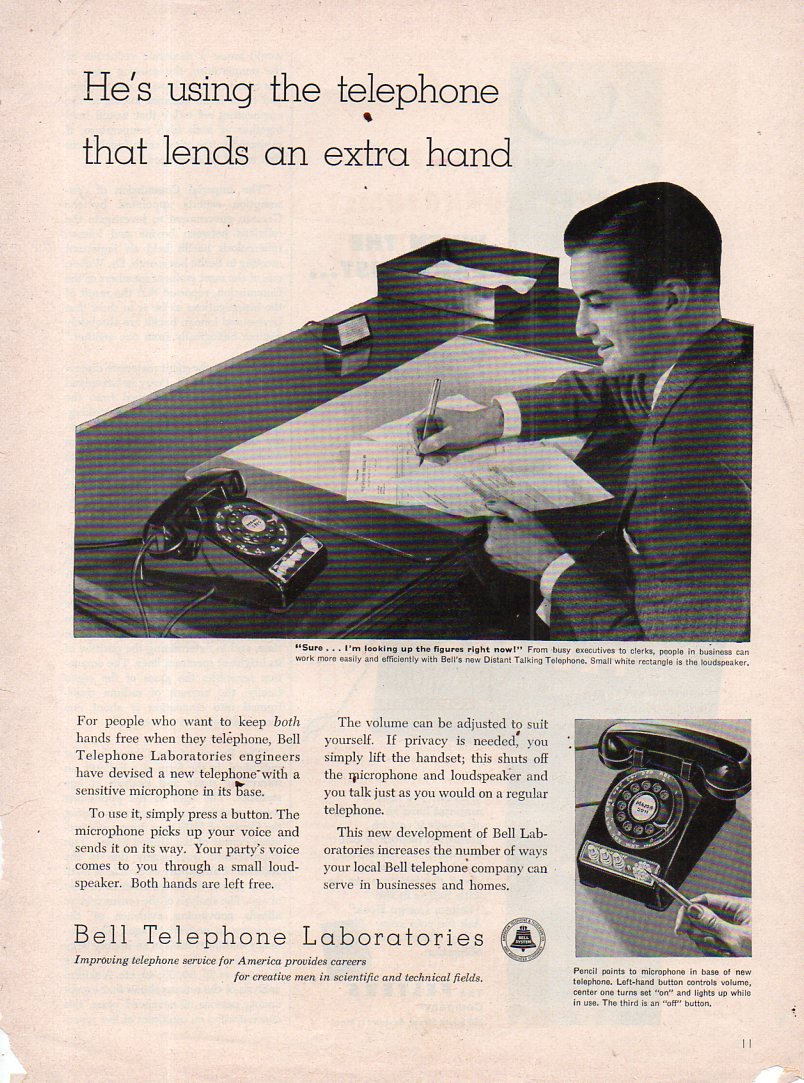
This ad appeared only 59 years ago–that’s four generations in dog years, two human generations (or one for the more later-in-life crew, which is appealing as I knew a man whose grandfather was born in the 18th century), and 15 generations in managing data and communications. Perhaps more. It is difficult to imagine the intense surprise that attended this ad showing a practical and popular adaptation of a communications breakthrough.
The electromagnetic telegraph, which is arguably the first electrically-powered iteration of the internet, was in the works from the 1820’s until it was nailed by Samuel Morse in 1837. It was 40 years to the development of the Bell telephone (another dramatic example of an invention/technological idea/breakthrough that was “in the wind”, a popular undiagnosed monumental meme, some decades in the making in the hands of Bell anbd Reiss and Meucci and Gray and even Edison). Two more decades (just past the turn of the century) until more-widespread wireless telegraphy, another two decades after that (1920’s) for poular radio, and another two decades after that (post WWII/1950’s) for popular television broadcating. 120 years between the patented invention of the Morse telegraph to 50 million Americans with televisions in 1955.
The “telephone” of 2013 is as removed as the telephone of 1955 as the telephone of 1955 was removed from the electromagnetic telegraph–we’re not meeting half-way in the meeting of improbable impossible worlds, of worlds of the future unimagined in the past. That is what comes to mind when I see this add for the speaking telephone in 1954–the astounding, astonishing, speaking telephone, the phone that allowed you to not have the receiver to the ear, tht allowed you to do free-hand work and communicate at the same time. It was an ambitious improvement, and as soon as the phone appeared, it became a standard of necessity if that necessity was within budget.
It is the weight of surprise that is so abundant looking at pictures like this, giving us the opportunity to imagine the surprise elements of another time. It may well be that the new 1954 user of the speakerphone would have looked at the first telephone systems of 1894 as we look on that 1954 telephone today. Probably not so, though, probably it was much more imaginable to have forseen the 1954 possibilities in 1894 than for 1954 to have seen in the same amount of time to 2013: the technological pieces necessary for part of that imagination had not yet been invented, the science ahead of the scifi.
The other part of this surprise element is that 1954 is well within living memory, and that this combinaiton of technology and physics and mathematics has grown so incredibly from the speakerphone to the massive changes in 2013–it is as surprising to imagine this as to imagine the same scenario for what ahppened a year before in biology: it is difficult to grasp the sweeping changes in that field from the identification of DNA in 1953 and how far those fields have come since.
I think that if one could quantify this sort of “surprise” that the greatest amount of “Surprise Integers” (or whatever) ever recorded would have taken place within these past 50 or 60 years. Which makes me wonder–will people 59 years hence see the pictures of our fabulous accomplishments in 2013 as quaint reminders of how much things changed between 2013 and 2072? Will those “Surprise Integers” be as great for that period of time as the (“our”) preceding period with concomitant revolutions in thought? My guess is “yes”–its just hard to imagine.
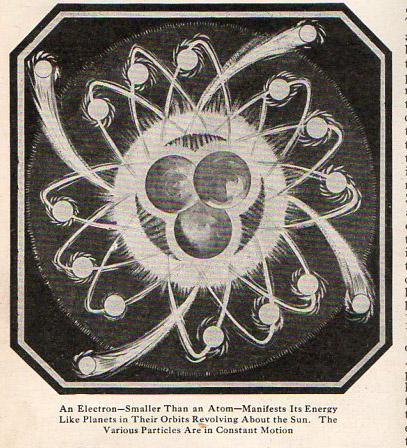
People have been thinking along the lines of “electrons” for a long time, though the word is of relatively recent origin (1874), coined by the wonderfully-named Johnstone Stoney (1826-1911) after deducing that ther must be some type of electrical bit that vibrates within the atom that would generate light. J.J. Thomson (1856-1940) stated later in 1897 in his paper “Cathode Rays” that evidence points to the fact that there must exist particles that are less massive than the hydrogen atom–he called these objects “corpuscles” but he was referring to what we now know as “electrons”. The gorgeous “oil drop” experiment of 1910 by R.A.Millikan (1868-1953) determined the charge of the electron, and in the next year–1911–Ernest Rutherford (1871-1937, and one of the 20th century’s greatest Kiwis) proposed the structure of the nuclear atom. Then the major development of Louis de Broglie’s (1892-1960) particle/wave duality, and so on into our near-present. But in between the beautiful work of Millikan and Rutherford came this little beast, a very unsatisfyingly-assumed image of an atom and its swirling electrons. The image appeared in the December 1920 issue of Illustrated World and just seems so unfair to the cause of beauty that I thought to share it.



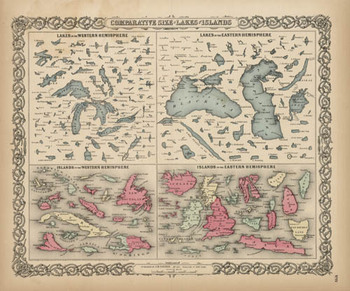 Here we go with a good representation of an engraving (above), this from 1856 and which may have been the first time that these 150+ lakes and islands of the Western and Eastern Hemisphere were ever been printed on the same page and in the same scale exclusive of their associative land masses and placed contiguously, side-by-side. They were, of course, seen in a common perspective before on any world map, but I think that this is the first year in which the islands and lakes of the world were displayed without oceans and land masses, and the effect is a little odd. If you take away the color and the text the image takes on a very definite biological flavor (I keep thinking of that tiny bone in the ear for the small lakes…) In any event it is far easier to compare these features without the distractions of the non-lakes and non-islands clouding and confusing our perspective fields.