A Daily History of Holes, Dots, Lines, Science, History, Math, Physics, Art, the Unintentional Absurd, Architecture, Maps, Data Visualization, Blank and Missing Things, and so on. |1.6 million words, 7500 images, 4.9 million hits| Press & appearances in The Times, Le Figaro, Mensa, The Economist, The Guardian, Discovery News, Slate, Le Monde, Sci American Blogs, Le Pont, and many other places… 5000+ total posts since 2008.

Author: JF Ptak

  • Comparing Building Heights: the US Capitol, Statue of Liberty, and Trinity Church, in an Unexpected Chicago Skyline (1894)

    JF Ptak Science Books  Quick Post

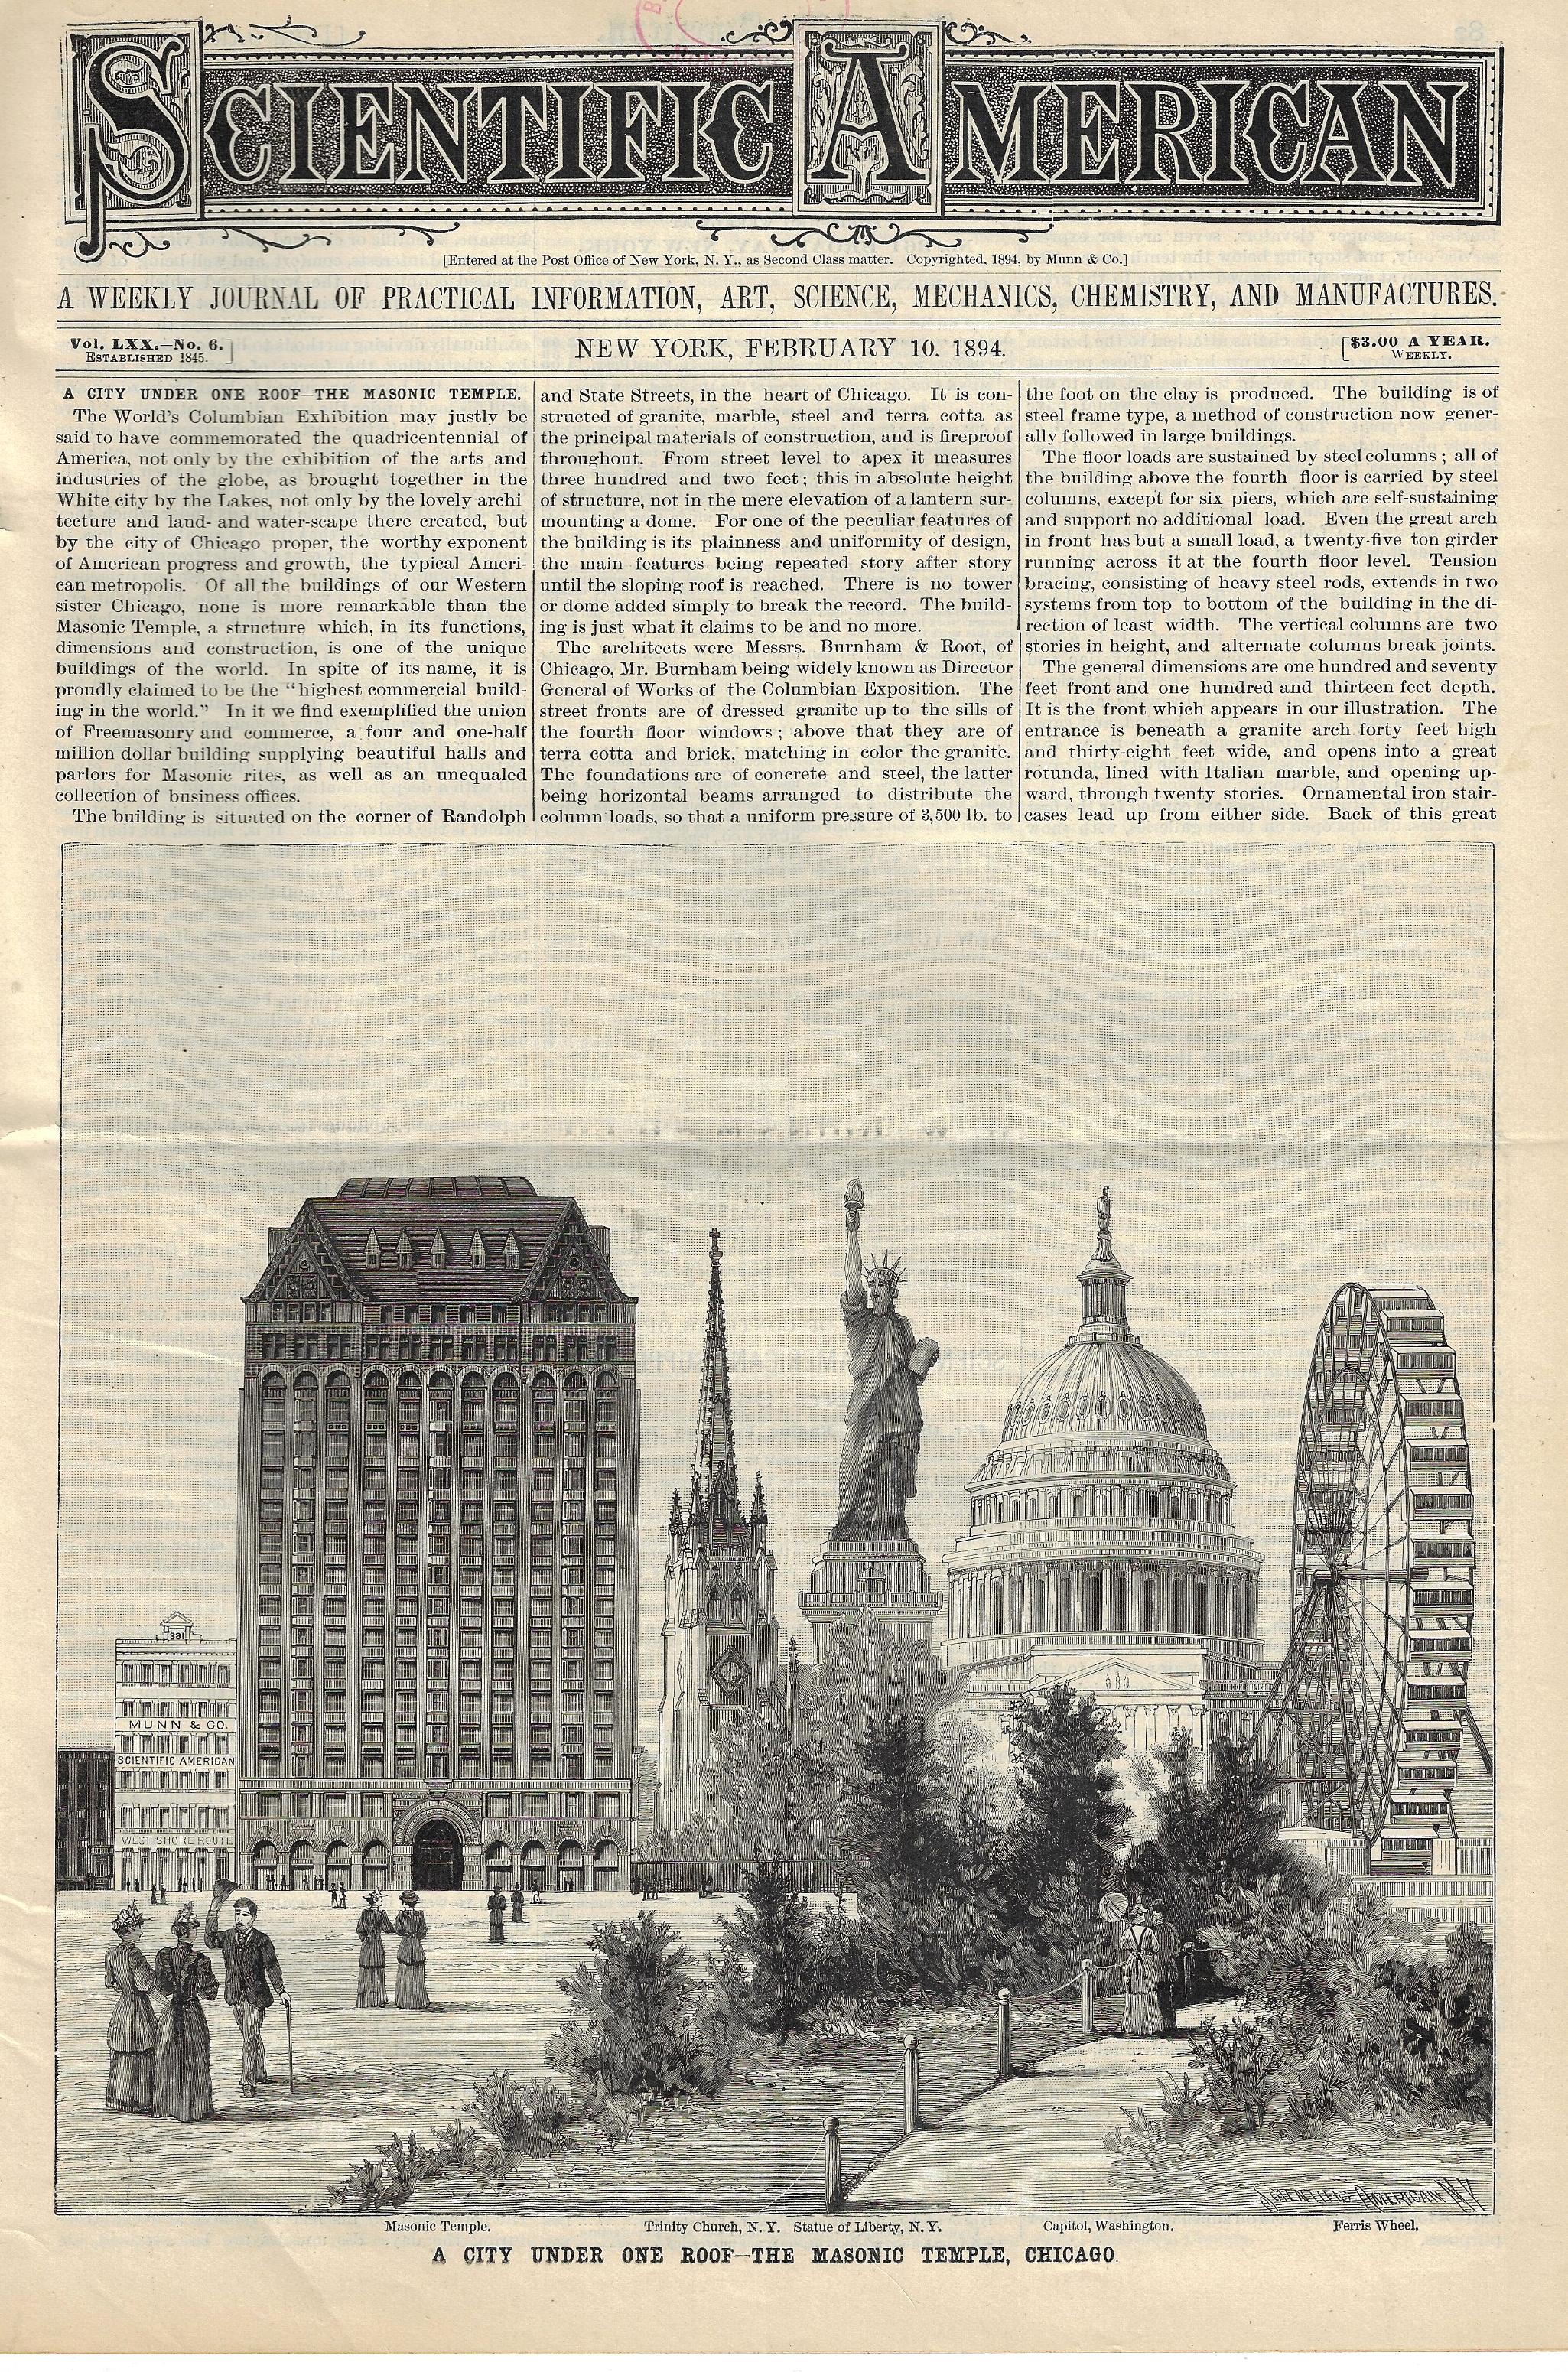
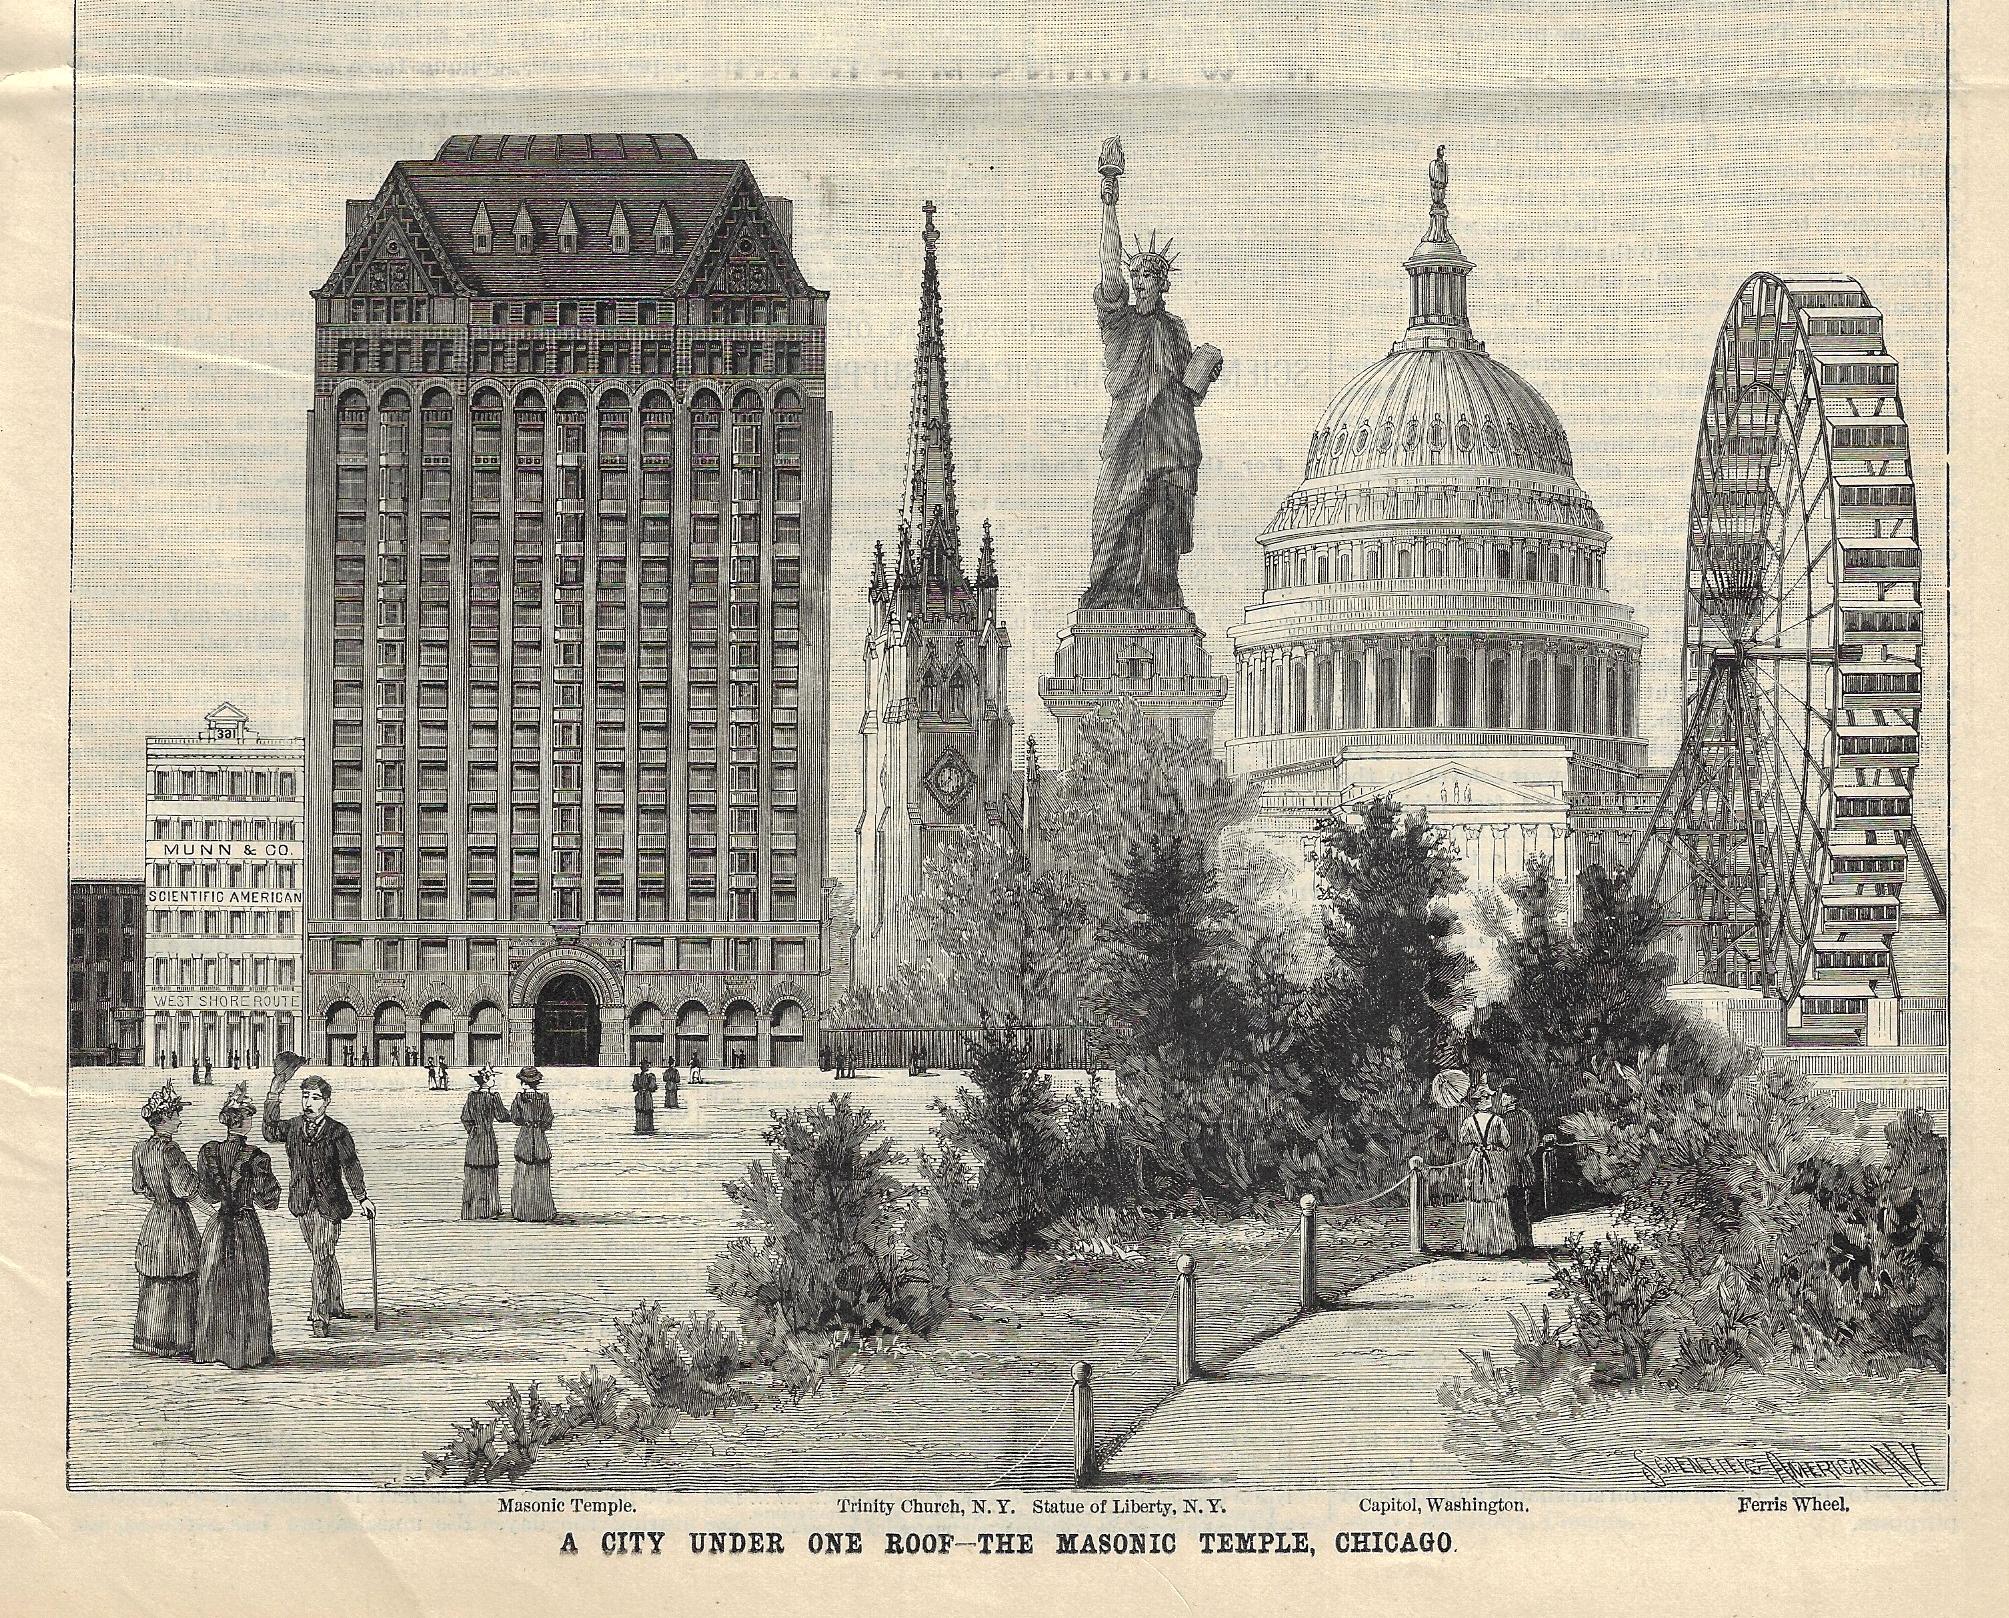
    In the several comparative heights of buildings images that have been posted to this blog in which buildings are compared to other buildings (and not enormous loaves of bread, or ears of corn, and so on) it turns out that many of them are set in a generic or fanciful landscape. Few that I can recall compare one building to several others in situ, as it were, using the area in which the building of note exists–and the example below yet again is one of those created landscapes. The building is the Burnham and Root Masonic Temple, in Chicago, and when it was built it was right in the heart of the city, without a field in the foreground. When completed in 1892–just in time for the Columbian Exposition–it was the tallest commercial building in the world, and also one of teh world’s tallest structures. The editors of the Scientific American commissioned this comparative, showing the new building (302′ high) in relation to the great Ferris Wheel in Chicago (288′), the U.S. Capitol (288′), the Statue of Liberty (301′), and Trinity Church (284′). Just for the sake of it the artist included the Broadway offices building for the Scientific American printer, Munn & Co., to the left of the Masonic Temple.  

    I have basically nothing to say about the building, not knowing it at all, and am just passing along this fine comparative image. (There are numerous pages devoted to this structure online.)  

    Source: Scientific American, 10 February 1894. 

    Sci Am 1893 dataviz detail

    Sci Am 1893 dataviz comparative height


  • Unexpected Beauty in Antiquarian Homemade Bindings

    JF Ptak Science Books   Quick Post 

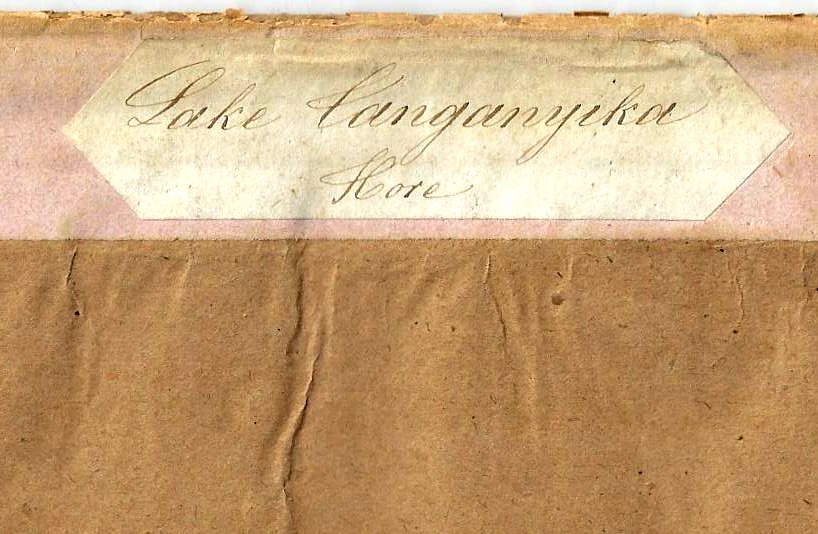
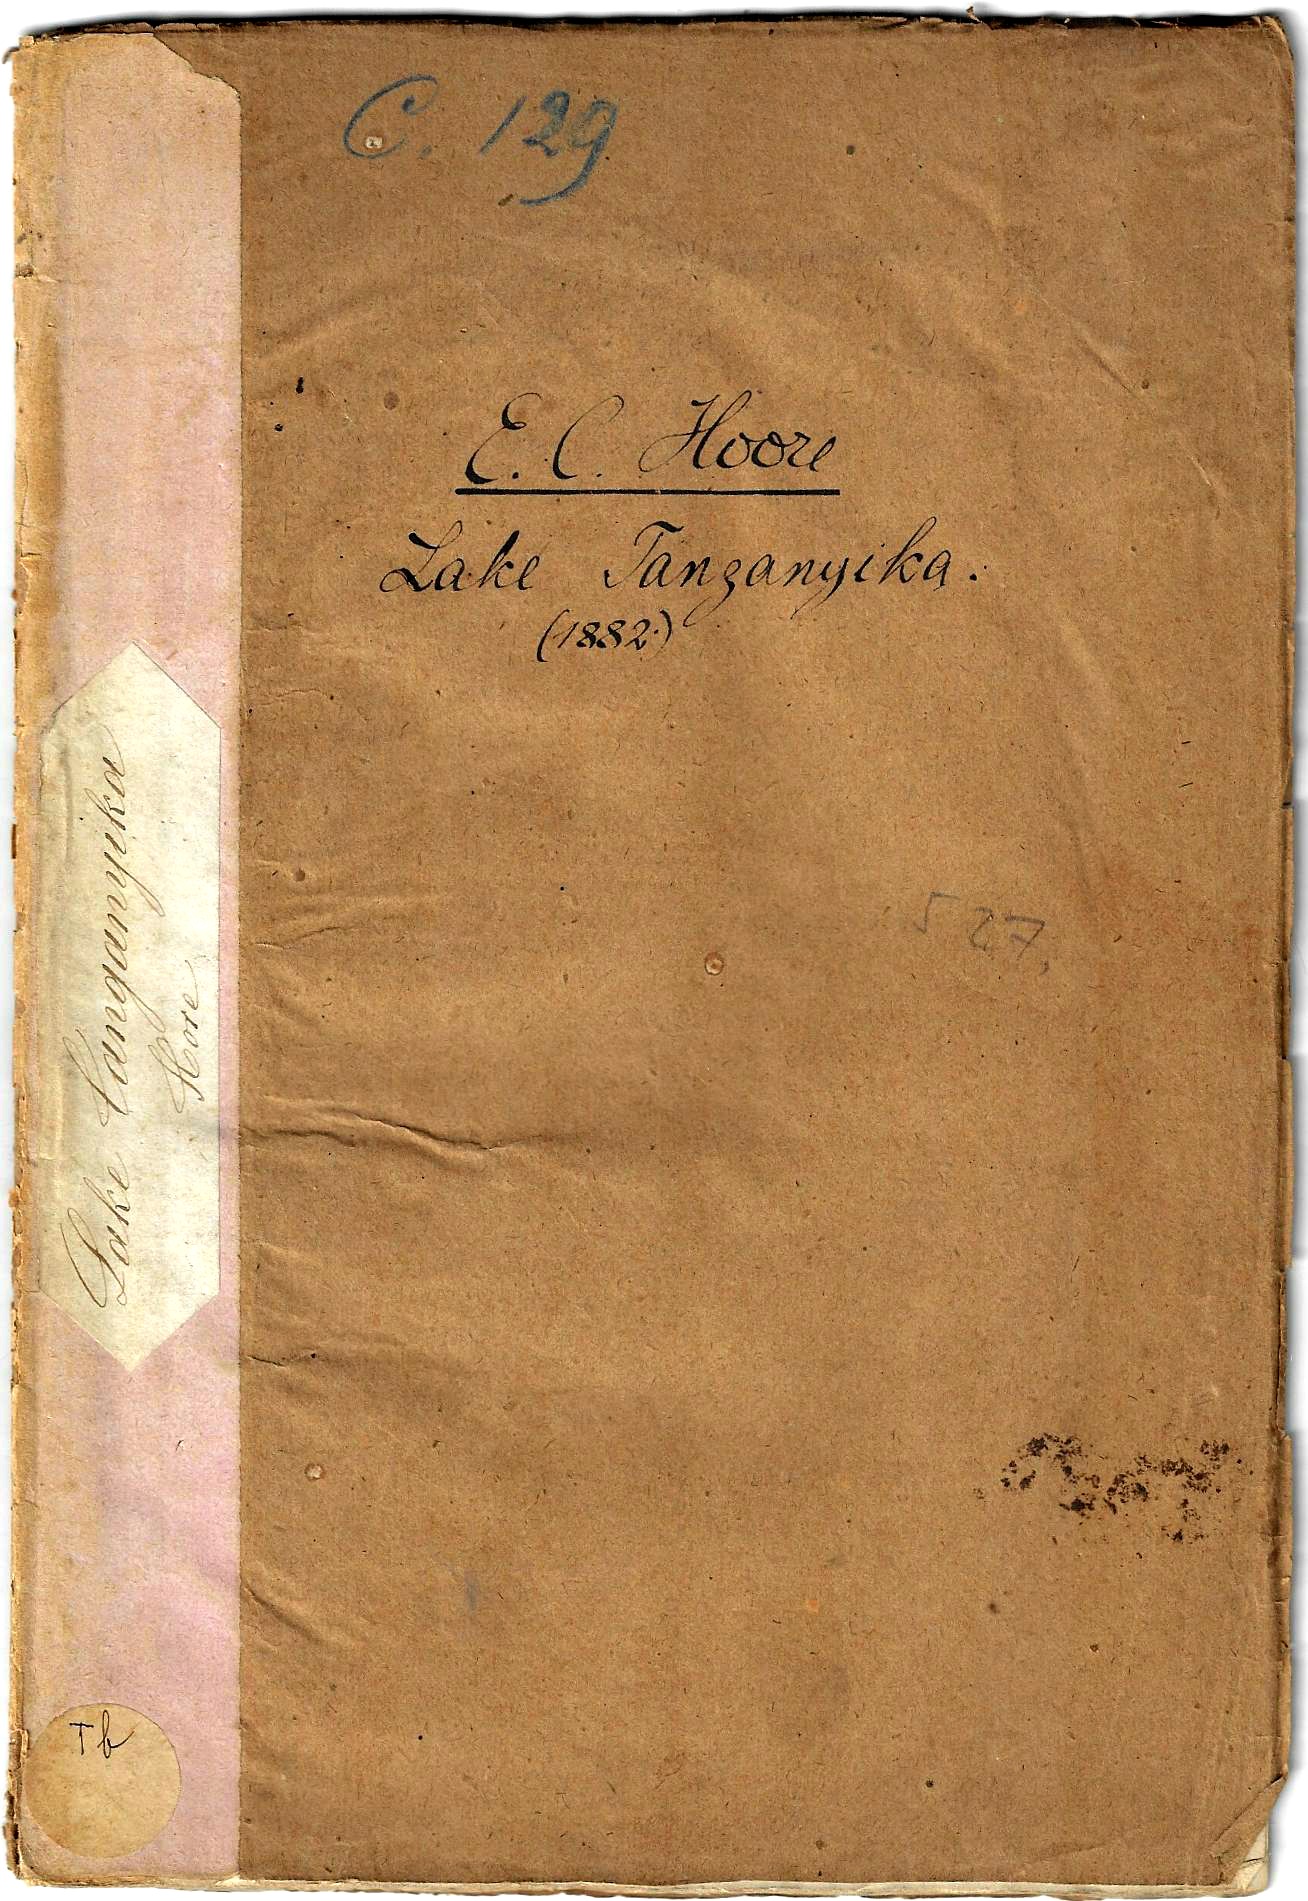
    There is a special beauty that comes with the imperfection and homemade qualities of an antiquarian bound-at-home book or pamphlet. I think that much of the time–in my experience–these bindings were made of whatever was available. Their irregularities can be charming, lovely even, the more imperfect but working/workable their attempts present an admiration for that amateur’s work so long ago. And so tonight I’m just going to quickly share one of these examples that just bobbed up–a homemade for a report from the Royal Geographical Society (1881) on Lake Tanganyika:

    Books covers Lake Tanganyeka detail


    And the full frontal:Books covers Lake Tanganyeka


  • A Tough Place to Work: in a Box, Submerged, Digging Muck and Boulders from a Riverbed (1870.)–Expanded

    JF Ptak Science Books   (Expanding Post 2686)

         Before the Brooklyn Bridge (begun in 1870 and opened 1883) became its incredible self, there was a lot of King-Hell work to be done before the recognizably visible bridgey part could be started. Amidst all of the thousands of bits that had to be figured out before a stone or cable could be moved, before the bridge-builder John A. Roebling (1806-1869) could begin to build, he had to construct the gigantic towers which were the great heart of the bridge on solid footing in the East River, and in order to that you had to get to the bottom of the river and then dig from there.  Roebling found the solid that he needed, but it was 80 and 40 feet below the river (on the NY and Brooklyn sides),  and so it came to pass that Roebling became one of the few U.S. experts in building the apparatus that would allow you to dig down under the bottom of a river. (Roebling became an engineer at a time when there really weren’t very many of them, and the profession was quite small–according to the U.S. census there were only 512 in the U.S.; in 1880, when the bridge was nearly completed, there were 8,600. This number expanded to 45,000 in 1900 and then 230,000 by 19301.)

         He created what was basically an upended box, an enormous, 180’x120′ (with a 9′ ceiling that would be 6.5′ at the end) half-city-block/half acre open-bottom box, called a caisson2.  The idea was that as it was sunk to bedrock the entire structure would be braced with hundreds of thousands of bricks and then filled completely with cement. That would be the base for the 30,000 tons of masonry blocks (each about 4-7 tons) that rested on top of the 15 layers of massive timber ceiling that rested upon the brick and cement that sat on bedrock. 

         In the course of excavation the caisson would be filled with pressurized air, and then with its various modes of entry it would accommodate three shifts of about 80 men inside it, shoveling away at the muck and picking away at boulders, digging their way into the river bottom.  (Soon enough they would be blasting the boulders in the pressurized air compartments of the caisson, encapsulated by timbers waterproofed with highly combustible materials that were covered by pitch and protective layers of this and that, but that is another of the very many engineering stories that could be told in depth and not to be included in this short note.) 

         The conditions for work were oppressive, and the pressurized air was difficult to work in and had long-term ill-effects on the body for some,  the contrast between light and dark was very stark and difficult with hard shadows, the workspace demanded an immediate body-soaking sweat, the noise of the general work (excepting the blasting and boulder-breaking) was “very considerable”, the muck and water was occasionally a foot high,  and the work itself was very physically demanding.  There were over 2500 men who worked in the caissons over the 10 months that they were in use, which according to David McCullough in his excellent The Great Bridge3 meant there was an enormous turnover, 100 men a week…and no small wonder. All for $2/day, which was a little better than standard pay for laborers (and equal to about $60/day in 2017 dollars so far as I can reckon, which is sorta/kinda minimum wage for 2008.)
    Brooklyn caisson large engineering 1873

    • [Image Source; Engineering, 1873]

         So here they are, the guy on the right is hauling the muck to an elevator shaft at right (more visible in the full version of the woodcut, following), while another fellow shovels, and a third man strands there surveying the scene with arms folded in a pose recognized world-wide at construction scenes.  The little squares above them show the cross sections of one row 12″-thick lengths of cut lumber (laid on top of another layer of the same running at a right angle, making 15 layers in all) on top of which stone would be placed. 
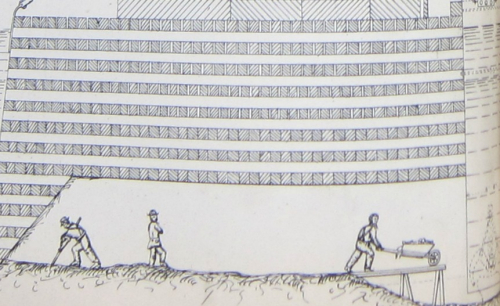
    Brooklyn Bridge Caisson Engineering 1873


         It should be noted in fairness that the supervisors hardly leaned on a shovel or struck an heroic pose in the Brooklyn Bridge construction. Washington Roebling, the son of John A. Roebling and who inherited the project after his father’s very untimely death in 1869 and who was one of the best-suited men in the country to take on the job, spent many weeks in the caissons doing whatever he saw fit to be done. He was one of the relatively few workers there who was overtaken by the demands of the pressurized air, and spent the rest of his life (he died in 1929) dealing with the aftereffects of it.  

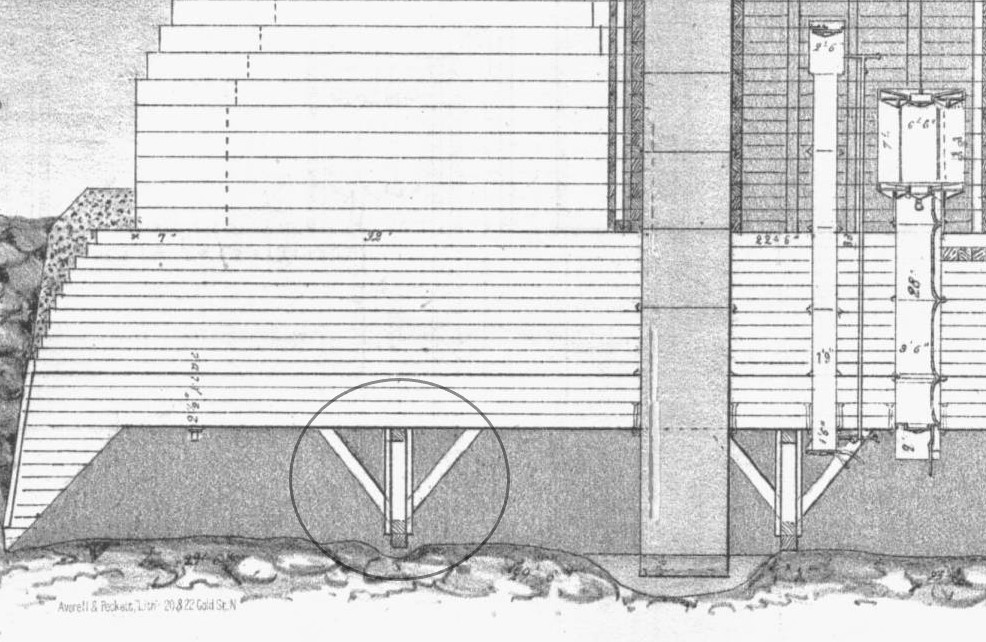
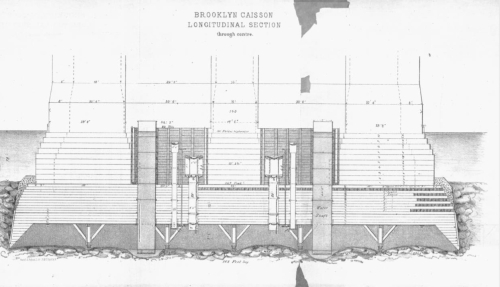
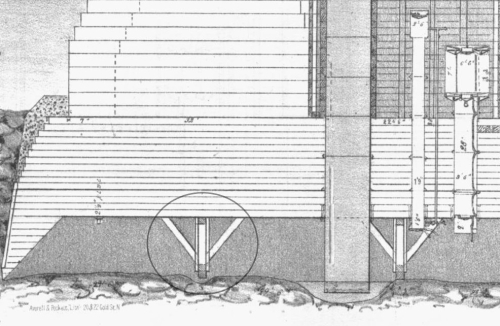
         There were air shafts and elevators and pneumatic tubing to pull out excavated earth, and as the workers dug down, the caisson would sink, and with each movement enormous blocks of granite would be placed on the top of the caisson to help it sink further.  And so this would be the process, digging down through a silty river bottom, pulling out the very heavy muck, the caisson moving down as the earth was removed, continuing the process until bedrock was reached. The caisson movement though proved to be a lot more involved than the initial design, where the edges of the thing were supposed to eat and push their way into the earth as ground was removed from around the base, with the enormous tonnage above providing the weight to push the whole thing. But it really didn’t work out that way, and the caisson(s) for the most part didn’t work their way into the riverbed. What happened was that numerous chock blocks were place and large hewn timbers place on top of them to the caisson’s ceiling. And then, once the river material was removed from the perimeter to a certain depth, the blocks would be knocked out from underneath the support, and with practice, the entire structure would set into place, moving down. And then the process would begin again, over and over.

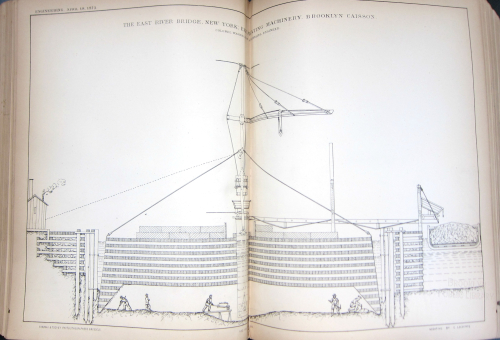
        This is another cross section of the caisson, followed by a detail showing the blocks:
    Brooklyn bridge caisson W Roebling

    • [Image source, for the images immediately above and below:  W.A. Roebling, Pneumatic Tower Foundations of the East River Suspension, [the caissons of the Brooklyn Bridge] New York, Averell & Peckett, 1873. The full text is available from Lehigh University http://cdm.lib.lehigh.edu/cdm/ref/collection/bridges/id/1406]

    And the blocks and supports, the blocks being knocked out once all of the mud and stone had been removed from the circumference of the caisson:
    Brooklyn bridge caisson footer detail

    And then, it was all filled in, more weight was added to the top of the caisson, until that special engineering sweet spot was reached that allowed you to start building the bridge’s towers from which the bridge span would be suspended.

    This was a very difficult job and absolutely vital job, not the least of which was the problem of decompression sickness, which affected many dozens of workers, and which was not well understood.  

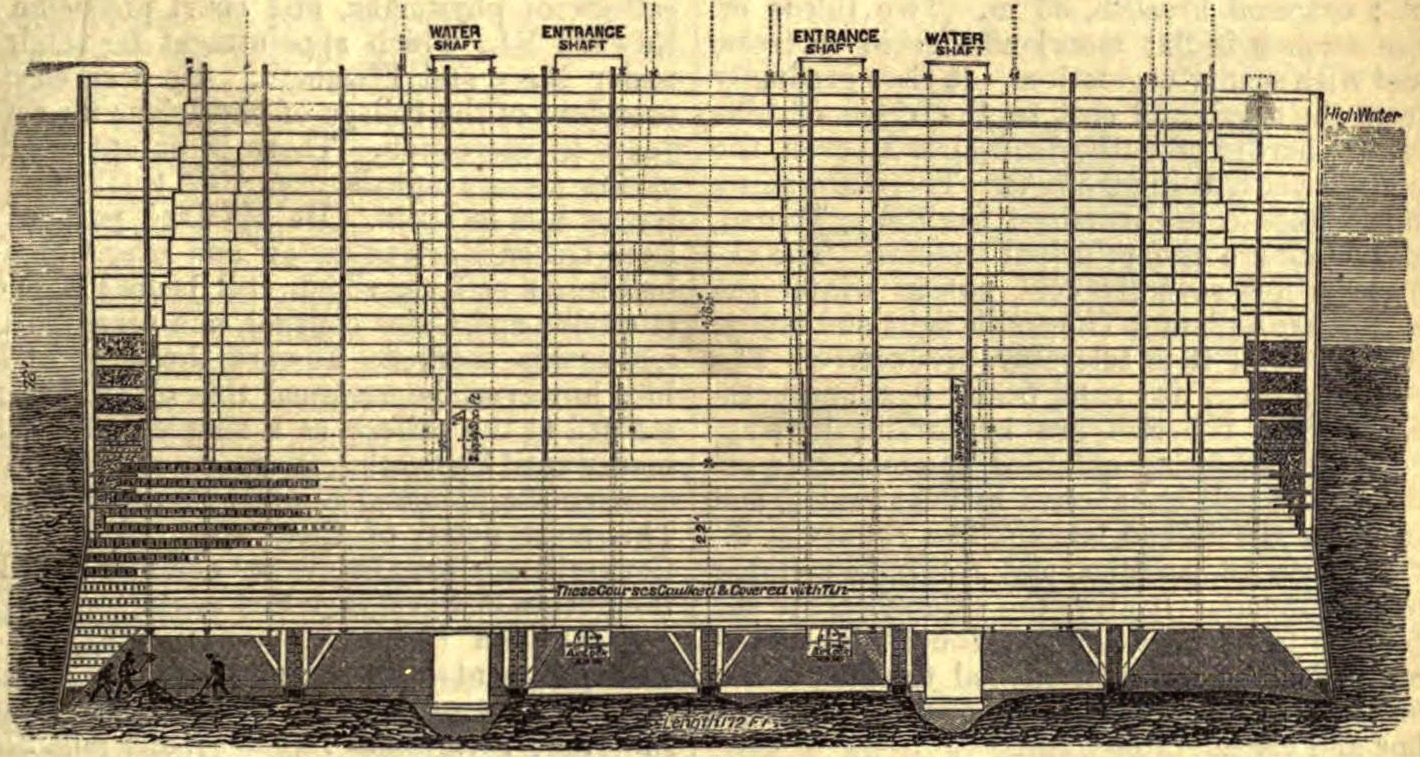
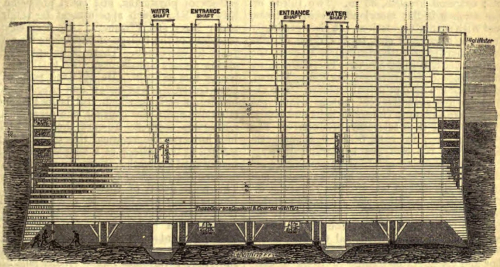
     Another image, this from The American Cyclopedia, showing the caisson at a more developed stage, and feeling that much more suffocating, and I think communicates the idea of extreme weight a little better than the others:
    Brooklyn Bridge Caisson wikimedia

    • [Woodcut/drawing illustrating caisson used by W. A. Roebling in the construction of the Brooklyn Bridge. The American Cyclopædia, v. 3, 1879, p. 557 (Fig. 2).]

         I really haven’t gotten to the most difficult jobs on the bridge. Almost at the very end of the work on the Brooklyn side there was a fire in the caisson. Up until this point there had been a number of small fire that were quickly extinguished. But nearly at completion a worker managed to ignite one of the combustible materials used to sheath the ceiling, and a small section caught fire. Given the pressurized oxygen and other factors the fire progressed to An Enormous Situation. Long story much shortened, the fire was thought to be put out until after one of the continuing series of investigation in making sure that the fire was out revealed that in fact it was not–to make matters worse, it was mostly invisible and smokeless.  Many complications and complex solutions later, the fire definitely extinguished, the time had come to finally repair the damage. The fire had eaten its way through several of the 15 layers of the wooden beamed ceiling, and those damaged parts needed to have the crystalized carbon scraped away so that the then-vacant area of wood could be filled with cement. And here it comes: it fell to 18 carpenters to pull their way as far as possible through the burned-out sections of the ceiling to scrape and chip away the burned parts. That means they were underwater, underground, in a cavernous submerged room with pressurized air, and crawling through wormholes in a 15′-thick wooden ceiling on top of which rested 30,000 tons of stone.  That, I think, was the toughest job done on the bridge. 

         30 workers were killed in various accidents during the construction of the bridge. Many considered that a bridge wouldn’t be safe unless there was some fatal blood spilled over it…and many considered that first victim to be John Roebling himself. He met his end before the physical work had been started on the bridge, killed because of a rookie situation he let himself into, he toes crushed by a ferry which led to tetanus and lockjaw, the old man dying a miserable death. He made notes and suggestions on the building of the bridge right up until the end, through the horrible stiffening of limbs and muscles as a result of the lockjaw. I guess he could’ve been considered the bridge’s first martyr. 

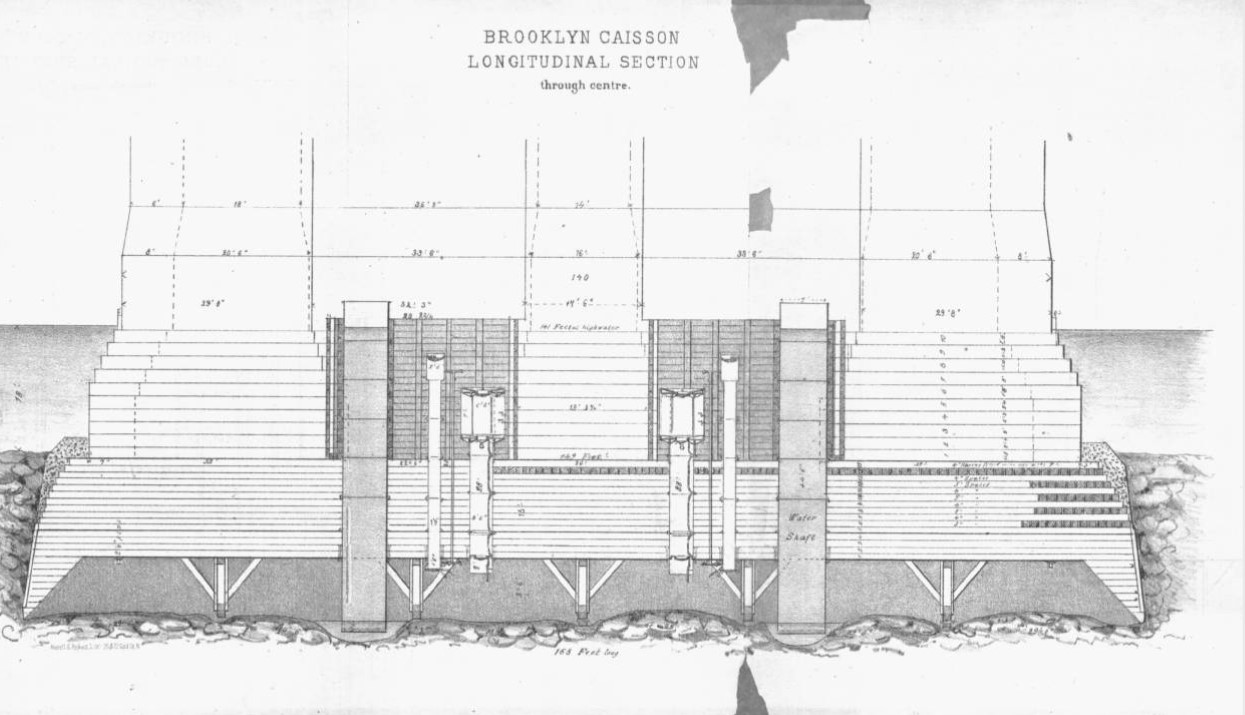
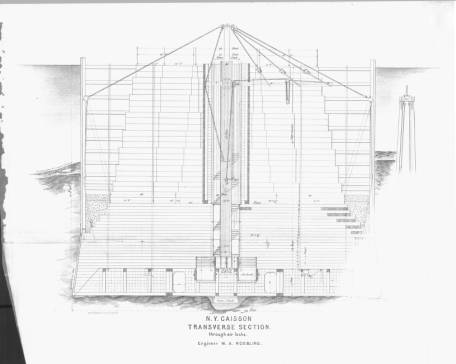
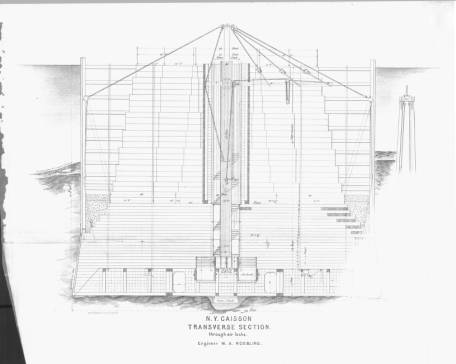
    And to balance things out a bit, here’s the transverse section of the caisson:
    Plates__Page_9

    • [Image source:  W.A. Roebling, Pneumatic Tower Foundations of the East River Suspension, [the caissons of the Brooklyn Bridge] New York, Averell & Peckett, 1873. The full text is available from Lehigh University http://cdm.lib.lehigh.edu/cdm/ref/collection/bridges/id/1406]

    Notes:

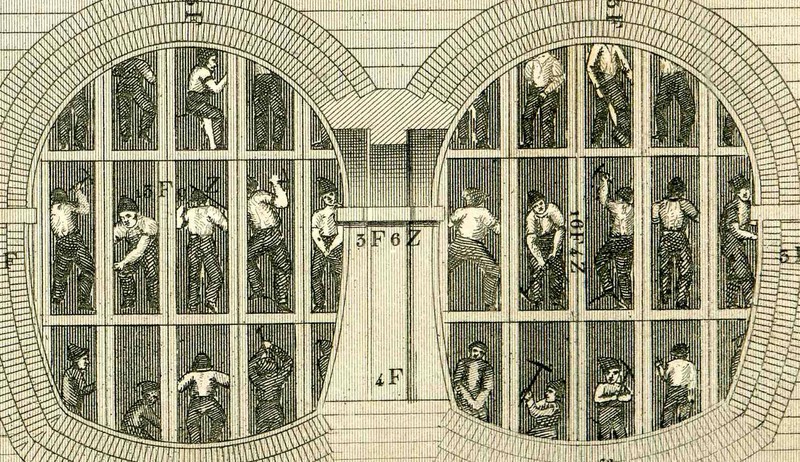
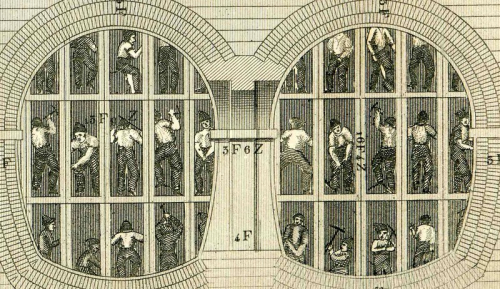
    I can’t help but include another image of a hard place to work, this one for the Thames Tunnel (from my post here: https://historyofideasblog.com/thesciencebookstore/2012/08/beautiful-technical-illustration.html)
    Tunnel detail thames


    1. Cecelia Tichi, Shifting Gears, Technology, Literature, Culture in Modern America. Chapel Hill, 1987, p 104. 

    2. “Caisson:  in architecture, a panel sunk below the surface in soffits or ceilings. In civil engineering, the term is applied, first, to a hollow floating box, usually of iron, which serves to close the entrances of. docks and basins; and second, to a box-like structure used in constructing or sinking the foundation of piers under water. Of the latter there are at least three different varieties: the ordinary, the bottomless or open, and the inverted, which includes the pneumatic. 1. The ordinary caisson is a large box with bottom and sides, made of timbers or planks, in which masonry is built and sunk to its desired position under water.”–The American Cyclopædia, v. 3, 1879, p. 557

    3. David McCullough, The Great Bridge, the Epic Story of the Building of the Brooklyn Bridge, Simon & Schuster, 1972. 

    For excellent source material see: W.A. Roebling, Pneumatic Tower Foundations of the East River Suspension, [the caissons of the Brooklyn Bridge] New York, Averell & Peckett, 1873. 

  • Looking for Bastogne (1939)

    JF Ptak Science Books   Quick Post

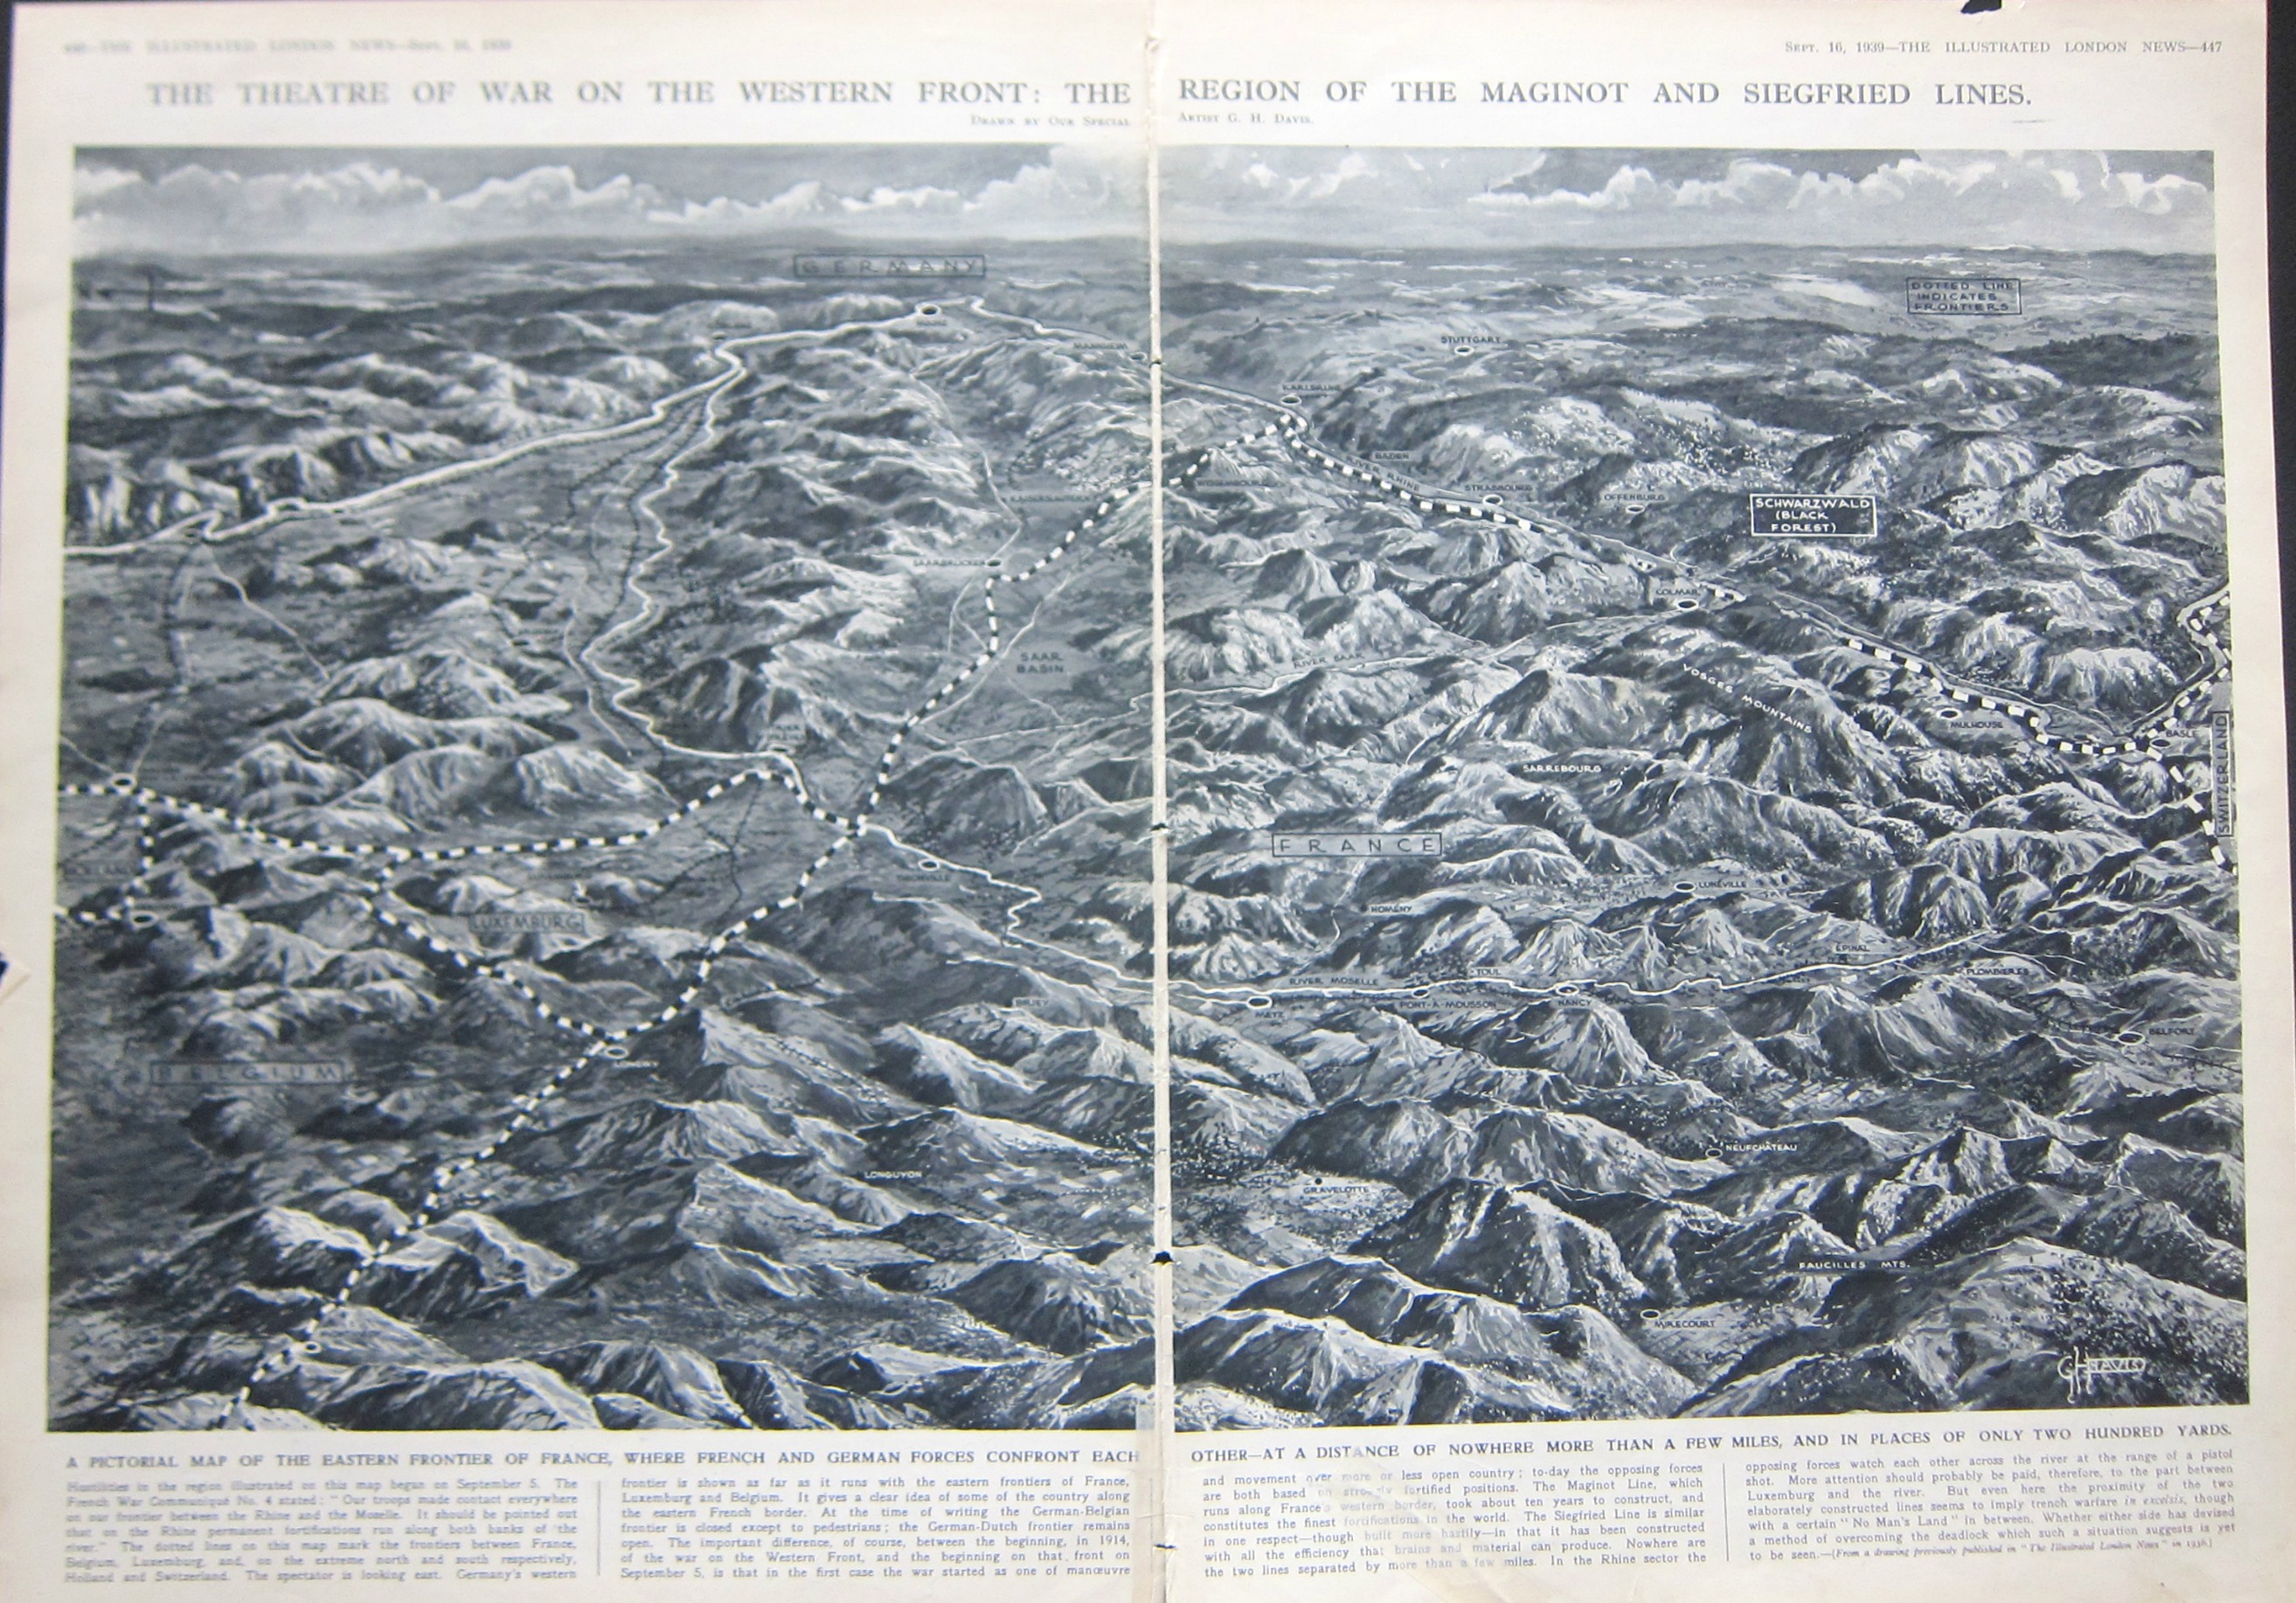
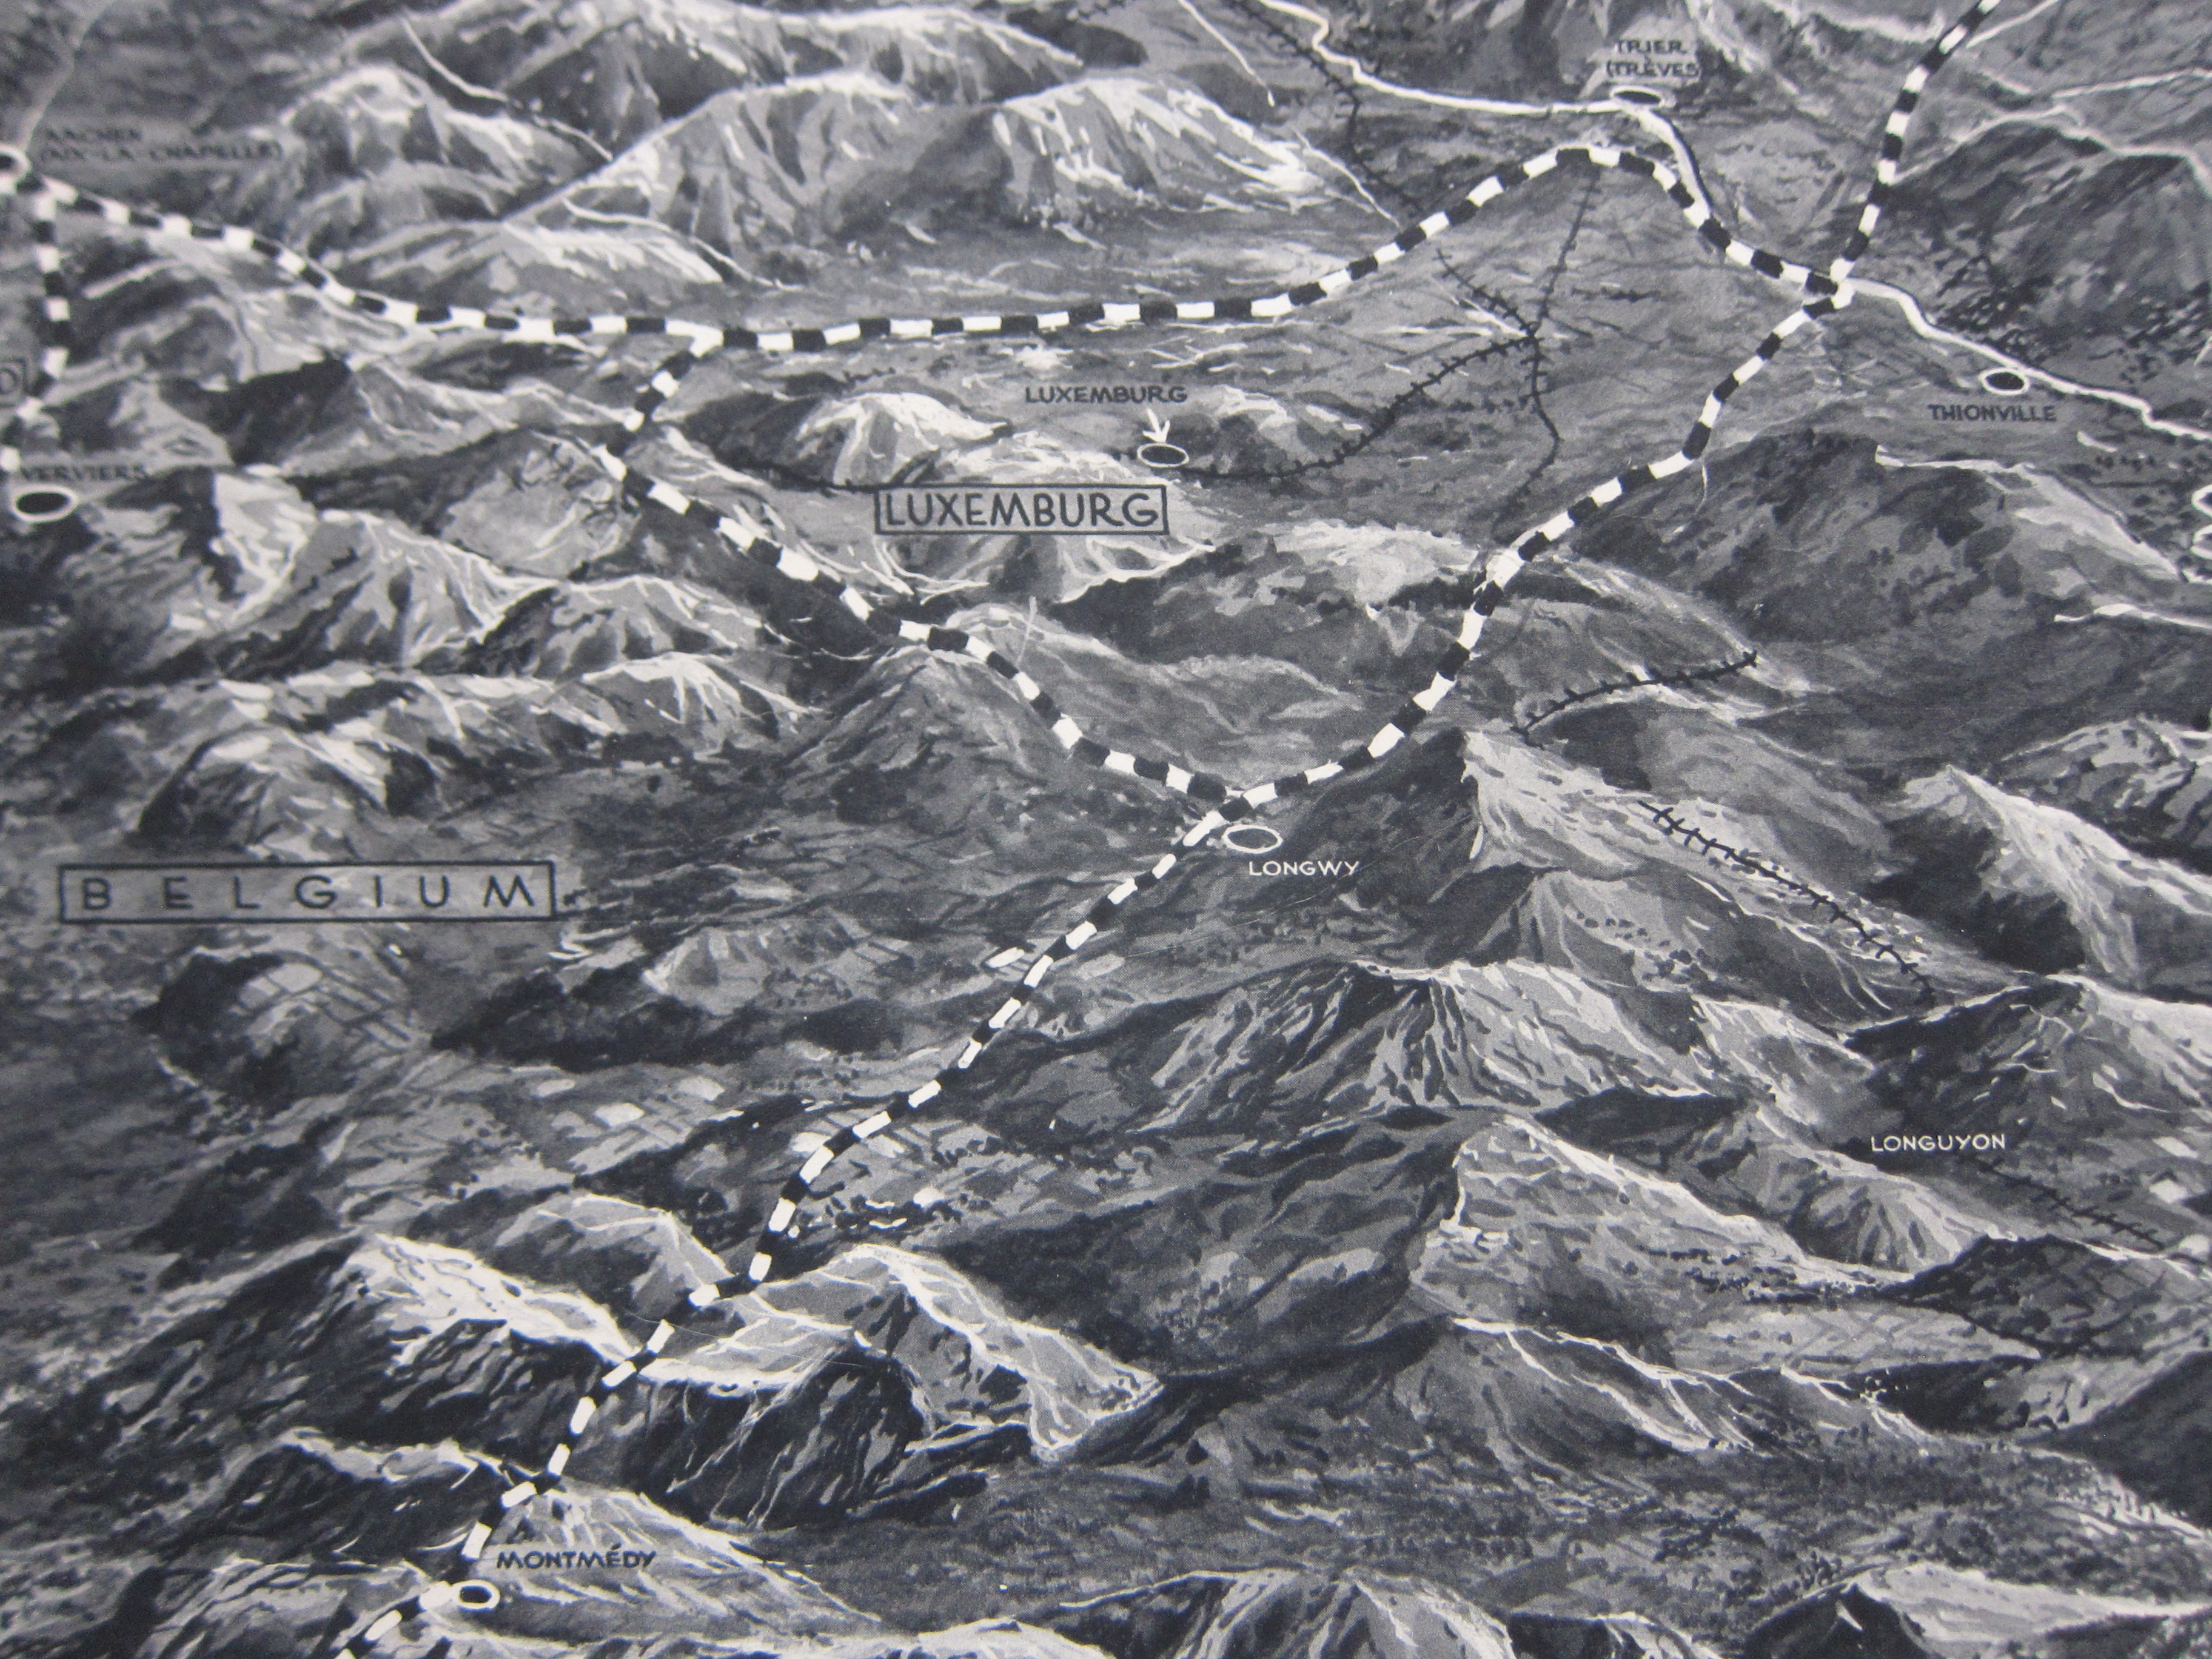
    This double-page map from Illustrated London News caught my eye–it shows “the theatre of war on the Western Front” at the end of the second week of the European war, 16 September, 1939, just five days after the war had been freshly defined for the first time as “World War II”. (From the OED: “1939   Time 11 Sept. 38/1   ‘Some of the diplomatic juggling which last week ended in World War II was old-fashioned international jockeying for power.’”) It is an interesting oblique view (north to the left) created by the great ILN illustrator, George H. Davis, showing the borderlands of Belgium, Luxenbourg, France, and Germany, the first three soon to be overrun. The map does seem to present a good bird’s eye for the region, and what I set out to find was the Ardennes–soon to come to life again as an unlikely entry point of attack to France, and then again to the Germans come Christmastime 1944.  Part of the Ardennes is seen at the lower left, though not identified. Triangulating the towens of Longwy, Longyuon, and Luxembourg City, I’d place the town of Bastogne at about the “G” in the title for “Belgium”.  The town isn’t on th emap now, but in five years, everyone will know where it is, named or not.  

    Maps WWII ILN 1939 Ardennes

    IMG_9195


  • The Fossil Record of Duchampian Motion–an Early Image in Spatial Time (1884)

    JF Ptak Science Books   Post 2747

    MArey May 1884_2_

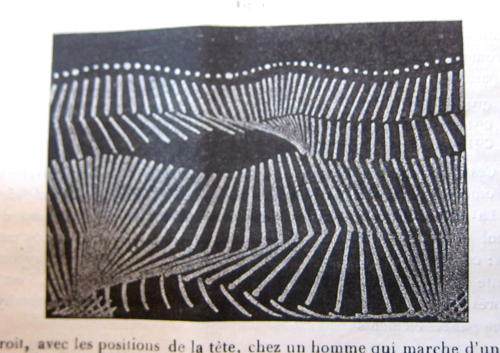
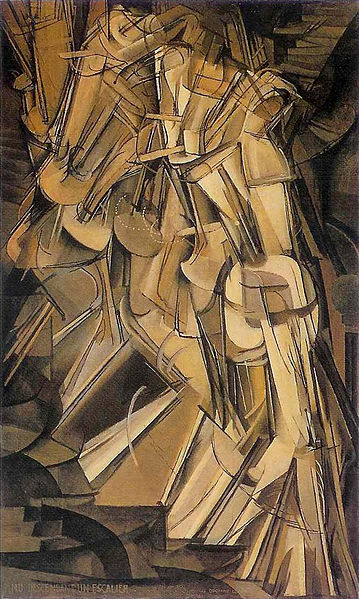
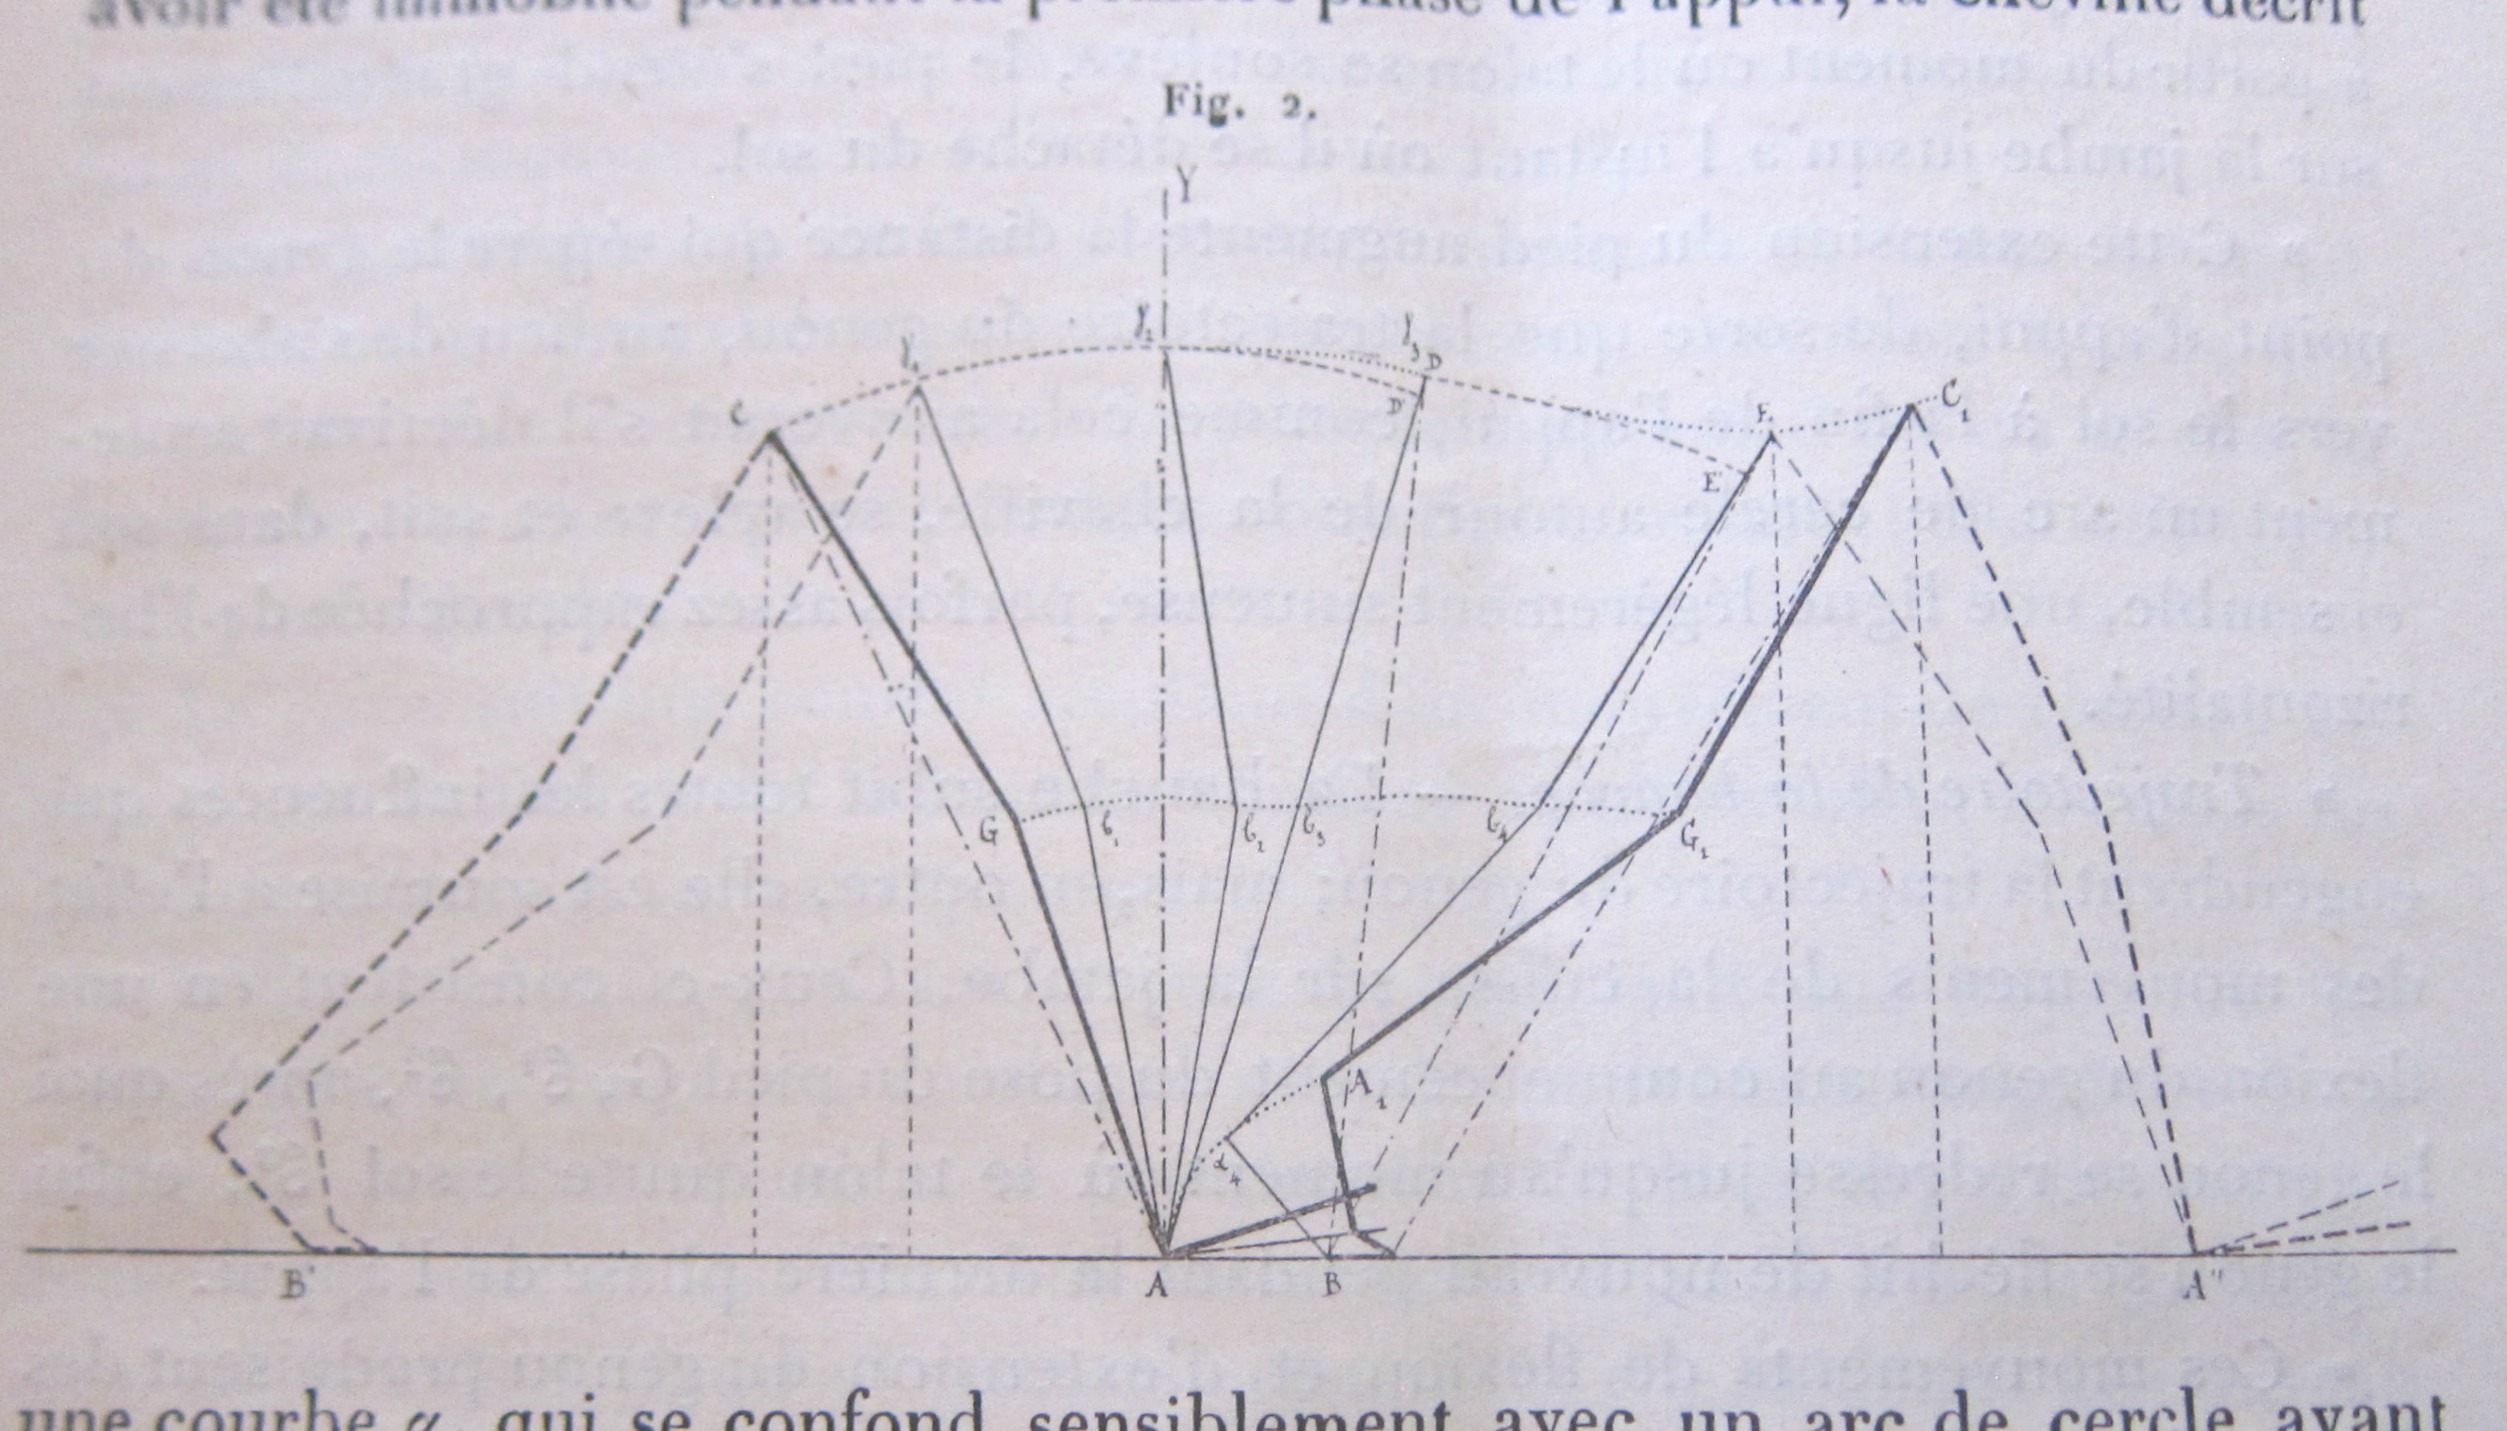
    This is one of those times where science precedes art–that’s the least significant aspect of this image, as the folks seeing it in 1884 couldn’t see into the future didn’t know that they were looking at what may pass for prehistoric fossil record of Duchamp’s 1912 Nude Descending.  The Duchamp would cause trial and occasional outrage in much of the artworld due no doubt to it challenging aesthetic–I don’t know what the readers of the Compte Rendus thought when they saw this image, but I suspect it did not involve evaluating its artistic impact.

    This is the work of Etienne Marey (who has made a number of appearances on this blog), a very smart and versatile guy who would go from physiology to cinematography to aerodynamics in the course of his life and be a leader/pioneer in each field.  Marey published this “strobophotograph” in his article “Analyse cinematique de la marche” in the Comptes Rendus on 19 May 1884–this was a brilliant effort in the analysis of human locomotion by making a dozen or two exposures on a single photo sheets of a reflective-outlined walking figure. This was different from Marey’s birthyear and deathyear buddy, the other motion picture pioneer, Eadweard Muytbridge (1830-1904 for both). Marey introduced his “chronophotography” and studied aspects of movement and motion that had been dispersed to human history because of the inability to observe and record them–with Marey, that issue necessary for the beginning of real scientific discourse was to a large extent solved. 

    Duchamp_-_Nude_Descending_a_Staircase

    Marcel Duchamp’s Nude Descending a Staircase, 1912, via Wikicommons

     There are more applicable Marey images for the Duchamp–for example his series on a single sheet of a naked woman descending a short set of stairs–but the image above has more aggregated motion in a confined space sense to it, so I’ll stay with the sense-impressions than the more-visual ones. 

    And here’s Marey’s  modeling of the action:

    Marey May 1884

    In any event, I just wanted to pass on this quick note on some seldom-seen Marey images…


  • A Reverse D-Day, 1803

    JF Ptak Science Books  Post 2746  

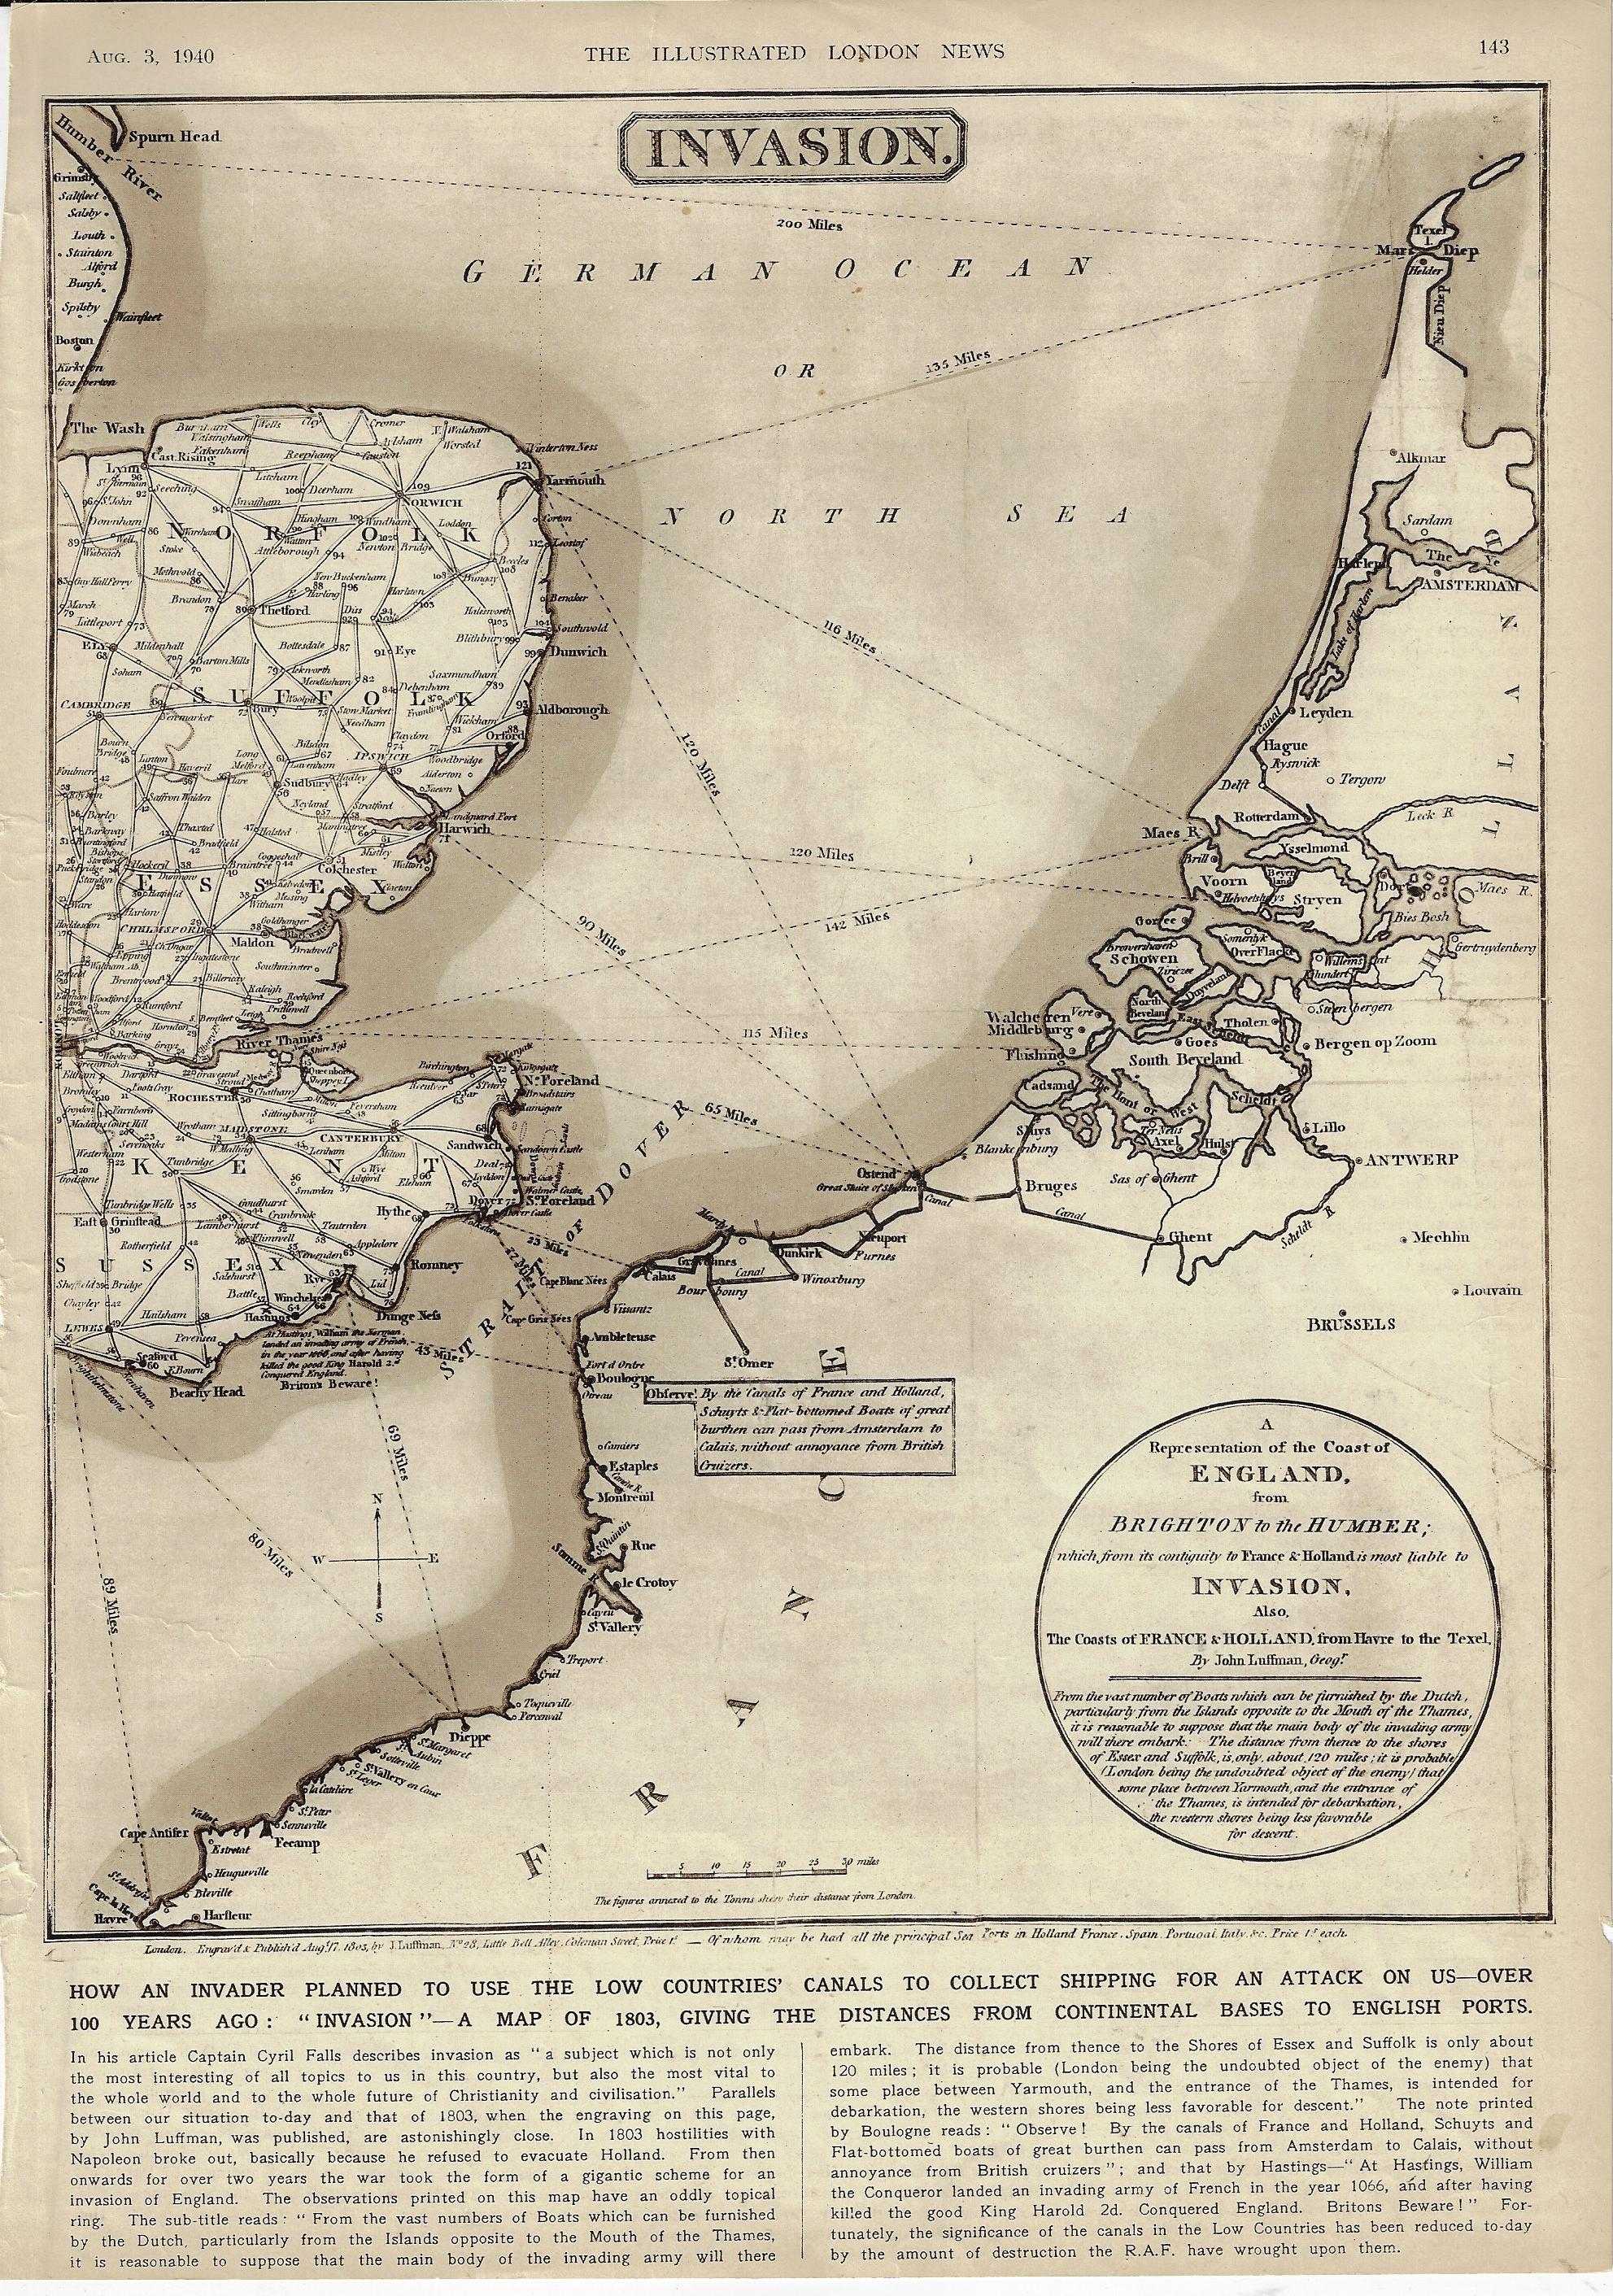
    There have been many D-Days in the history military terminology, but for almost everyone it refers to the Allied invasion of Normandy on 6 June 1944. In 1803 when Napoleon was in high form and making his way through Europe there was a wide concern in England that he would attempt a cross-channel attack and invade the country.  Which leads us to this map1 that I just found (again) in the Illustrated London News for 3 August 1940–the map entitled “Invasion”, showing the possible routes that the enemy might take in crossing the channel. 

    This was published at the time where the very real threat of invasion loomed like an angry low-ceiling mammatus cumulus, ready to break. Belgium, Luxembourg, and the Netherlands were defeated three months earlier, Dunkirk had just been sustained and the evacuation completed two months earlier; one month later, in July, the Battle of Britain had begun. It was not the French this time, but Germany–though the French had just weeks earlier surrendered without much fight and signed a disgraceful armistice with Germany, further weakening the very bad position of Great Britain. France was invaded in May and surrendered in June, an incredible collapse of what had just a few years earlier been Europe’s leading army, encamped behind the instantly obsolete Maginot Line.  It would be another 16 months before the U.S. entered the war, and another 46 months before the Normandy Invasion would cement the endgame for the war in Europe.  There was one gigantic good thing that happened in May–Winston Churchill became the Prime Minister. 

    Perhaps the editors at ILN sought to show the stoic Brits that they had been “there” (but now “here”) before, and nothing came of the Napoleonic threat. Of course there is almost no discussion of earlier attempts at invasion–though there is some fine print on the map quietly shouting “Beware Britons” about 1066 and all that.

    The odd thing about this map–made by J. Luffman and published 17 August 1803–is that I haven’t been able to find it online. The mapforum group has a very interesting entry on Luffman as well as images of a different map showing a much greater area.2 And so here it is–perhaps I’ve missed the thing, somewhere, but I just haven’t been able to find it. 

    The Luffman map comes very close to concentrating on the WWII D-Day theater of operations, the map extending as far to the SW as Le Havre, which misses by just 10 miles the Eastern Task Force beachhead at Sword.  

    Map invasion 1940

    Notes:


  • Aeroplane Roulette, 1912

    JF Ptak Science Books   Quick Post

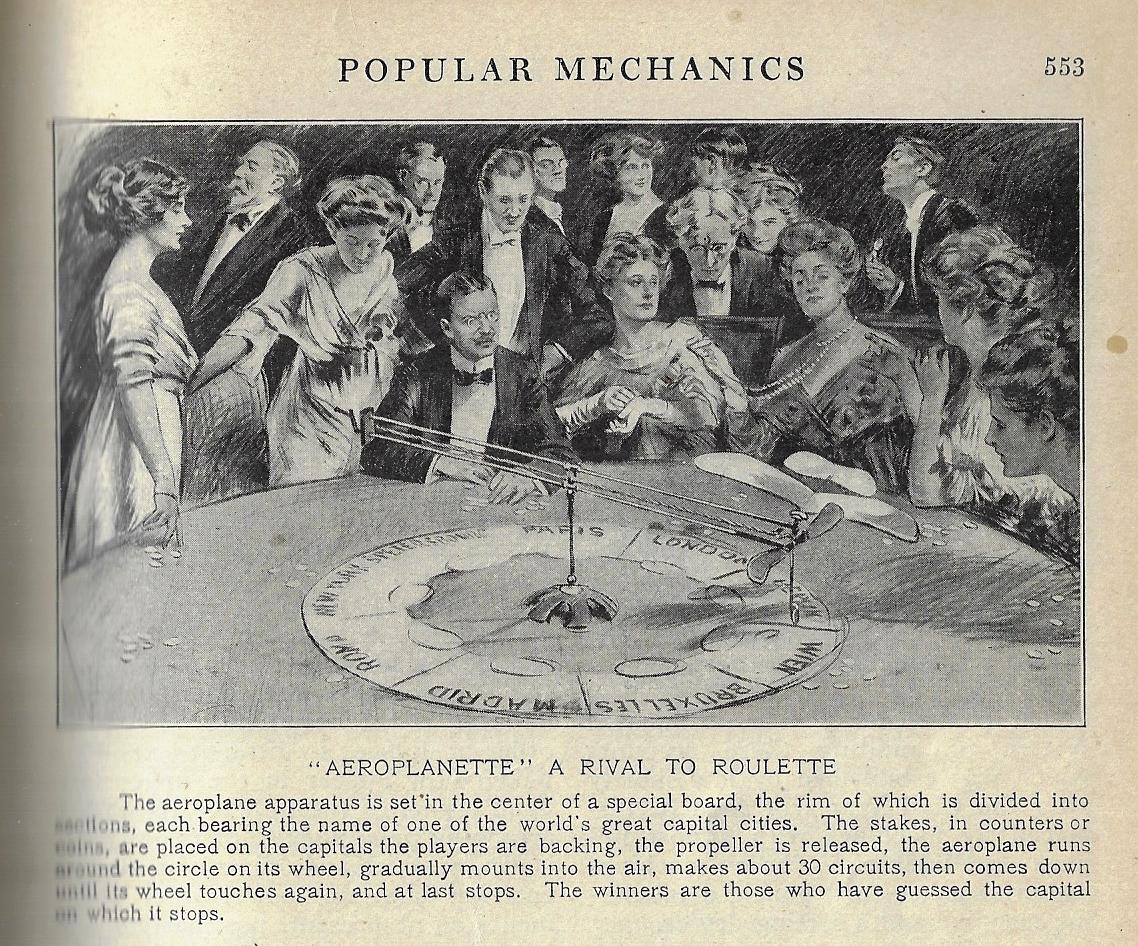
    It took a few years for the Wright Brother’s iconic and monumental flights of 1903 to be thoroughly and popularly deemed not-crackpot, but once that was the case, the Wrights, and their flying machine, and aeroplanes in general, were heralded as the future-arriving. (It seems to me that their fame was mounting over a few years, but still, their reception was limited–it wasn’t like Einstein becoming instantly immortalized following the eclipse confirmation of 1919, being obscure one day and immortalized soon after, but they did go from relative quiet to international renown in a couple of years.) 

    In any event, by 1912 there were aeroplane toys, and games, and popularly sold sheet music for songs, and also, evidently, a version of roulette made to accommodate the cascading interest in the new technology. I had never seen this toy/game/gaming apparatus before tonight, and I was happy to see it:

    Pop Mech 1912 aeroplane roulette

    Source: Popular Mechanics, p 553. 


  • Data Visualization and Enormity 2: NYC Overtaken by Gigantic Corn, Bread, and Cigars (1912)

    JF Ptak Science Books  Post 2745

    On this blog I have entertained stories about Manhattan being completely detached/uprooted, attacked by bloomers and aliens and spaceships and spaceship aliens, floated above itself, nuked (numerous times), miniaturized, crushed under sudden ice, joined to Brooklyn and New Jersey (?!), and other such game-enders. There have also been posts on data visualization techniques comparing the known to hard-to-grasp bits of other information or statistics or entities, using the Brooklyn Bridge, Woolworth Building, Empire State Building, Eiffel Tower, Hoover Dam, and so on, as measuring sticks for oil or nail or auto production and the like. It seems that only once before on this blog of nearly 5k posts has Manhattan been used as an intellectual tool of comparison for something non-nuclear-related, and that was for a salt mine. (And according to advisers to President Merkin Muffley the salt mine comes close to playing a strategic nuclear role.) This in mind, finding today’s piece of Overtaken Manhattaniana was a fabulous bridge between two imaginary islands of not very useful data visualizations(s). 

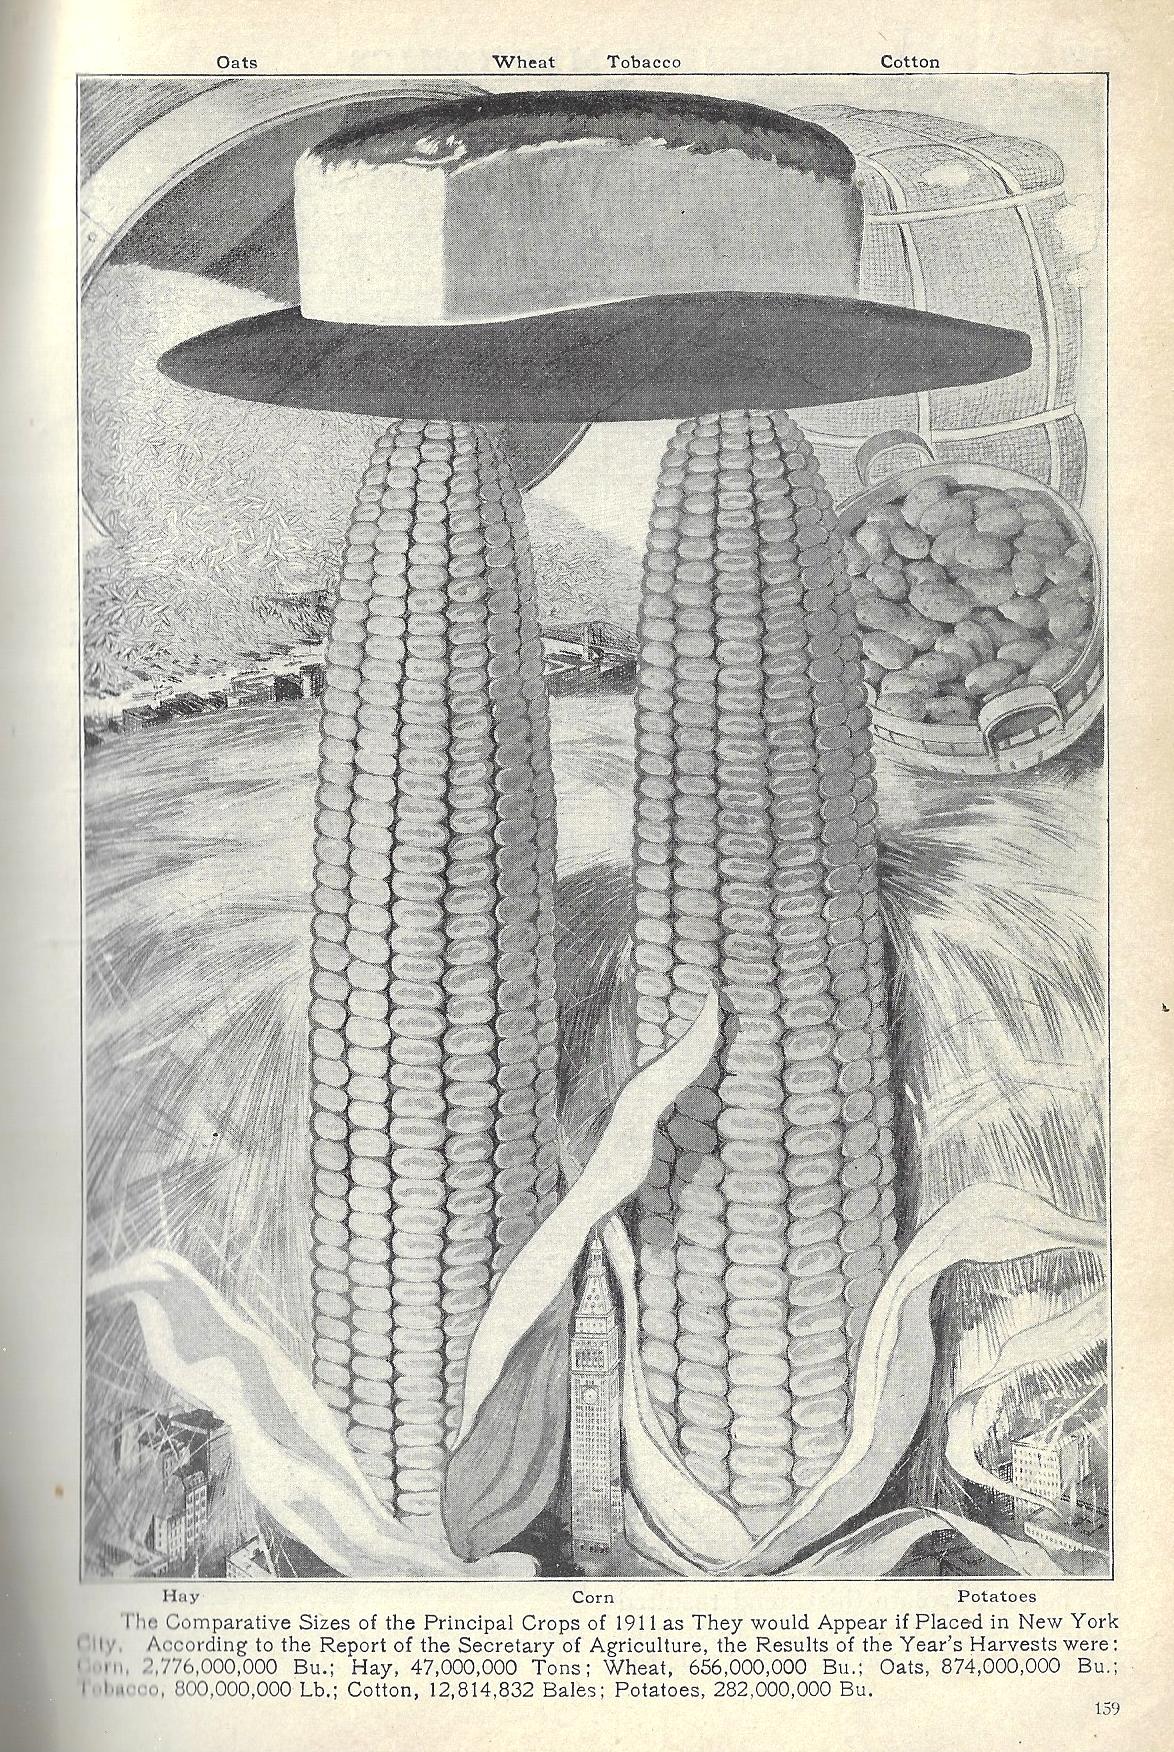
    Pop Mech 1912 Dataviz crops NYC

    Image source: Popular Mechanics, 1912, pg 159.

    So what we have here is the presentation of the yearly production of some principal crops of the USA for 1911, spread across Manhattan with a wide-data butter knife. Nestled between the two ears of corn is the tallest building in NYC (and the world) for 1911, Metropolitan Life, which stood 700′ tall, and reigned for a few skinny years until the Woolworth Building was finished off at 792 feet in 1913. So it looks like the corns were about 2100′ tall with a 600′ diameter at the base. Big. On top of that rests a cigar which is crowned buy a loaf of bread, all of which lords over a sea of hay that covers the rest of the island and almost all of its buildings. For some reason nothing very creative is done with the potatoes, which are just sitting there in a 1000′-tall basket. In the upper left there is a positively enormous pouring of something-or-other of disaster movie proportions. It is slightly disappointing that the maker didn’t figure out how many people it would take to eat all of that stuff in one day. (Throwing caution to the wind mainly because getting to the mostly-useless answer to this is not all that interesting, I will guess that it would require 10x the current global population to eat Manhattan clean in one day.)

    There you have it.   

    The ironic thing here is that this use of corn size really doesn’t tell you very much, except that corn production in the U.S. is (1) a lot and (2) more than bread, which of course you can tell by just looking at the numbers…though that isn’t quite fair as it does give some basic common denominator for measures that are given in pounds, bushels, and bales. The point is that whether the twin corns were 2000′ or 8000′ tall probably didn’t help your understanding of what the numbers meant. But all is fair in war and war, and since this is basically an info-toon, we’ll just enjoy it for what it was, or is.  

    ·Posted by :

    ·in:


  • A Very Large and Very Early X-Ray Photo, February 1896

    JF Ptak Science Books  Quick Post

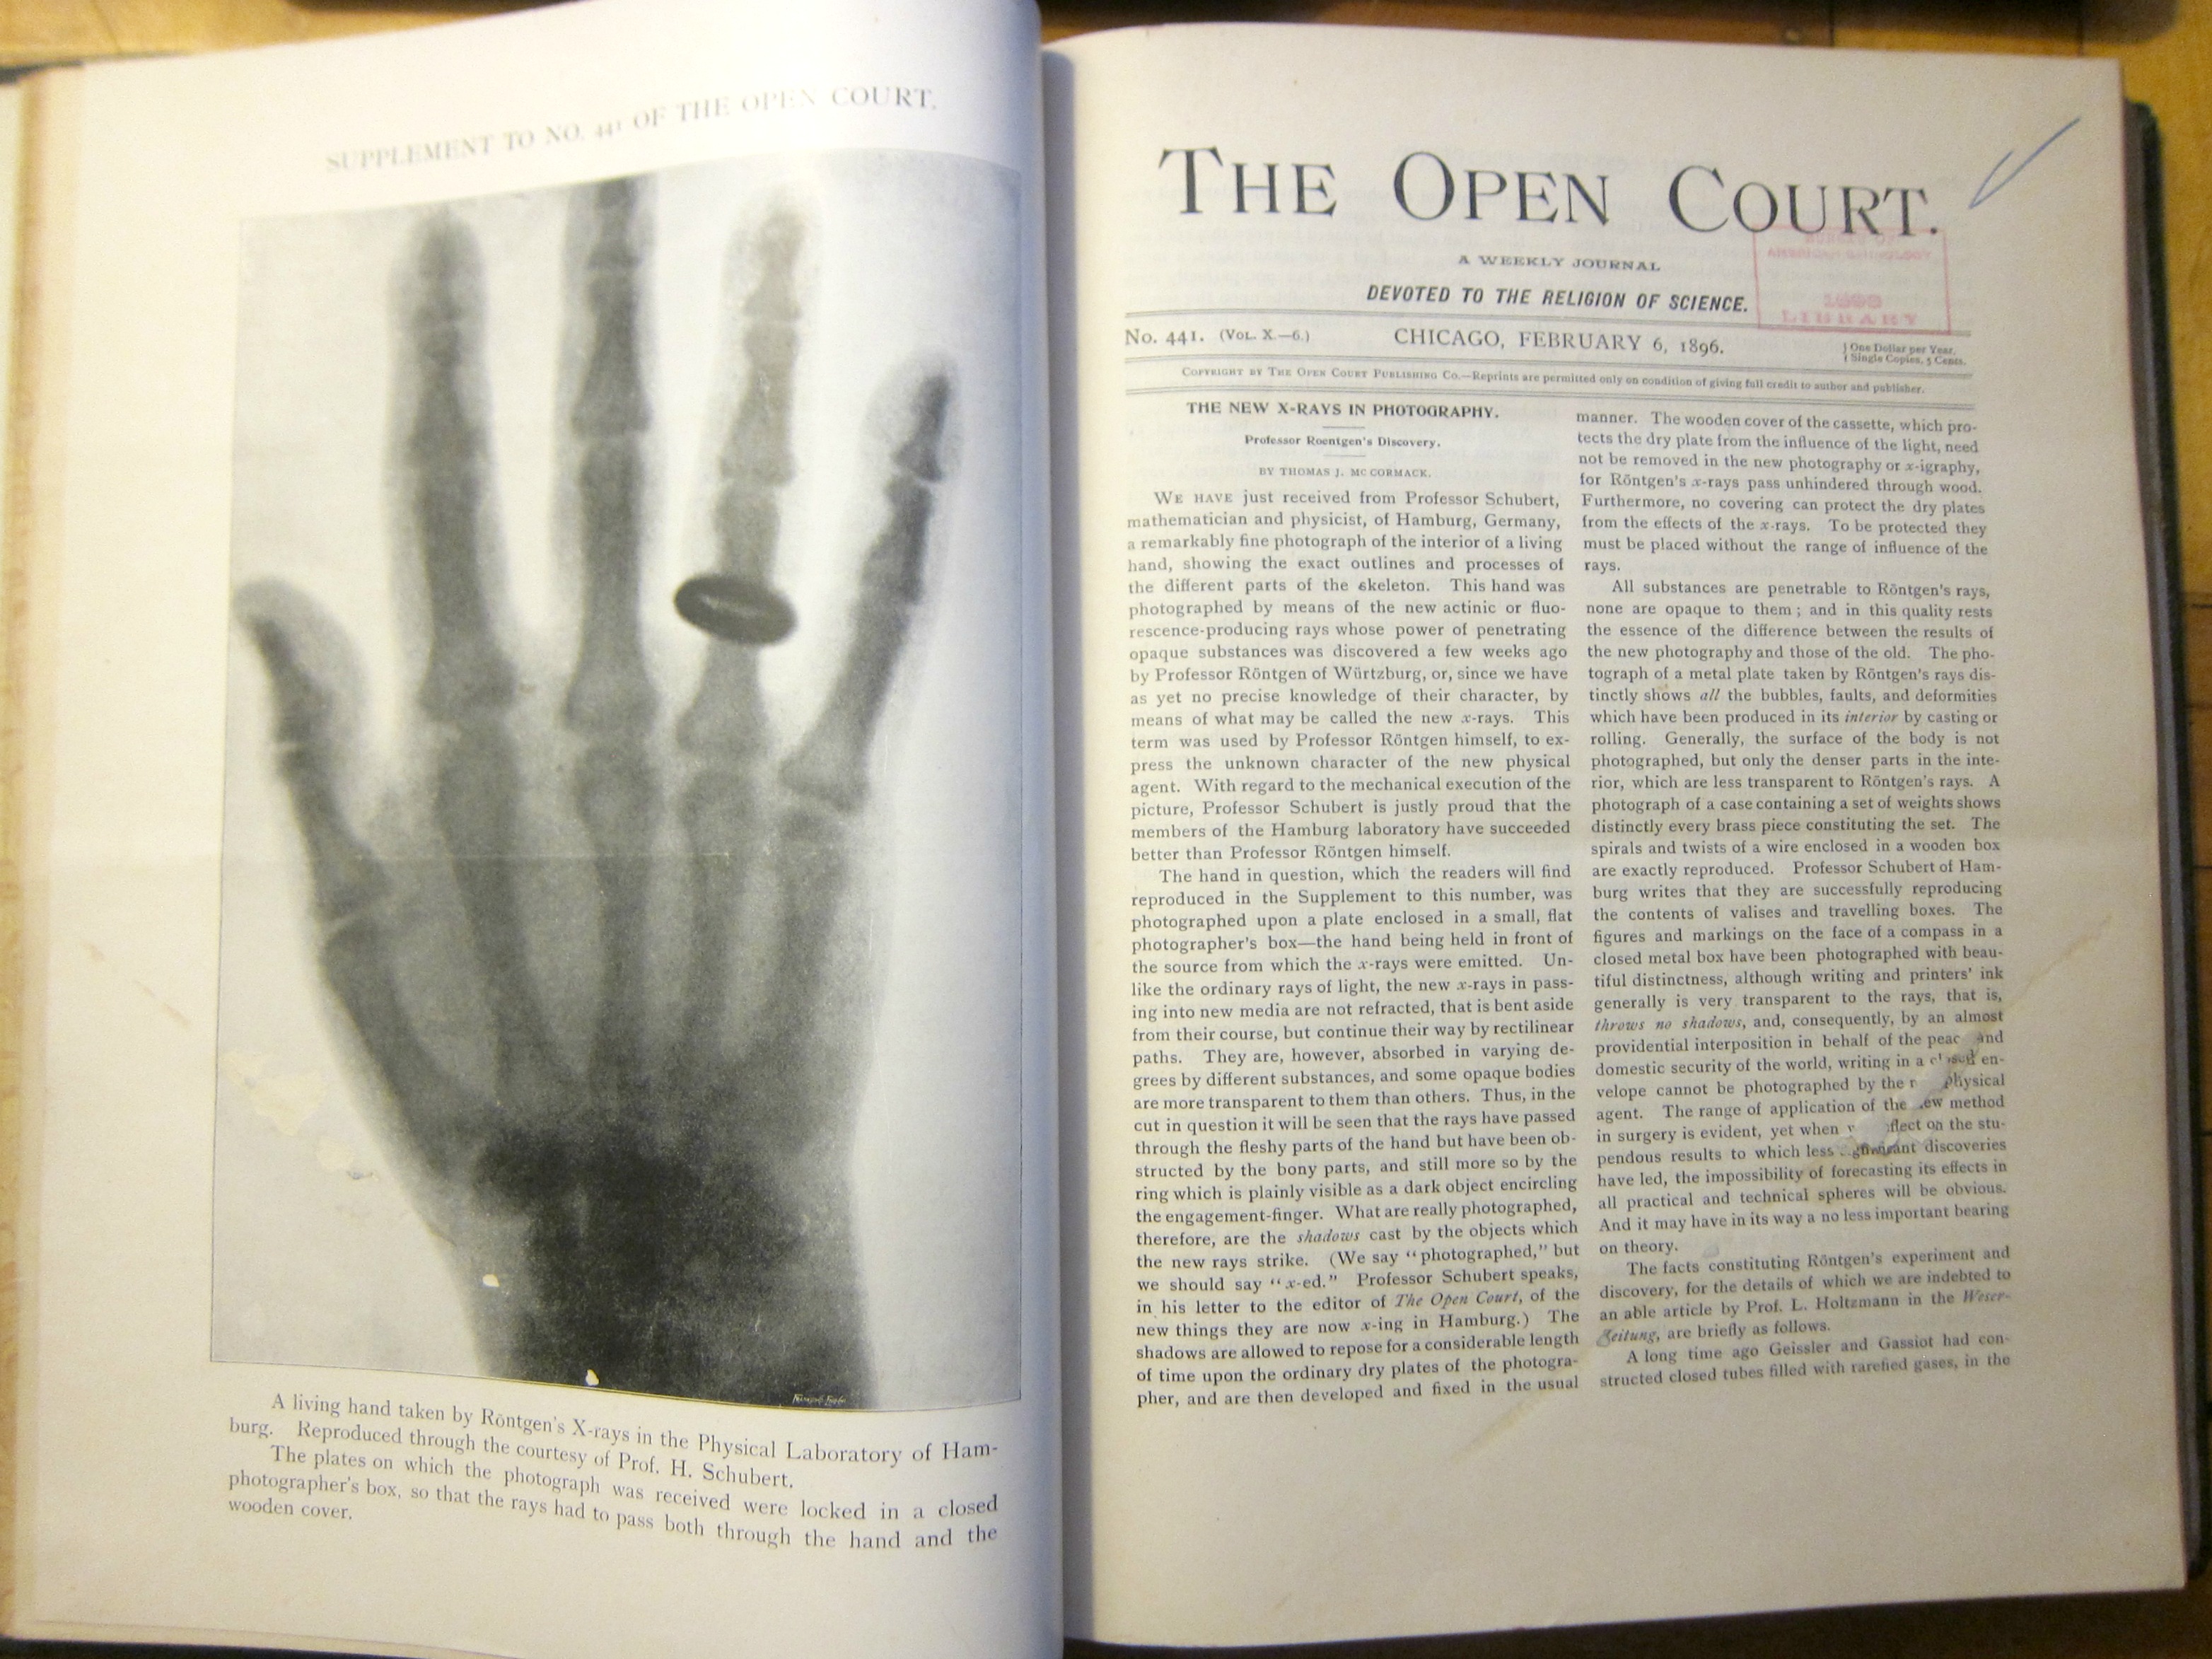
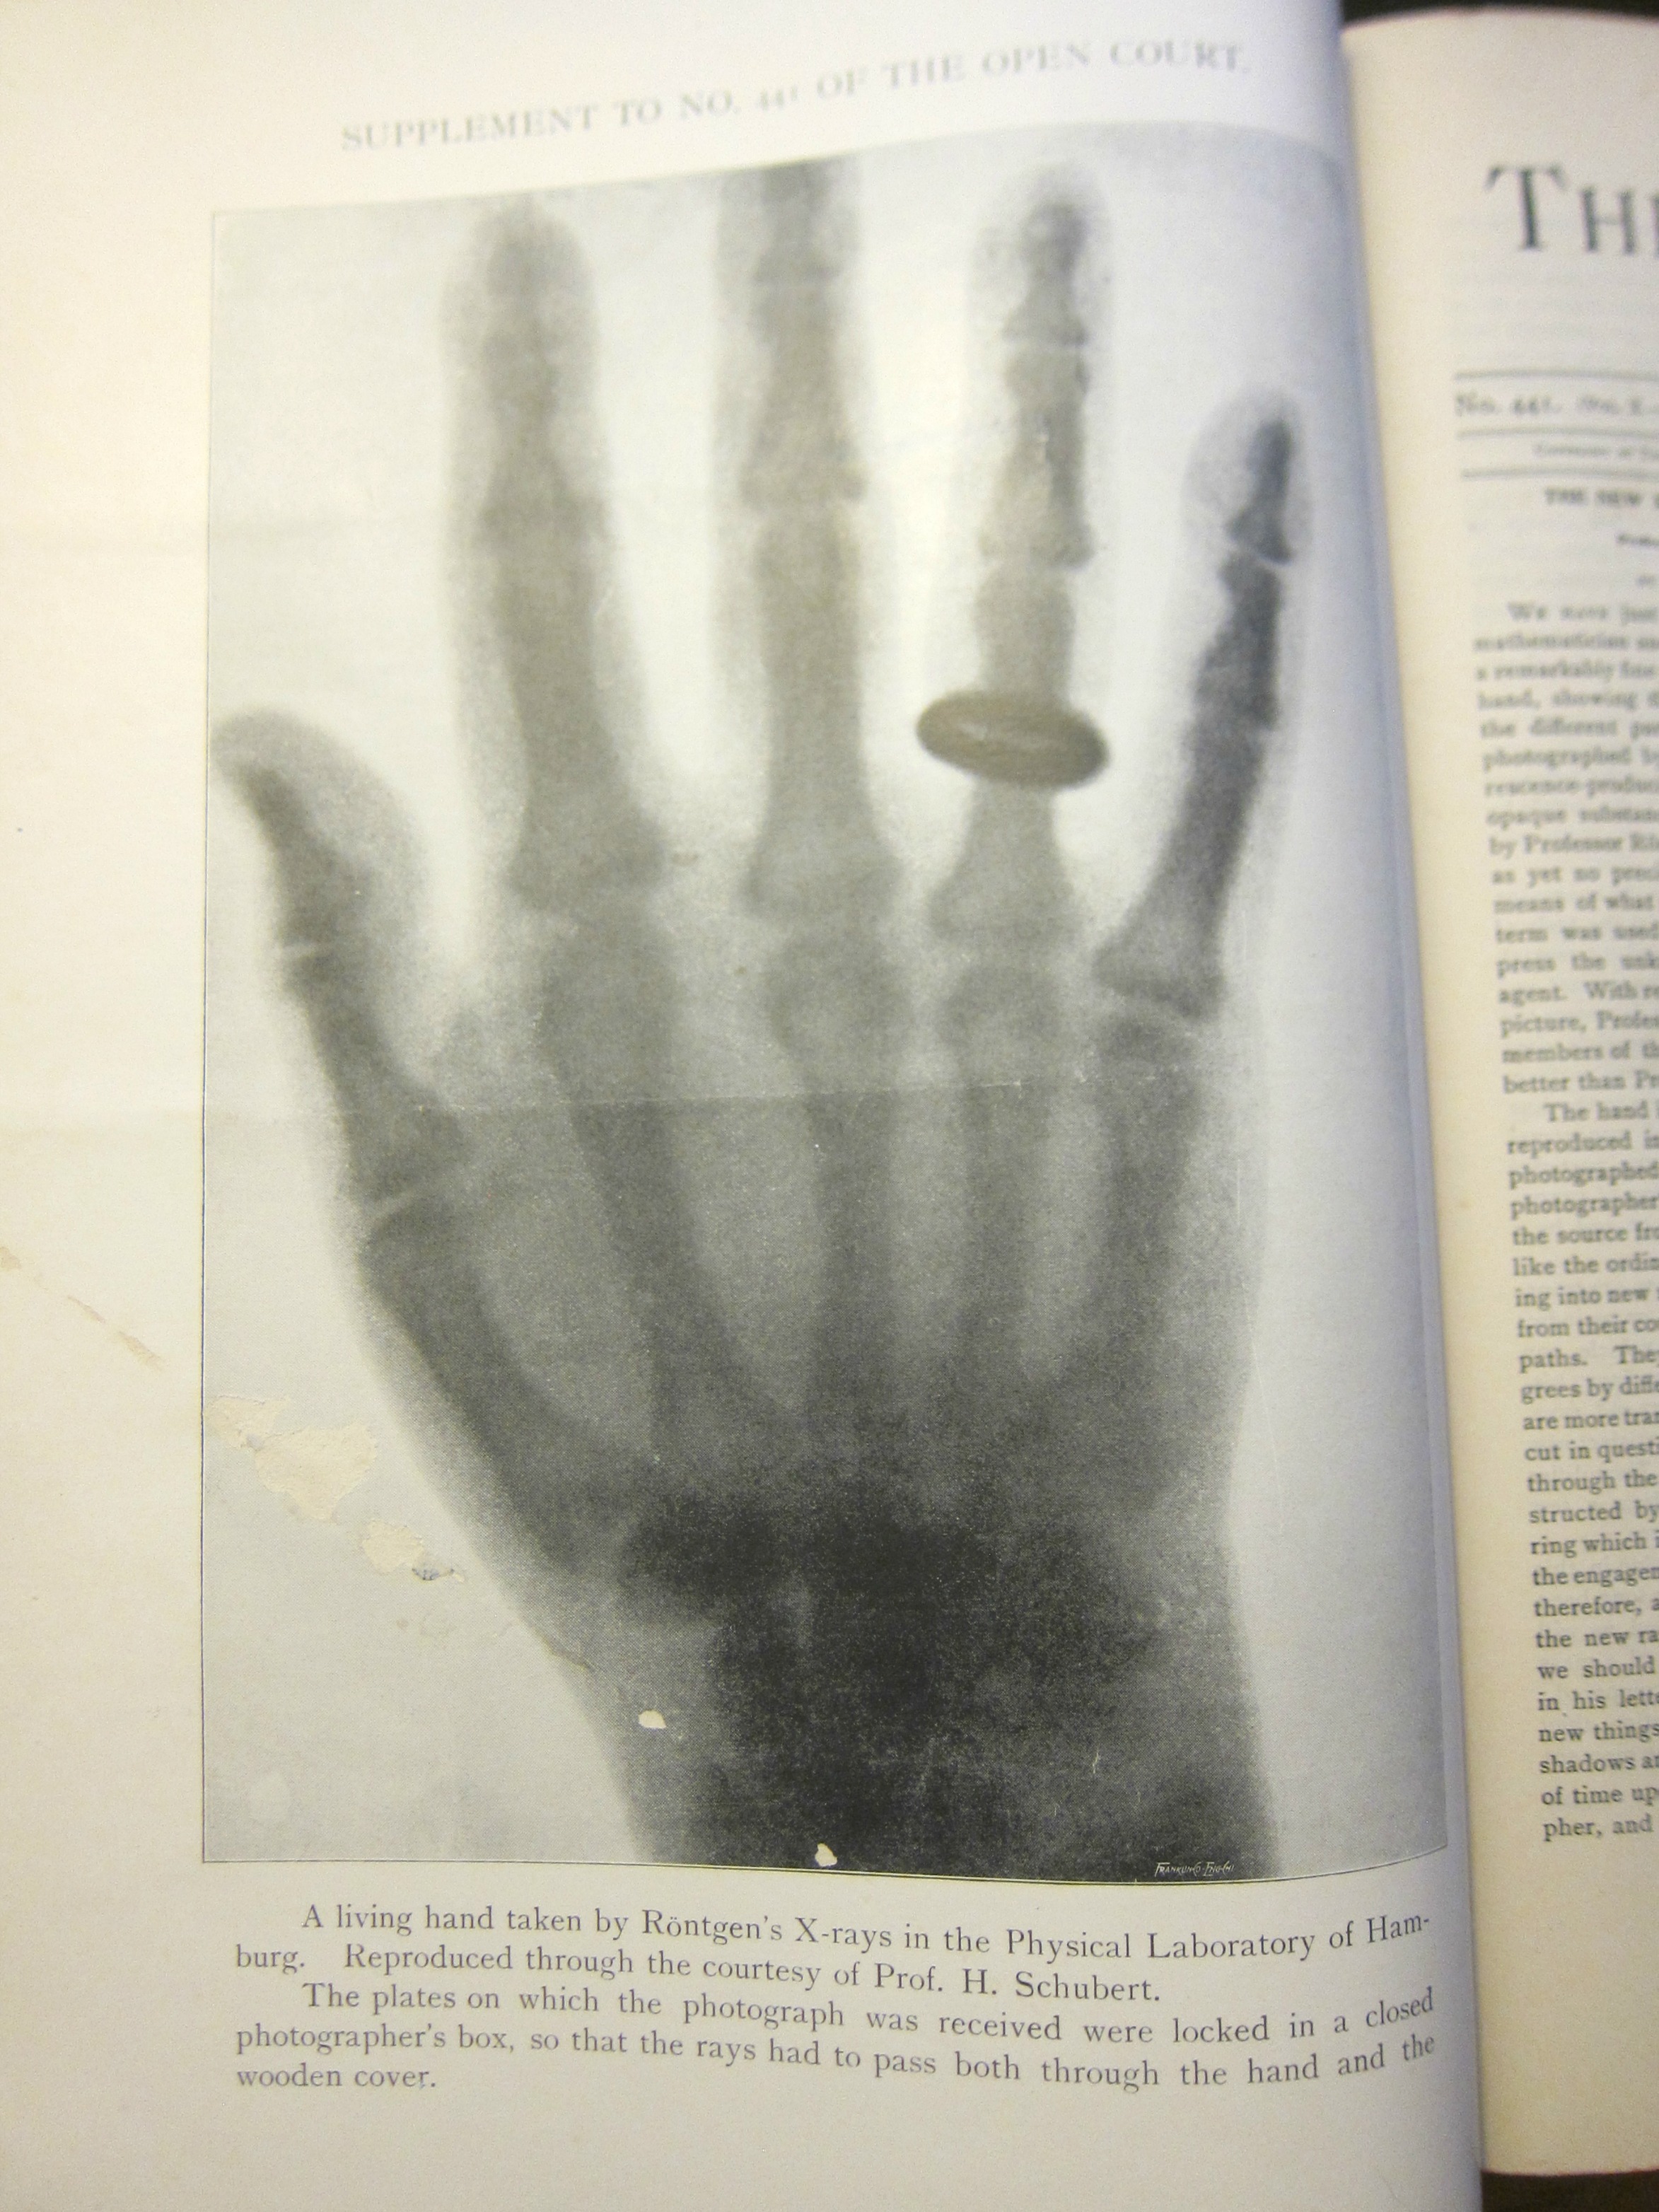
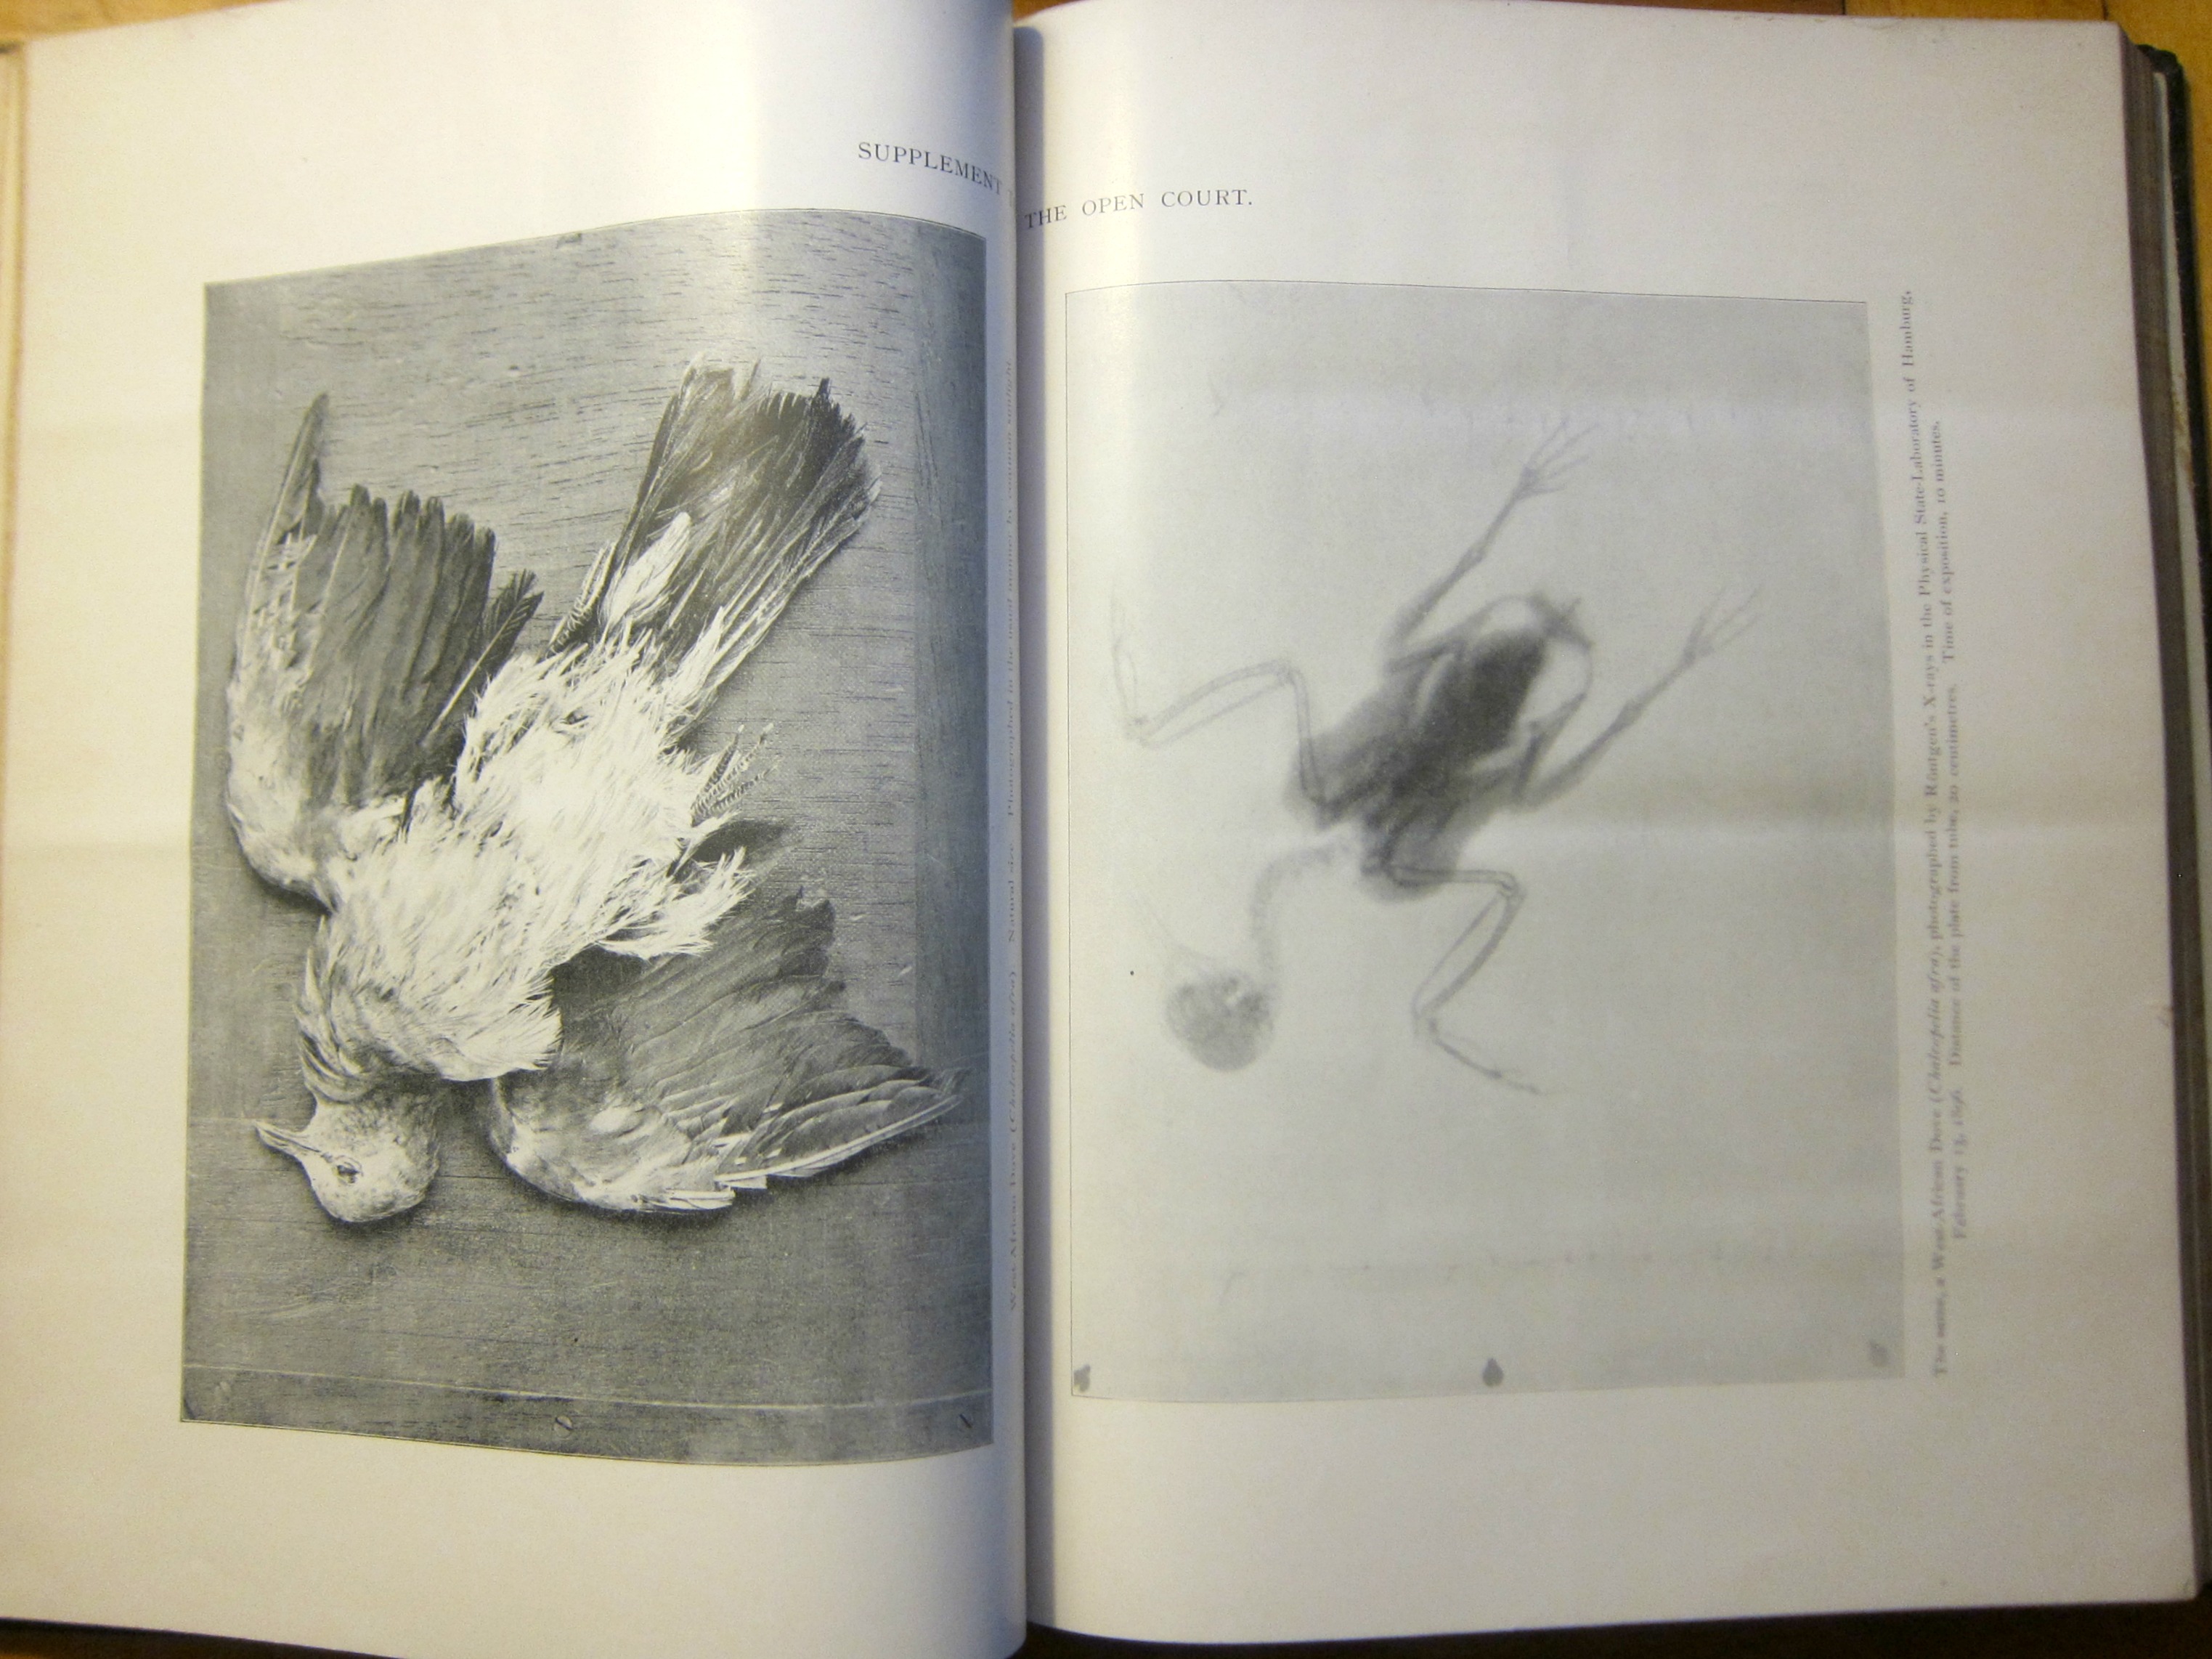
    I made an unexpected find today, poking around in a February 18961 volume of the probing, somewhat classically-radical and Easternist journal, The Open Court, a Weekly Journal Devoted to the Religion of Science.  The photo and article form a very early appearance in the U.S. of the weeks-old Roentgen discovery of the x-ray. The first journal edition in English appears to be 23 January 1896 in Nature (vol 53), and the first in a U.S. journal in Science on 31 January, though that is not illustrated.  (The Science article, written by Hugo Muinsterberg of Harvard, notes that this was a good thing for the reassurance of German stature in physics as they had in the last year lost Kundt, Hertz, and von Helmholtz, and now they had Wilhelm Roentgenfor a new placeholder of living greatness.) 

    X-ray _3_


    X-ray _2_

    A close-up of the 12″ tall image

    The illustrated article by McCormack, in the Taoist-historico-scientific journal Open Court, shares an example of x-ray photography by H(ermann). Schubert (1848-1911, and who would have his paper on the Rontgen rays translated for the Monist in April) ) of the Physical Laboratory in Hamburg which is very large, more than 12″ tall, and by far the largest of these famous photos that I have seen. There is a short discussion on what exactly to call the “photograph”, since it really wasn’t a photo by general standards, and the term “x-ed” is suggested…I’m not sure when the “X-Ray” as a term for the product of being exposed to x-rays and photographic film was, but it wasn’t long after this.)  There is a bit of history of the discovery of the x-ray, and a discussion on the idea of chance and discovery in scientific progress. 

    There would be an enormous wave of publications on the x-ray over the course of the next year–in fact, the Bibliography of X-ray Literature and Research (1896-1897) by Charles Phillips (published in 1906) is 68pp long and finds more than 1500 books and articles published over just two years. Oddly, the Open Court papers are not to be found in the Phillips bibliography, and I’m not sure why.  

    It seems to me that Open Court publishes on the of the first photographs of an x-ray in a U.S. journal. 

    McCormack (1865-1932) had an interesting career, translating Lagrange, Weismann, Mach, as well as the photographer and mathematician  Hermann Schubert’s books on recreational mathematics), and wrote several books in disparate disciplines.  

    X-ray _1_

    Notes:

    1. Thomas J. McCormack, “The New X-Rays in Photography”, in a bound volume of The Open Court, a Weekly Journal Devoted to the Religion of Science, February 6, 1896, no. 441, volume x-6, pp 4799-4801.  With a very large photographic image (12×9.25″ 31x24cm).
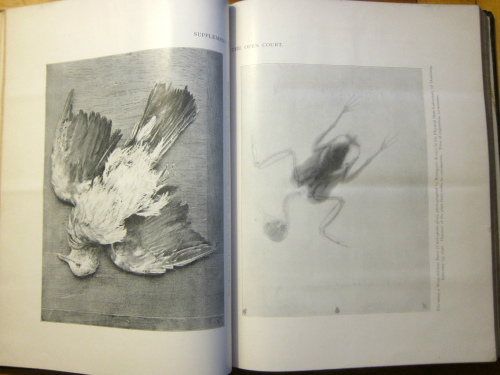
    Also appearing in this volume, again by McCormack,  “Roentgen’s Rays Again”, no. 446 vol X-11, March 12, 1896, pp 4483-4844, illustrated with a double-page photographic image. 

    ·Posted by :

    ·in:

    —

  • 269 Miles of Dead Soldiers

    JF Ptak Science Books  Quick Post


    The Illustrated London News
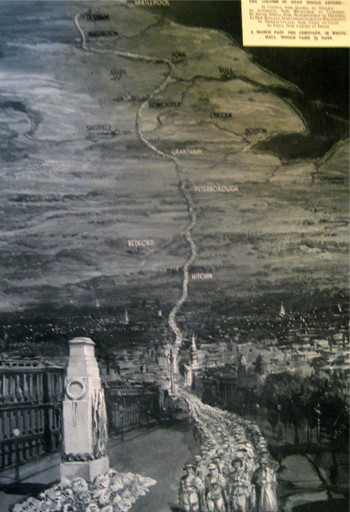
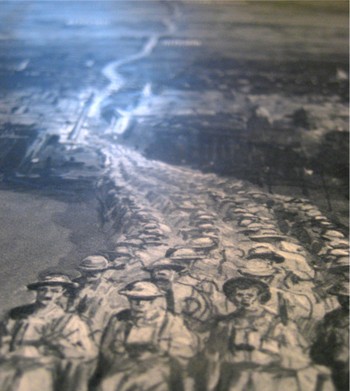
    published this very sobering image showing the general reader in London in 1933 the absolute strength and weight of the dead–and probably in a way that they had never seen before.  The image is entitled “In Memory of the 1,104,890 British Dead of the Great War”, and was drawn by D. Macpherson.  It very graphically represents all of the war dead of the British Empire for the period of the Great War of 1914-1918 (not to be called “WWI” or “The First World War” until after the second week in September, 1939, when there was a new World War from which the older one needed to be distinguished).  Depicted here are the dead as a line of men, four across, extending from London to Durhham.  The column passes from London through Hitchin, through Bedford and Peterborough and Grantham, past Sheffield and Leeds and York, and then on to Durham.  An extraordinary column of the war dead: 900,000 of the dead were not soldiers at the beginning of the war, but they sure died that way, and this map shows them all in a line, marching from  a point 269 miles distant.

    This line of dead soldiers would be 2,690 miles long including all military deaths for the war; 5,380 miles for all deaths overall. 


    Blogmarch

    Blogmarching_2