A Daily History of Holes, Dots, Lines, Science, History, Math, Physics, Art, the Unintentional Absurd, Architecture, Maps, Data Visualization, Blank and Missing Things, and so on. |1.6 million words, 7500 images, 4.9 million hits| Press & appearances in The Times, Le Figaro, Mensa, The Economist, The Guardian, Discovery News, Slate, Le Monde, Sci American Blogs, Le Pont, and many other places… 5000+ total posts since 2008.

Author: JF Ptak

  • Five Big Lines: Representing the BigLittle World in Feynman Diagrams

    JF Ptak Science Books LLC  Post #123

    Perhaps the only bigger five put-together lines than Feynman
    diagrams may be home plate; otherwise I’m hard pressed to come up with a better
    thing that can be drawn in this way with this many lines.

    Dsc00014 The impossibly bright Richard Feynman (1918-1988, Nobel in
    1955 for the development of quantum electrodynamics; physics of superfluidity;
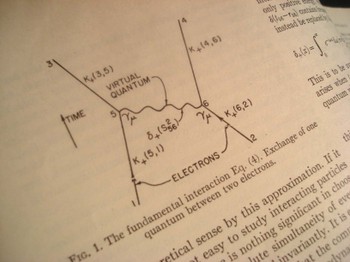
    path integral formulation of QM, etc.) worked on a schematic that would  visualize—indeed, stand for–quantum
    electrodynamical interactions, the scattering calculations in QFT. The result is known by nearly everyone on
    earth as Feynman diagrams. (Murray
    Gell-Mann, another Nobelist and ueber diligent partner and competitor of
    Feynman’s, and perhaps as influential a physicist (with the Eightfold Way and
    etc.), refers to the diagrams as Stuckelberg diagrams, named for a pretty
    obscure physicist who, among others, came up with an early schemata closely
    resembling Feynman diagrams. His refusal
    smacks more than a little of retribution and competitive jealousy even 20 years
    after Feynman’s death.)

    Dsc00016

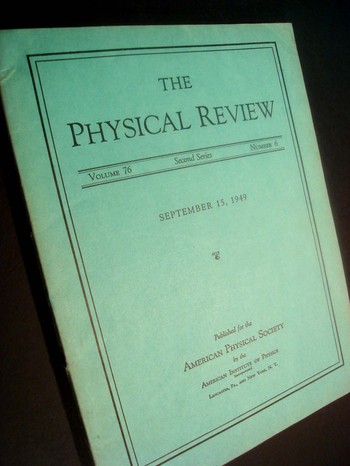
    The images here are the first time the diagrams were
    published in the 15 September 1949 issue of The Physical Review and are among
    the top-20 prettiest pictures in physics of the 20th century.

    Dsc00015
    Their descriptive power is matched only by their crystalline
    simplicity—few diagrams have ever been constructed with a greater claim.

    ·Posted by :

    ·in:


  • Bombing Manhattan, 1943: the Nazi “Amerika Bomber” by Eugen Sanger

    JF Ptak Science Books    Post #124 (with additions 25 October 2011)
    Manhattan_bombed_4
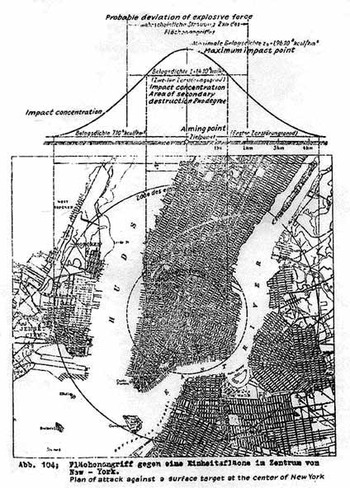
    That devlish working-for-the-Nazis scamp Eugen Sanger (dead before he was fifty, 1905-1964), a rocket designer and engineer (and developer of ramjet tech)  for the NSDAP, went to work for the French Air Ministry following the end of World War Two after doing his all and thankfully falling short for  the Reichsluftfahrtministerium (RLM, or “Reich Aviation Ministry”).  He worked without rancor there until he was nearly kidnapped1 by Joe Stalin—for the purpose I suppose of continuing work on what may have been his greatest effort, unfulfilled during the war years—the Amerika Bomber.  The Soviets evidently thought that this might come in handy in the late 1940’s.

    The Sänger Amerika Bomber (or Orbital Bomber, Antipodal Bomber or Atmosphere Skipper, and also known as the Silbervogel) was designed for supersonic, stratospheric flight, and had much more bang for the buck than the V2 (10,000 feet/second exhaust velocity, as compared to the later V-2 rocket’s 2000 meters/second, 6560 feet/second) and since it was stratospheric had a far greater range, coming in at better than 14,000 miles.  The 22,000-pound weapon carried one large 8000-pound free-falling bomb.

    Sanger’s idea in the early 1940’s was to get this bomb to around Times Square. And since the Amerika Bomber was a relatively inexpensive weapon compared to the damage it could cause, there was room for producing a lot of them.

    Seeing Manhattan in the cross hairs like this is quite sobering, and it is an image that is rarely made.

    Manhattan_bombed_bomber    


    Notes:

    1.  Maybe, maybe not.  Stalin did at least send his representatives–including his own son–to tr and convince Sanger to work for the USSR. THis attempt failed. It has been said that the NKVD was sent to kidnap him, and failed.


  • Bizarre Thinking and a Towering Classic of Lost Logic: the Japanese War Lords and Kaiser Wilhelm, the “True Kidnappers” of the Lindbergh Baby and the Beginning of World War Two

    JF Ptak Science Books LLC Post #122
    Lindberh_japanese168

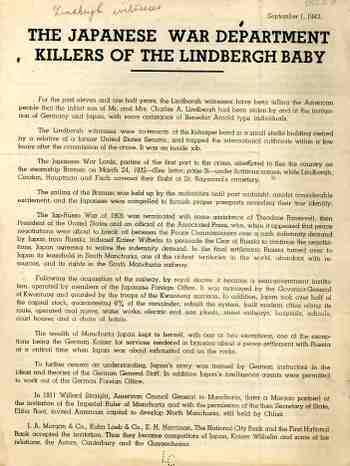
    This four page pamphlet, received by the Library of Congress (and probably nobody else) on 1 October 1943, divines the origins of World War Two and the kidnapping of the Charles Lindbergh baby to a complex and impossible cabal of Japanese “War Lords”, Kaiser Wilhelm of Germany, the assassination of Leon Trotsky, the League of Nations, Elihu Root,  “3 cent gallon kerosene”, the South Manchurian Railway, and some sort of “historical documents of posterity countersigned by Tokyo and Berlin” in the possession of Mrs. Renee Valentine (“Secretary”) of Staten Island, New York. 

    The entire affair began with “co-tenants of the kidnappers band in small studio building owned by a relative of a former U.S. Senator” under the instigation of “Germany, Japan and certain Arnold Benedicts types” brought about by the end of the “Jap-Russo” War of 1905.

    We are told it was an “inside job”.

    Somehow Teddy Roosevelt gets involved with Kaiser Wilhelm in arranging for the Russians to pay indemnity to the Japanese in terms of a land agreement of Southern Manchuria, opening the way to exploitation of China by the Japanese.  Something else happens, the South Manchuria Railroad gets thrown in as well as four competing U.S. banks and Elihu Root and a failed League of Nations agreement which upsets a balance of power and brings “the Astors, Canterbury and the Guggenheims” into competition with the Japanese and Kaiser Wilhelm, doing something to the Treaty of Washington.

    After this incredible and unconnected and partially non-existent series of events is both untangled and entangled before our eyes, the writer reaches the lonely and very solitary conclusion that “the necessary documents to prove these charges (??) could be secured through the kidnapping of the Lindbergh baby”.  I was waiting for the  author to make a case for Lindbergh’s real-life (and long held) Nazi sympathies, but that just didn’t happen. 

    I really have no idea of what the writer is talking about, but the failure of making any connection whatsoever with any of the “facts and circumstances” is magnificently appalling, and has moved itself from the realm of being so bad that it isn’t even “bad” anymore.  It is that singular sort of “badness” that makes the printed words seep into the paper and disappear before your very eyes, and the only thing that you can say is “wow”. 

    ·Posted by :

    ·in:

    — —

  • Statistical Fossils 2: Found Stats On International Mail Delivery Times, 1900.

    JF Ptak Science Books LLC  Post #121

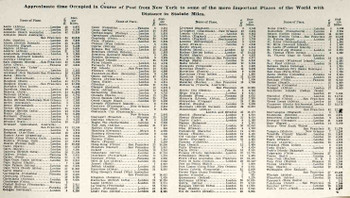
    Continuing to leaf through the George Cram Family Atlas of 1903 I came across another small fossilized statistical nugget that I know would be of value to some poor person out there:  this one is  a half-page of mail delivery times to about 200 places world-wide.  (I know that this would be helpful to some historian, as I just went through a similar process for some data that I actually needed,  finding a series of representational maps showing the frontiers of travel time for different modes of transport over different periods of time leaving from New York, and representing several decades’ differences—these were an enormous help to me, and I was unaware that such data had been compressed so elegantly; trying to piece this information together piecemeal would have been a very time consuming effort.) (This image is clickable for a magnified view.)
    Statistics_found_mail_times166_2

    So in keeping with some of the other data-posting tactics of this site (for example the atomic bomb chronology and the bibliographies of various scientists as found in these pages) as well as on my business site  I‘ll continue to make posts for some of the particularly scrumptious bits that I find during the day.

    And just for the record, the longest in-transit period for mail that I have seen thus far in this table is for New York to “Gabun” (Gabon), Africa, coming in at 47 days; Saigon came in a close second with 44 days, and Hong Kong, 43.  It still took 8 days to get a letter from NYC to London in 1899.  The record for an east bound crossing of the Atlantic in 1958 was still three days, twenty hours, set by the Queen Mary in 1938, so getting a letter delivered in London after only nine days (including the passage plus processing and foot delivery) was pretty fast there at the turn of the century.  Speed is a simple matter of relativity and perspective–and starting with a given known. 


  • Statistical Fossils 1: Found Stats Concerning the Rifles of the World, 1899

    JF Ptak Science Books LLC Post  Post #120

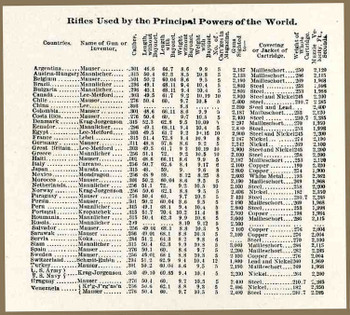
    Leafing through back-page minutiae of the George Cram Family Atlas of 1903 (a modest but full work on the level of something like the World Book Encyclopedia of the 1970’s) I stumbled upon a wonderful table entitled “Rifles Used by the Principal Powers of the World” (and by “world” it meant 43 countries). (You can CLICK on the image below for a more readable, magnified version.)   
    Statistics_found_rifles165

    The 3×4-inch table was packed with some unusual data, and even though I just jested with its 47-country “world” that is actually a fair representation of the gun-consuming nations of the time.  The table lists the name of the gun or inventor, followed by its calibre, length (with and without bayonet), weight (with and without the bayonet), number of cartridges in magazine,, the distance at which the gun is sighted, the “conveyor or jacket of cartridges”, and the muzzle velocity (in feet per seconds).  That’s really quite a lot of obscure data packed into such a small part of page 321 in this book. 


  • Visionary Architecture and a Falling Man Prank–E. Hebrard’s Tower of Progress, 1913.

    JF Ptak Science Books   Post 118 (expanded)
    Dsc00013

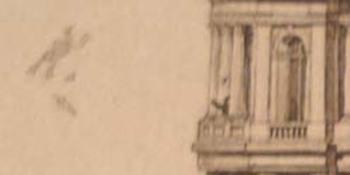
    This image has two things going for it, one obvious, the other not (and just about hidden, until you see it, then you can’t help not seeing it all of the time).  It comes from an unusual, somewhat pretty/bizarre visionary work privately printed in Paris in 1913.  The lead author, Hendrik Christian Andersen, along with Ernest M. Hebrard (and his brother, Jean Hebrard, who we saw in an earlier post), collaborated on a project (ungainly) called Creation of a World Centre of Communication1, a deeply complex, very detailed, and just plain weird offering for building a sprawling extraterritorial city dedicated to “oneness”.  The drawings and plans were lush and lovely, with a lot of thought in their execution but actually very little into how everything might actually be pulled together into some sort of working whole. 
    Dsc00012

    And so it goes.  I imagine that if the beautiful Etienne Boullee thought in terms of cities rather than in single structures, he might’ve produced just the same sort of gorgeous, unconnected thing.  After all, just because you draw a plan with a lot of buildings almost touching each other doesn’t necessarily mean you’ve drawn a visionary city. 

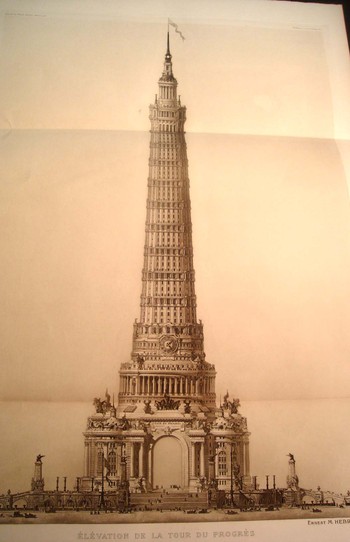
    This is one of 22 large images (in real life this print, a heliogravure, measures about 28 inches tall) showing different structures from an art center to a fountain of life.  This is the “Tower of Progress”—I don’t know what sort of progress as there’s really nothing to go by, except for the big 100’-tall clock, so at the very least it is a celebration of the progression of time, which needs no monument outside of the trillions and trillions of trillions (or centillions, or 10303?) of bones it has distributed around the planet over the millennia. But for Hebrard it formed the locus of the  “a fountain of overflowing knowledge to be fed by the whole world of human endeavour in art, science, religion, commerce, industry, and law; and in turn to diffuse throughout the whole of humanity as though it were one grand, divine body conceived by God, the vital requirements which would renew its strength, protect its rights, and enable it to attain greater heights through a concentration of world effort.” Whew.

    I figure that the tower was to be about 1,500 feet tall (scaling it by the 2mm tall figures scampering around in the image)—a giant tower perched on top of a rotunda placed on top of a table-like something, looking terrifically fake, but lustrous.

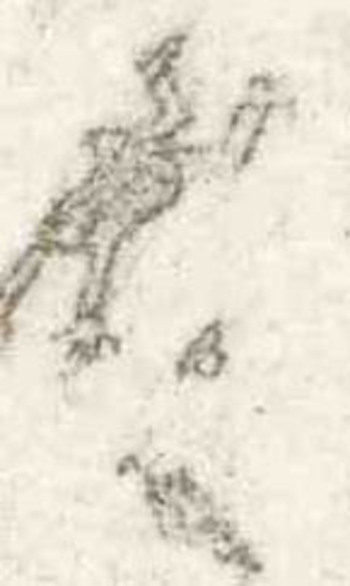
    The prize though in this portrayal of the “Tower of Progress” is a little smudge-like thing to the middle-left of the tower.  Under magnification, we see that it is a man, with a bowler and an umbrella, hurtling down, falling from somewhere way on high in the tower.  It is of course a very unexpected feature of this visionary architectural rendering, a hidden joke (perhaps?).  These sorts of additions—the work of a disgruntled/drunk/humorous engraver—pop up from time to time in the history of printing.  Perhaps the most famous intentional example of this graffiti is found in the earliest copies of the first edition of Twain’s Adventures of Tom Sawyer, where a male character is featured with

    a very large, very lumpy, very noticeable, erection; a proof reader spotted the embarrassment, and the plate was reworked to rid the character of the Natural Function.  I’d guess offhand that this was the case with the Hebrard heliogravure, even though there is a second figure in the tower pointing at the figure hurtling past, implying a little more thought in making this a more cohesive joke.   

    Notes:  An interesting review of this work appeared in Town Planning Review for 1914, here. 
    Falling_man_super_detail


  • Atomic Weapons, Eniwetok Atoll, and the Most Obscure Reference to America’s Entrance into Vietnam

    JF Ptak Science Books Post #117

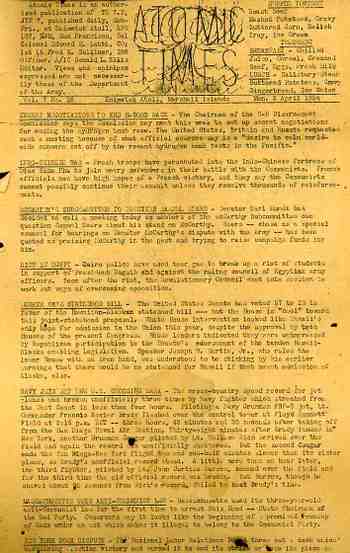
    Atomic_times_detail_masthead159

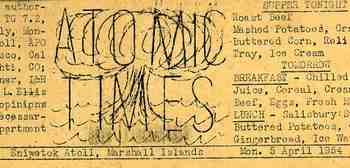
    This issue of the Atomic Times was issued Monday through Friday by the U.S. Army on a mimeographed, single-sheet page, and published at the tip, or bottom, of a very skinny piece of nearly-circular land far out in the Pacific Ocean at Einwetok Atoll, 5 April 1954.  The Marines fought a battle and beat the Japanese Army for possession of the atoll in 1944, and the U.S. government stayed. In 1954 most of it was controlled by the U.S. Army, and the place was being used as a nuclear bomb testing zone for a decade, experiencing 43 tests from 1948 to 1958. The most famous of these test shots was “Mike”, part of Operation Ivy, which was the first detonation of a hydrogen bomb, in 1952. There would be subsequent tests there that, by themselves, represented in a single instance all of the chemical fury unleashed in all Allied bombing in Europe for the entire course of World War Two.

    Atomic_times157

    “The Atomic Times” was a sheet of the daily grind at this remote, if not bustling, outpost of nuclear prolificacy. “Supper Tonight” was announced in the upper right corner (roast beef, mashed potatoes, gravy, buttered corn, relish tray, ice cream”), plus “tomorrow’s breakfast and lunch”; there was a fair amount of reporting on local softball, boxing, swimming and basketball, pus some major league baseball scores. On the front side was the news, with what may well be the loneliest announcement of the coming of America’s involvement in Vietnam. This was the second entry in the news, “Indo-Chinese War”: “French troops have been parachuted into the Indo-Chinese fortress of Dien Bien Phu to join weary defenders in their battle with the Communists. French officials now have a high hope pf a French victory, and they say the Communists cannot possibly continue their assault unless they receive thousands of reinforcements”

    And so it ended, and so it began.

    The siege of   Dien Bien Phu started just a week later or so, on the 13th of March, and lasted 57 days, ‘till May 7th, 1954. The commanding general of the Viet Minh forces, Vo Nguy Giap, achieved an enormous victory over the French—the first time a guerrilla force readjusted itself into a conventional force to defeat a Western army. It was the end of the line for the French, and it just so happened to be the beginning of American involvement

    Dien bien phu

    Just a week after this notice appeared, Dwight Eisenhower made his domino speech:

    “Finally, you have broader considerations that might follow what you would call the “falling domino” principle. You have a row of dominoes set up, you knock over the first one, and what will happen to the last one is the certainty that it will go over very quickly. So you could have a beginning of a disintegration that would have the most profound influences.conference…”


  • Gigantic and Unbuildable Architecture: Philip Johnson and the Walled “Third City”

    JF Ptak Science Books LLC   Post #116
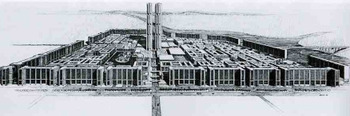
    Big_arch_city_johnson137

    Philip Johnson, the enormously influential, selfish and neo-fascist architect once remarked of his profession that “architecture was too important to be left to the architects”, and I agree, especially if it was Johnson who was signing off as architect.  Johnson was more interested In building great rooms; some people see Johnson’s greatest room as the Crystal Cathedral that he designed for the television minister Robert Shuller (Garden Grove, California), a very shiny one-acre metal/mirror tent-like structure that from the inside looks like, well, a tent; from the outside it looks pointy and block-like.  (I’ve never understood the fascination with the work of Johnson.)
    Johnasonkowloon_ii

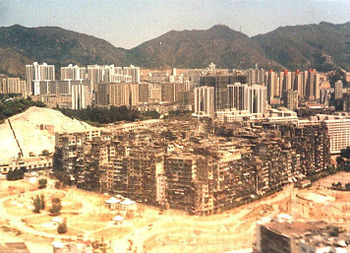
    But some of the ideas of Johnson’s that I’ve least understood are his big ones—city design and planning, the oddest of which (pictured here) is the design for Third City (1966).  This essentially was a city re-design, constructing something else over/within the existing street grid and transportation systems, and adding a surrounding layer of “low” and middle-income housing, and which included at its nexus a giant skyscraper.  Aside from a decidedly cellular appearance, this work by Johnson also reminds me of classic medieval walled  cities, though not those with crenulated fortifications, like Basel, but rather more like the truly ancient cities like the Sumer Uruk, or Lahore, or Starard Szczecinski.   In Johnson’s design the defensive perimeter is a chain-like linkage of apartment blocks filled with families of modest means, and the thing really most reminds me of the infamously spectacular walled city of Kowloon (Hong Kong), a high-rise slum that was formed of concentric blocks of itself.

    Johnson’s stylistic references have almost always felt “mean”, to me, and Third City is no exception.


  • Gigantic and Unbuildable Architecture: Bucky Fuller’s Midtown Manhattan Dome, 1968

    JF Ptak Science Books LLC  Post #115
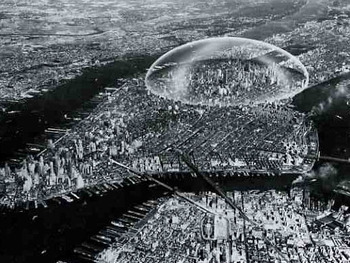
    Big_arch_city_fuller139

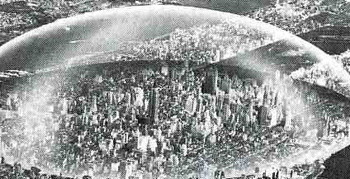
    Buckminster Fuller had a lot of good ideas but I’m not so sure that this is one of them.  I don’t have much doubt that versions of domed cities will exist in the not-dim future, though I do have doubts that they would be constructed to preserve the bones of antiquated ideas.  It seems logical to me that the retrofit of untold millions of cubic feet of city life just couldn’t make sense, even if the square footage was in Manhattan.

    Fuller’s idea is multiple orders of magnitude removed from the original idea of the arcade, constructing a dome to encapsulate NYC from the East River to the Hudson along 42nd St, and from 64th to 22nd St:  that’s two miles in diameter and, plus a mile high (or about five Empire State Buildings pile one on top of the other).  I’m not so sure how this would be built, or how things would be heated or cooled, or what the construction material was for the skin of the dome, or how people get in and out, or how you deal with heating and cooling, or how any noxious chemicals are expelled—but Mr. Fuller thought that the savings alone from snow removal from NYC streets would pay for the dome in ten years. 
    Big_archfuller_detail141

    Mr. Fuller also thought that the dome would protect the city (or this part f the city) from radiation fallout.  That could be true, assuming that of all the hundreds of nuclear warheads that the Soviets would’ve launched against NYC alone none of them would’ve found their target, except perhaps for the Ridgways or Staten Island, where the shock wave or winds produced by ensuing firestorms would not have disturbed the dome.  Of course if a warhead actually came close—or actually hit—the dome, the protection from radiation would be moot. 

    Source:  Buckminster Fuller in Think magazine, vol 34, Jan/Feb 1968.  AND of course the lovely work by Alison and Sky Michele Stone, Unbuilt America, McGraw Hill, 1976, pg. 99.


  • Measuring and Comparing: Feeding the London Zoo in Terms of 1944 Telephone Operators

    JF Ptak Science Books LLC   Post #113

    Zoo_story149_2
    I’ve put together a relatively large collection of images from 1850-1940 which are graphic comparisons of data and graphical displays of quantitative information..  In general they display the basic concepts of one idea in terms of something else, or they simply exhibit the idea or concept in cold hard one-to-one images.  The two images below are good interesting, standard representations of these categories.

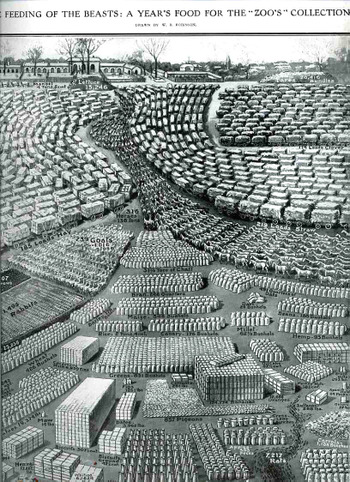
    The first is a very neat and complex display of the food eaten by animals in the London Zoo and was published in the Illustrated London News on May 17, 1913.   The data, found in the report of the Zoological Society of London (for the year 1912) is entitled “The Feeding of the Beasts:  a Year’s Food fore the “Zoo’s” Collection.  The real story though is in the subtitle:  “from shrimps to rats; from onions to oil cakes and mice, the food consumed by the animals at the “zoo” during 1912.    (I’m assuming that the word “zoo” is in quotations as it is a diminutive of “Zoological”, ad was seen as slangish.)  As you can see the language of the undoubtedly stiff report is beautifully brought to life (but not for long) in this work by W.B. Robinson.
    Zoo_story_rats_2
       
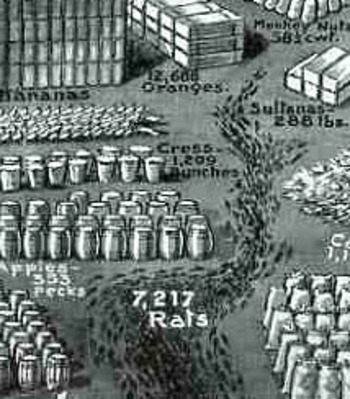
    We see 15,000 pounds of lettuce in a lump and a pile of 4,220 bunches of carrots, along with a serpentine 185 wagons of hay and a snaking 219 wagons of straw; there are giant cubes of biscuits and milk tins, and an even larger cube of 183,000 bananas in boxes; there are orderly armies of goats and rabbits, and a very neat ordering of 19,000 pounds of potatoes in stiff white sacks.  At bottom we see comparatively lonely contingent of 28 ducks (undoubtedly hoping that something else besides what was happening was happening); and of course an antlike column of 7,217 rats. There were also masses of clover, boxes of sparrows, 857 pigeons, 123 pounds of figs, 2 tons of dates, 93 bushels of hemp, 4500 pounds of grapes, 500 pounds of sugar (?), 34,000 eggs, and a slithering line of 25,000 mice.  Most disturbing though is the central figure of a long, quiet column of 318 horses.  I can’t help but feel sorry for them.  It is a remarkable and successful effort to put the data into a form that was somewhat more understandable, if less digestible, and a little more heinous.
    Telephone_ops150

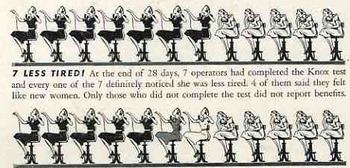
    The second image is a simple but somewhat bizarre rendering, changing counting units of numerals and replacing them with telephone operators—I can honestly say that I haven’t seen this before.  It is quietly bizarre, but still quite effective in making the sales pitch for the noxious element.
    Telephone_ops150_detail