A Daily History of Holes, Dots, Lines, Science, History, Math, Physics, Art, the Unintentional Absurd, Architecture, Maps, Data Visualization, Blank and Missing Things, and so on. |1.6 million words, 7500 images, 4.9 million hits| Press & appearances in The Times, Le Figaro, Mensa, The Economist, The Guardian, Discovery News, Slate, Le Monde, Sci American Blogs, Le Pont, and many other places… 5000+ total posts since 2008.

Author: JF Ptak

  • WWI Parade in a Deep Big Snow

    JF Ptak Science Books      Post 2402

    WWI--great imagessnow parade059

    • The original of this photo is available on the blog’s WWI Photography site; it is also available now as a 13×19 inch reproduction from a 1200 dpi scan.  

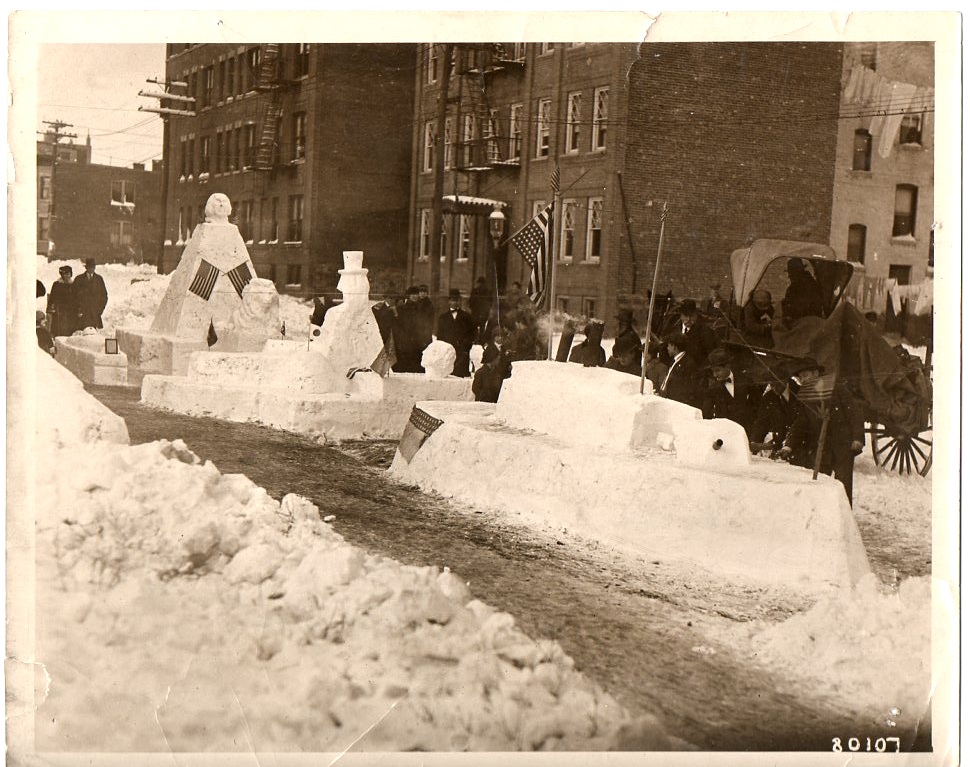
    This news photo service image–stamped “Hearst-Pathe News Agency” on the back–is frm the winter of 1917/1918 and shows a patriotic snow parade somewhere in the United States.  The snow looks prodigious, judging from the piles in the foreground and also the accumulated snow on the windowsills, and I imagine that all of the snow floats were sculpted mainly out of exiting snow in the street.  It is a delightful scene, to me, and hosts a variety of smaller, lovely images in vignette. For example:

    WWI--great imagessnow parade060

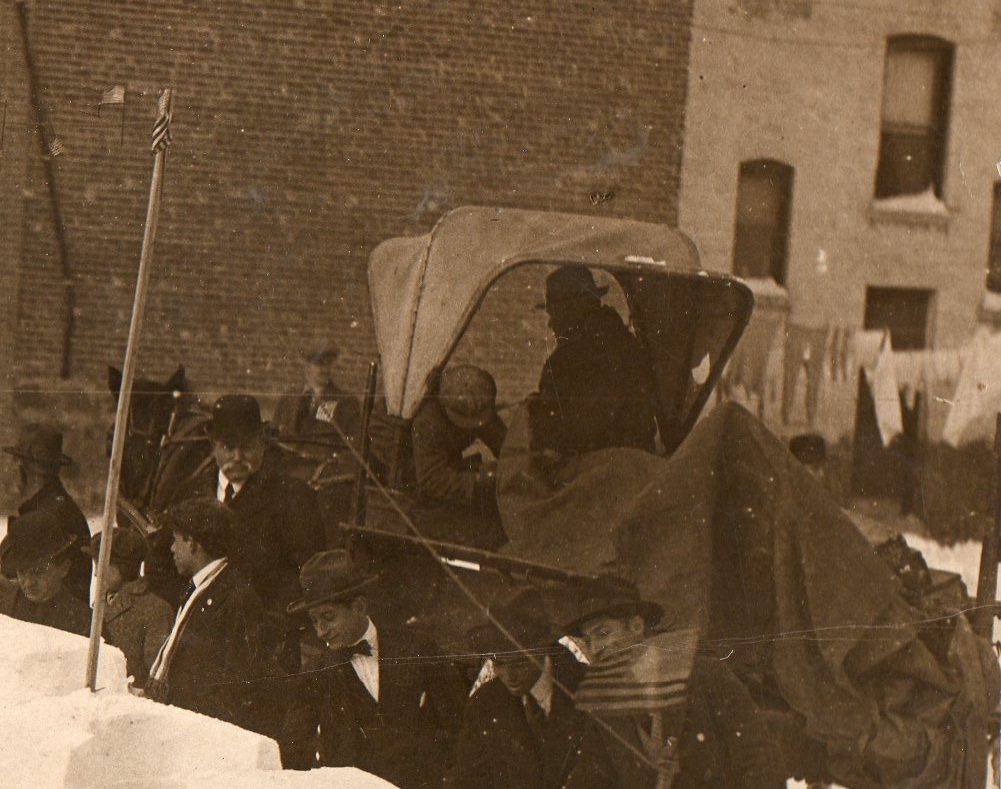
    The man in shadow and sleeping figure (boy) in the buggy complement the white-mustachioed bowler-wearing man to the left; the men looking on in the foreground are interesting, too–plus there’s that laundry in the background.  Given that the laundry is out (and wasn’t just left out during the storm) and that no one seems to be particularly bundled up against cold, I’m going to guess that there was a break in the weather that pushed the temperature higher than normal, with almost everyone taking advantage of the warm snap, as people do everywhere, all the time.  I also like the tiny American flag on the tall pole at left.

    ·Posted by :

    ·in:


  • German Soldier, Worn and Worked, November 18, 1918

    JF Ptak Science Books  Post 2401
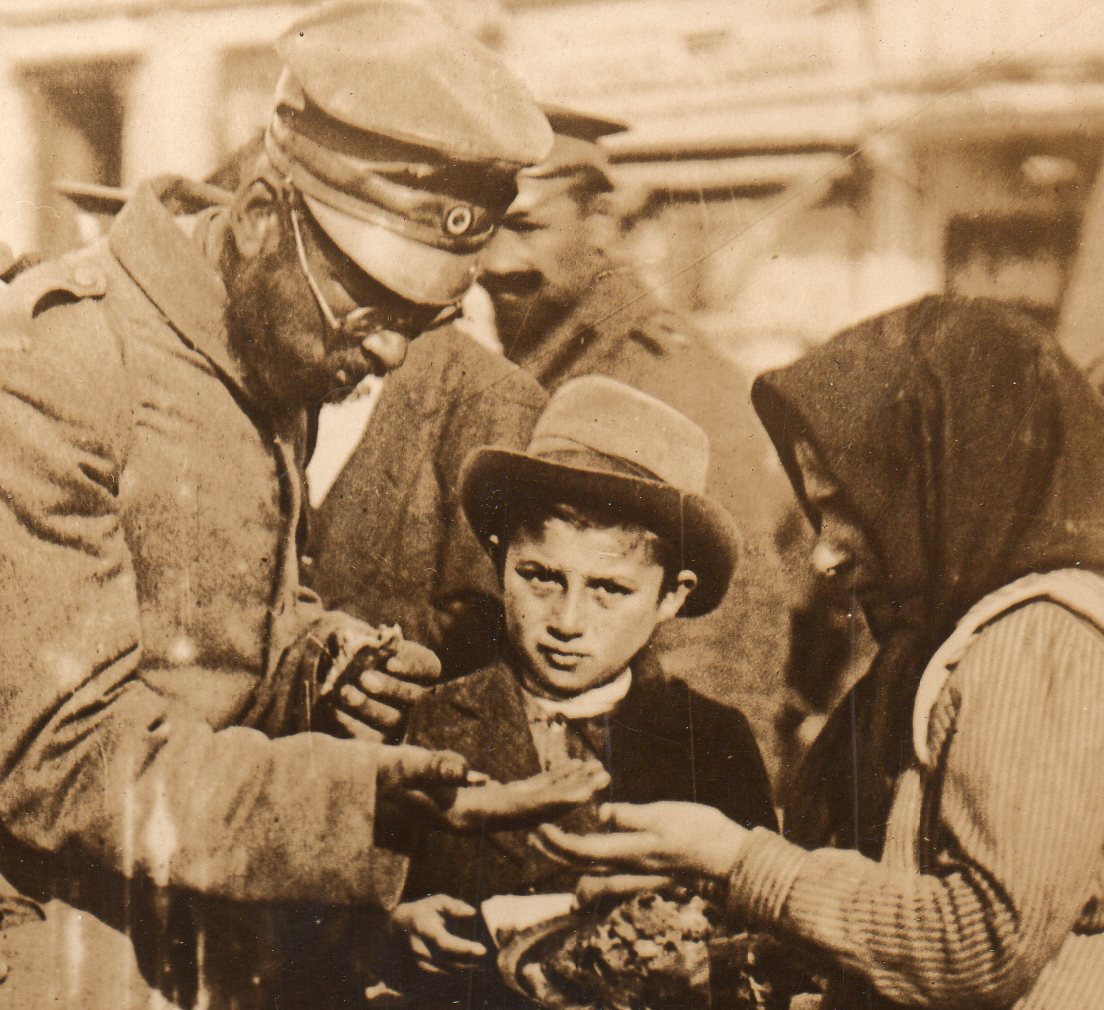
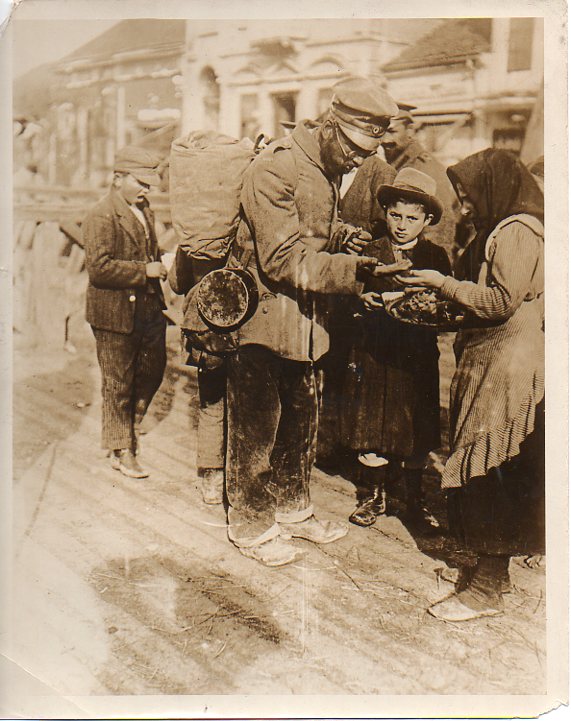
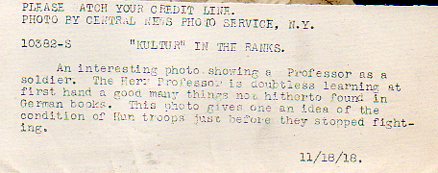
    I’m not sure what this photo depicts specifically but in general it sends an image of exhaustion and wear.  The caption for the image says that it shows “the condition of the Hun troops” and that the subject “Herr Professor” is learning “a good many things not hitheroto found in books”.  Maybe he was a teacher, maybe not.  Machts nichts. His pants looks velour-like and his boots (if that’s what his footware was) look very thin.  He is ragged, his double-fold glasses look like they’re at their limit, his face looks swollen behind his beard, and he just looks “done”, in general. 

    WWI--german--beggar det326
    [Original photograph available for purchase via the blog’s WWI Photography site]

    I’m not sure what he is doing, or where he is.  He may be trying to figure out local currency to purchase whatever it is the vendor-woman has on the tray at her hip–she os holding out her hand, and looking at his.  The soldier definitely has something there, and he looks basically too weary to comprehend it.  the hand language is ambiguous to me.  He may have received something already, some sort of food, and he is staring at it now, thinking perhaps how little of it there was.  He’s eating, and already has taken a bite of whatever bread-like thing is in his left hand.  I’m not sure what attracted the attention  of the boy in the center–perhaps it is simply the camera, and he wanted to be in the shot. 

    WWI--german--beggar325

    There’s a shadow in the foreground-left of what looks like someone making a photograph of teh scene–probably not our photographer, but another, with a brownie or some such smaller camera.

    At the end of years of fighting every general soldier deserves respect and, at least, some free food–I hope this guy got his.

    And the accompanying text to the news photo service image, to be used if published:

    WWI--german--beggar text327

    ·Posted by :

    ·in:

    —

  • Figuring Out What’s What After a Nuclear Exchange, 1954

    JF Ptak Science Books   Post 2401

    Bomb damage261

    [Original document available from the blog’s bookstore.]

    The spoiler answer to this:  make sure to account for the nukes dropped on you  when figuring out what you’ve got left to work with.

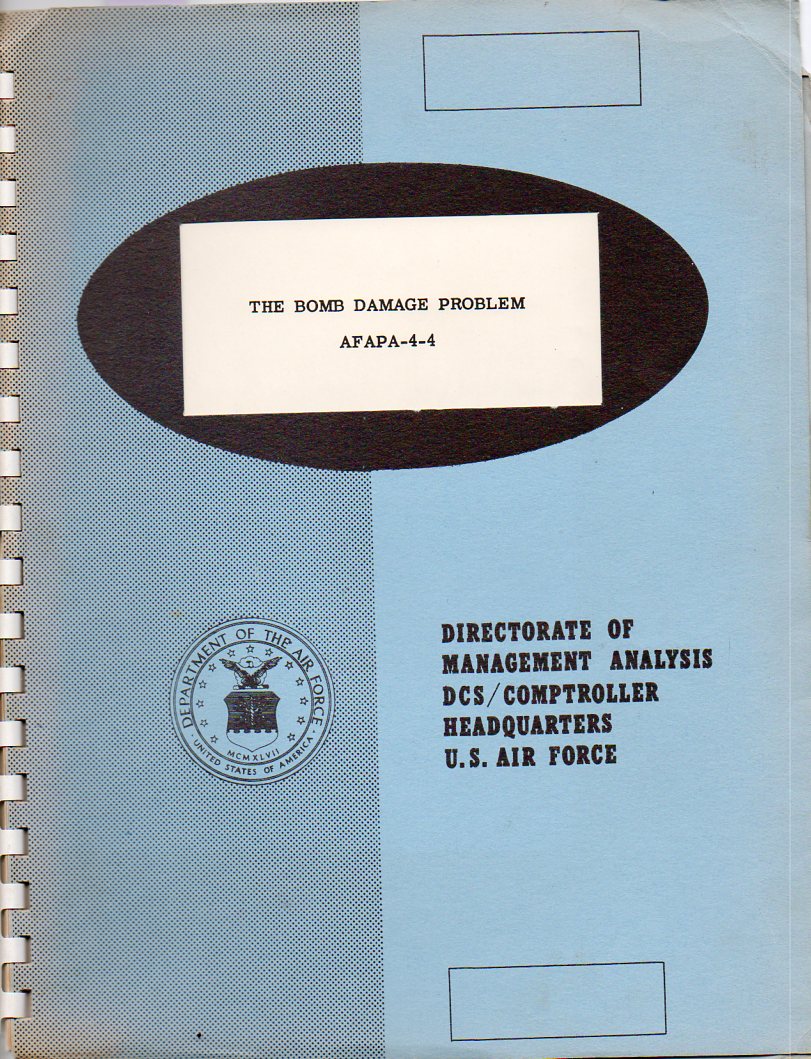
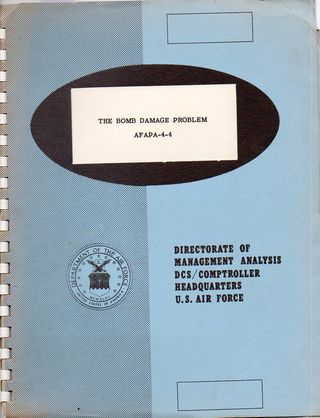
    ITEM:  The Bomb Damage Problem, AFAPA-4-4, published in 1954 by the Directorate of Management Analysis (DCS/Comptroller at the  Headquarters of the U.S. Air Force).  11×8 inches.  GVC binding. 22pp.  Very good condition. RARE.  No copies located in WorldCat.  $175.

    This seems a tautologically  tongue-twisting, not-quite-right title for this post, and indeed it might be.  But that’s the way the pamphlet I’m reporting on read, a sometimes resilient-to- inspection rubberie beastie whose basis for being written was to report on an great oversight that doesn’t really want to be recognized, even if it is the title of the work.

    The Bomb Damage Problem, AFAPA-4-4, published in 1954 by the Directorate of Management Analysis (DCS/Comptroller at the  Headquarters of the U.S. Air Force) is a pamphlet of discovery–or rather, the discovery of the lack of discovery.

    The work is an introduction to some aspects of  nuclear exchange post-attack predictive capacity–particularly with the ability of American industry “to support a war plan”.  

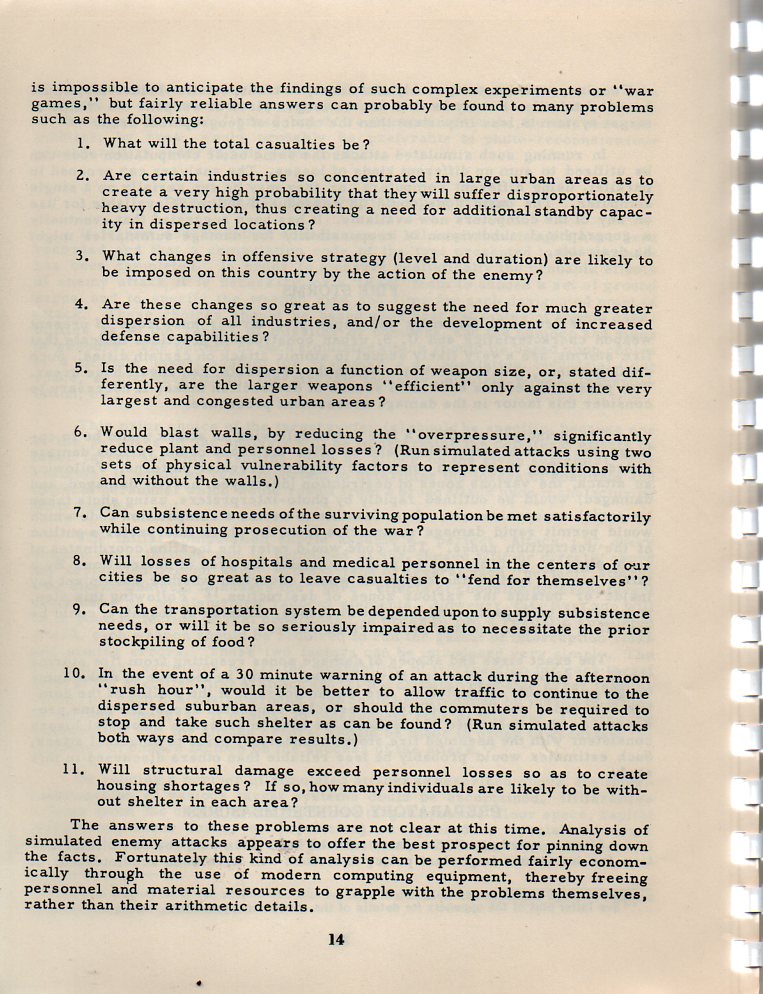
    The anonymous pamphlet gets straight away to the discovery part–that previous predictions of post-attack capacity were “probably completely unrealistic” because “[they] did not take account of the likely bomb damage to the U.S. production facilities”.  

    I would think that even at this relatively early point of planning for possible Soviet nuclear attack that war game scenarios would have taken bomb damage to industry a”and accompanying manpower losses” into account of how the war machine would react after the bombs began to explode.  Though it seems not. I’ve looked to see how I could be misreading this thing because it seems like too monumental an oversight to make. But I can’t find where I’m making my interpretative mistake.  

    Ultimately the authors focuses on saving the corpus of the overall works, saying that this oversight does not damage the “important thinking” that had gone on it spite of this error. 

    The word “error: is not used in the text of course.  This is how it is described: “In connection with this critical new obstacle to intelligent military planning, it is essential that speculation be minimized.” The error is actually redefined as a “critical new obstacle” the effect of which heightens “speculation”.   Which is all true.

    I suppose what is really going on his the formation of some bedrock stuff formulating information gathering for creating a computer program for deeper analytical study of the effects of nuke warfare on post-attack industry.  1954 is about right for the time for this to happen, and the DMA–as the home for the creation of linear programming among countless other things–would’ve been the place for this work to happen.  

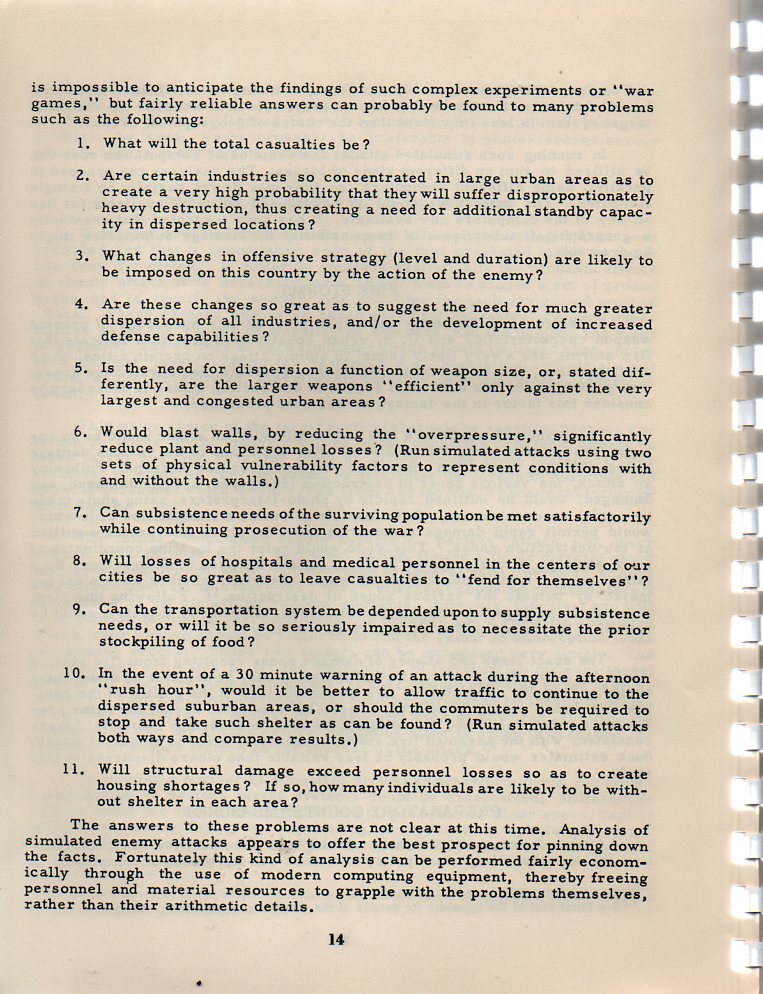
    But I keep coming back to what seem to be enormous understatements–even giving plenty of allowance for the time–that keep cropping up in the pamphlet.  Perhaps it is just stating the obvious for te first time that makes all of these seem so potentially underwhelming, like this nugget:   “numerous measures of the importance of each target may eventually be needed….” (Page 7).  

    There’s plenty of more detail though that occurs in the pamphlet, as in figuring out damage to structures by the yield of the explosion and distance from the target and the composition of the target’s structure, and so on. 

    And then we get back to the obvious: “the principal effect of a fire storm following an attack would be to enlarge the area of destruction and to alter the shape of the various damage zones, changing them from concentric rings to irregular patterns. “.  As I said, maybe it is just a case of a “Call me Ishmael”, or stating that lines and points in space exist for the purpose of geometry.  Still, it rubs me the wrong way, all over.

    And just to make this point perfectly clear:  the “bomb damage” problem is to take into account bomb damage to U.S. war-making, bomb-producing capacity, in a sort of BIBO (bomb in, bomb out)  version of a SISO (shit in, shit out).
    Bomb damage b262

    ·Posted by :

    ·in:


  • On Making Things That Are There Not There: Camouflage, 1917

    JF Ptak Science Books   Post 2400

    Its a little difficult to think of Ellsworth Kelly, Jacques Villon, Grant Wood, Laslo Moholy-Nagy and Thomas Hart Benton as painters-for-war.  But its true, and true for many of hundreds of other artists in the 1915-1918 era. Its not as though they were in the trenches gunning down the enemy or lobbing hand grenades into the swirling gunsmoke. They were camofleurs, camouflage1 experts, artists employed as magicians, Wartime Magi, employed/drafted to make ships and such disappear. 

    Ever since it was (sort of) first noticed in 1915 that designs odd to the environment, stark geometric patterns and such, were capable of fooling the eye, people with  design capacity were pressed into service, rendering offensive and defensive instruments of war optically semi-impervious with variations of the then-five-year-old modern nonrepresentational art. That must’ve been a very odd position to wake up to every morning. 

    Of course the idea of camouflage in the animal world is probably 250 million years old–animals and insects have been blending into their environment for eons, and I’m sure too that early hominids did their fair share of walking behind brush.  But the idea of hiding great amalgamations of very heavy metal with paint is really quite modern.

    World War I photos--Camouflage291 [The original photograph is available for purchase at the blog’s bookstore, here.]

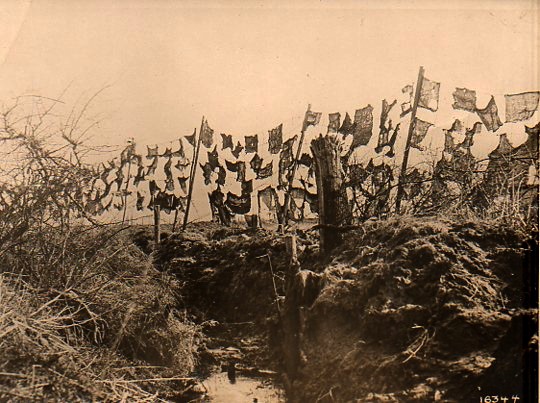
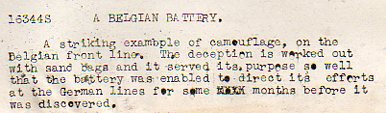
    In this photograph the camouflage is more a more futuristic conception of art than the abstract and cubist approaches that were taken during the war, this looking more like assemblages of found material more than anything else.  And, according to the text that accompanied the photograph (which comes from 1918, from the Underwood & Underwood news photo service agency), the camouflage–empty sandbags thrown on a barbed wire fence) successfully concealed a gunnery emplacement for months on end. 

    World War I photos--Camouflage det292 

    Notes

    1. A fine bibliography on camouflage appears here, at Leonardo Online.

    The definition of “camouflage” from the Oxford English Dictionary shows that it is a young word, in English:
    “(n) The disguising of any objects used in war, such as camps, guns, ships, by means of paint, smoke-screens, shrubbery, etc., in such a way as to conceal it from the enemy; also, the disguise used in this way; freq. attrib.


    1917    Daily Mail 25 May 4/4   The act of hiding anything from your enemy is termed ‘camouflage’.
    1917    Daily Mail 16 July 5/3   The King paid a visit to what is called a camouflage factory.
    1922    C. E. Montague Disenchantment viii. 108   A French aerodrome across which the French camouflage painters had simply painted a great white high-road.

    ·Posted by :

    ·in:

    — —

  • On the Superiority of Salvage

    JF Ptak Science Books     Post 2399

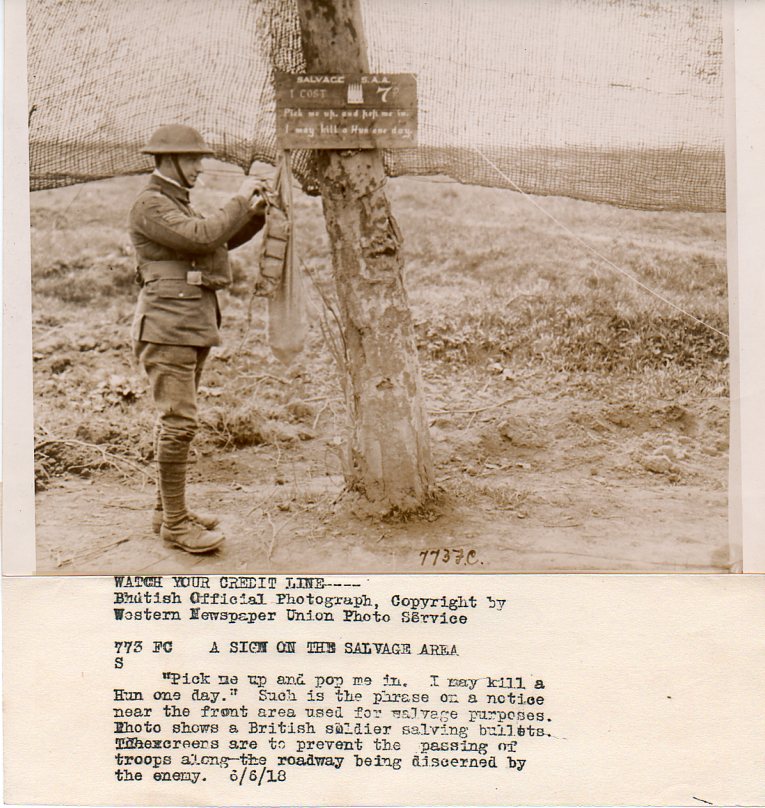
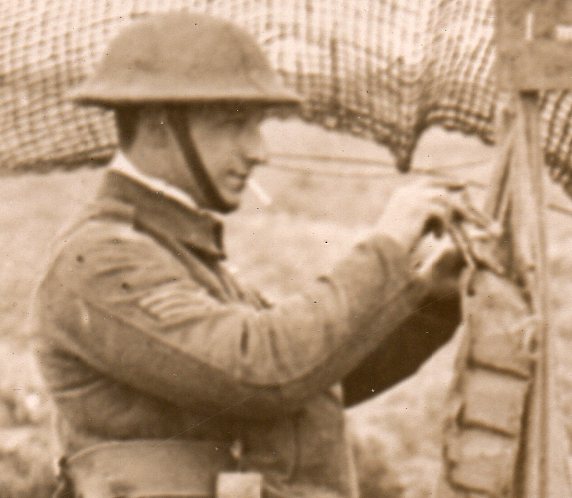
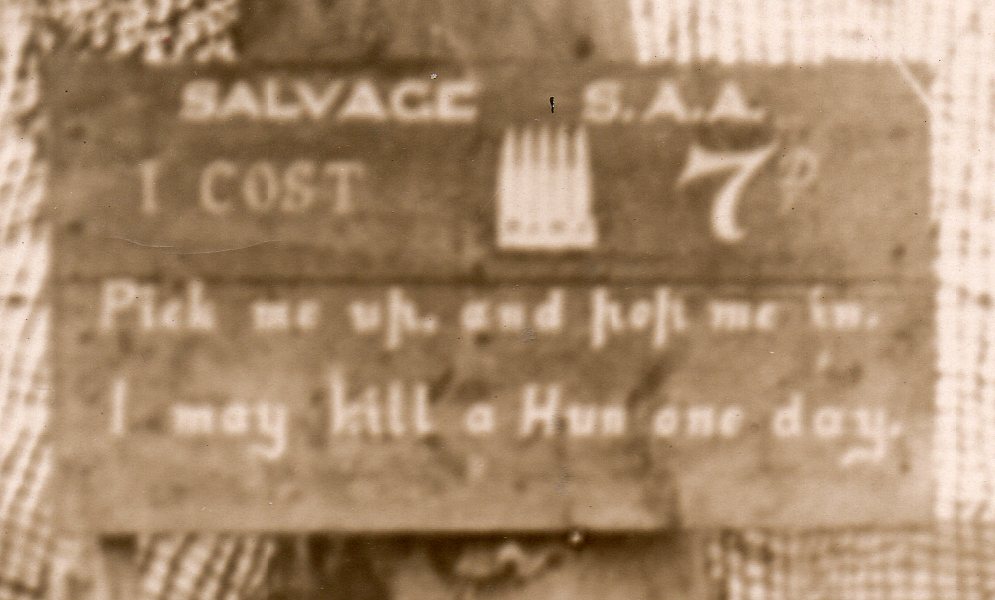
    A little went a long way, sometimes, in collecting the ends and bits of a campaign or a retiring column or from the attics and basements of village houses, or in scrapyards or dustbins or abandoned yards and buildings. Scrap has sometimes contributed greatly to major war efforts; and sometimes it has contributed just a few hundred rounds of ammunition, gathered from the sick or dying or forces on the move, that have told the tale of change in battle.  When you can only carry so much in a campaign where shooting can be an endless process, you can by definition never really carry enough bullets when you’re already carrying enough of everything else.

    WWI--salvage719
    WWI--salvageb720

    WWI--salvagec721

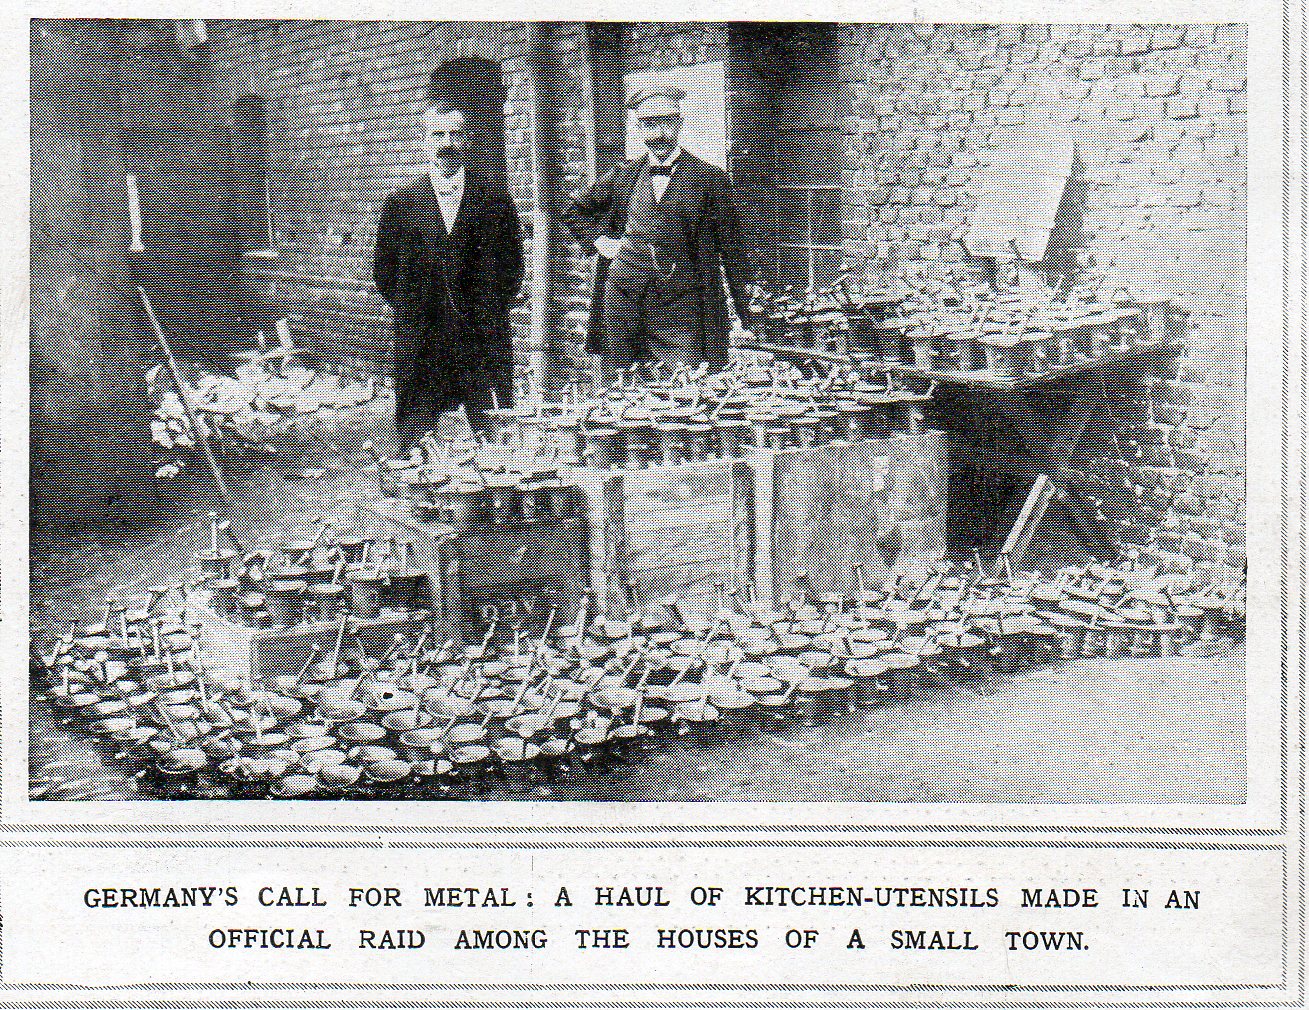
    On the other side of the line, the Germans were trying to utilize every bit possible for the war effort as well–here’s an example of a round-up of metal goods taken from the kitchens of a small town (looking mostly like mortar and pestel sets).  In towns throughout France, on the other hand, church bells were collected and stored away, hidden from possible capture and melting by German troops.

    WWI--raid on pots and pans694


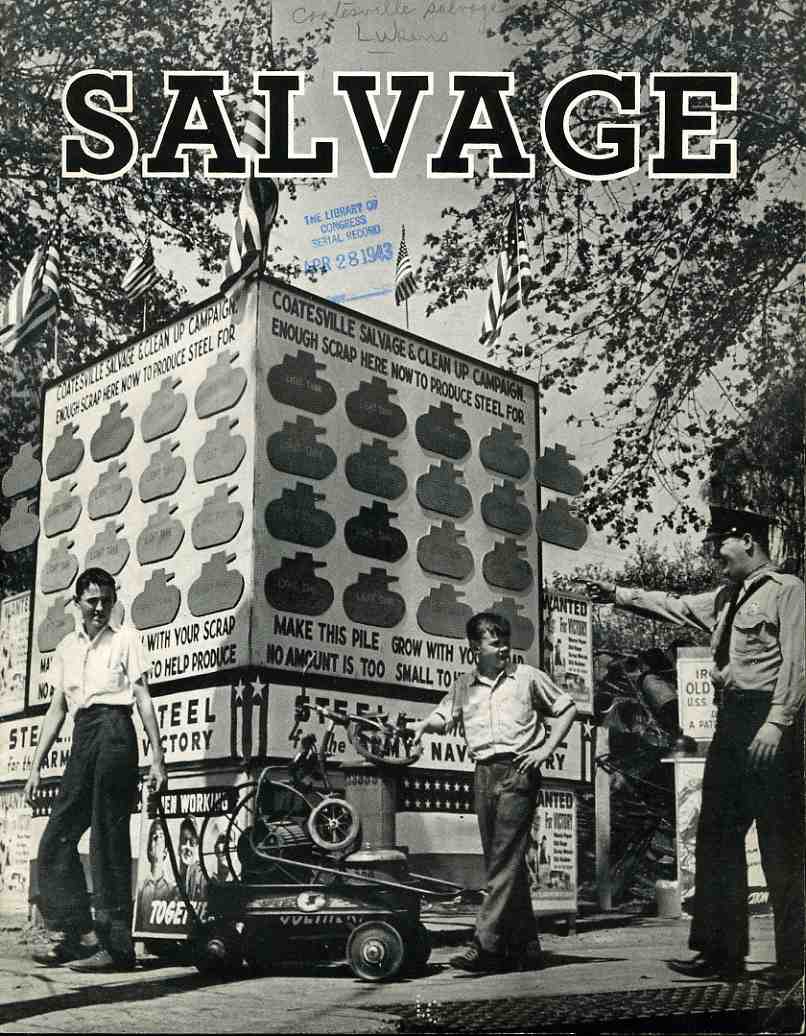
    Now for an example from WWII: Salvage (1943) is just simply brilliant!  It is a superb  design, getting its inelegant point elegantly across to the reader, making the collecting of junk  a bona fide war effort, triumphant, superior; it delivers the message gorgeously.  Who wouldn’t want to rush out and look for some metal scrap and bits and grow a neighborhood junk yard so that the community could build a tank?  Certainly these two boys–under the watchful guidance of a smiling cop in a black tie–couldn’t resist, and from the looks of the progress billboard behind them, nor could anybody else in the neighborhood, as the community collected enough metal junk for 14 tanks.  (Or at least pieces and chunks for fourteen tanks.)

    00-blog-Oct 25 salvage922

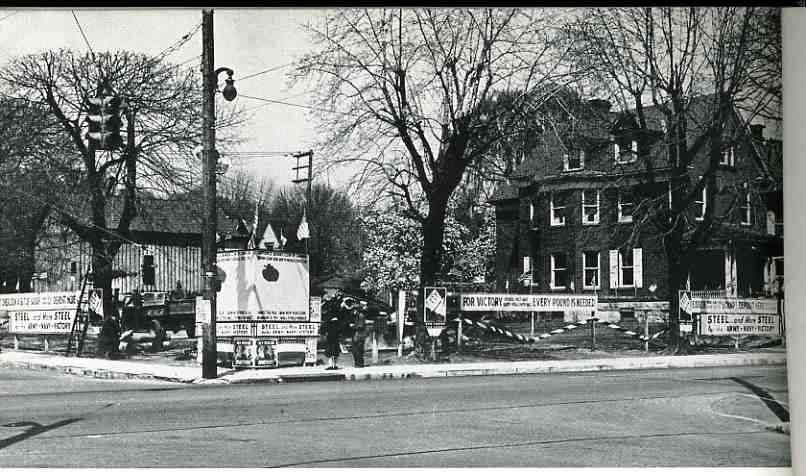
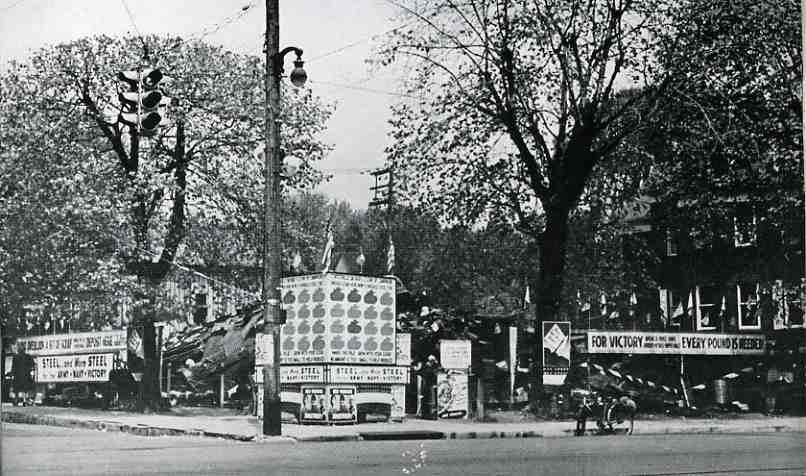
    The community was Coatesville, Pennsylvania, and they certainly did their collecting-best.  The two photos below show (top) the scrap yard after two days of collecting, and (bottom) the end of the campaign two months latter.

    00-blog-Oct 25 salvage before923

    00-blog-Oct 25 salvage after924


    00-blog-Oct 25 salvage before923


    “One pound of fat contained enough glycerin to make a pound of black powder, enough for six 75-mm shells. Twenty three hundred old nylon stockings contained enough nylon to make one parachute. Thirty thousand razor blades contained enough steel to make fifty 30-caliber machine guns.”   (Lingeman, Richard R. Don t You Know There Is a War On? The American Home Front, 1941-1945. New York: G.P. Putnam’s Sons 1970, 254-55).  When you have an entire town doing this, you can build tanks; when you have millions of people throwing together to collect this “junk”, then you get part of a war effort.  It is also part of a giant propaganda hearts/minds machine, especially for the U.S., which was (and I use this word with some hesitation) cushioned from the effects of the war by two oceans–it reminded people who hadn’t contributed a life to the war that there was actually something tangible going on, and that they could do something to help.  It kept peoples’ minds in the game.  Rubber was another big concern, as was silk (the controlling exporter of both coming largely from overseas, and in the case of silk, the exporter was Japan.)  Of course there was the introduction of synthetics for both silk and rubber, but the point in fact was that there was indeed a shortage, and the donated and salvaged stuff was necessary.                                                                                                            

    ·Posted by :

    ·in:


  • Inventory of the Apocalypse (1964)

    JF Ptak Science Books    Post 2398 

    Describing computer programs “Picnic” for biological/chem weapons damage,  and “Dusty” , for radioactive casualties

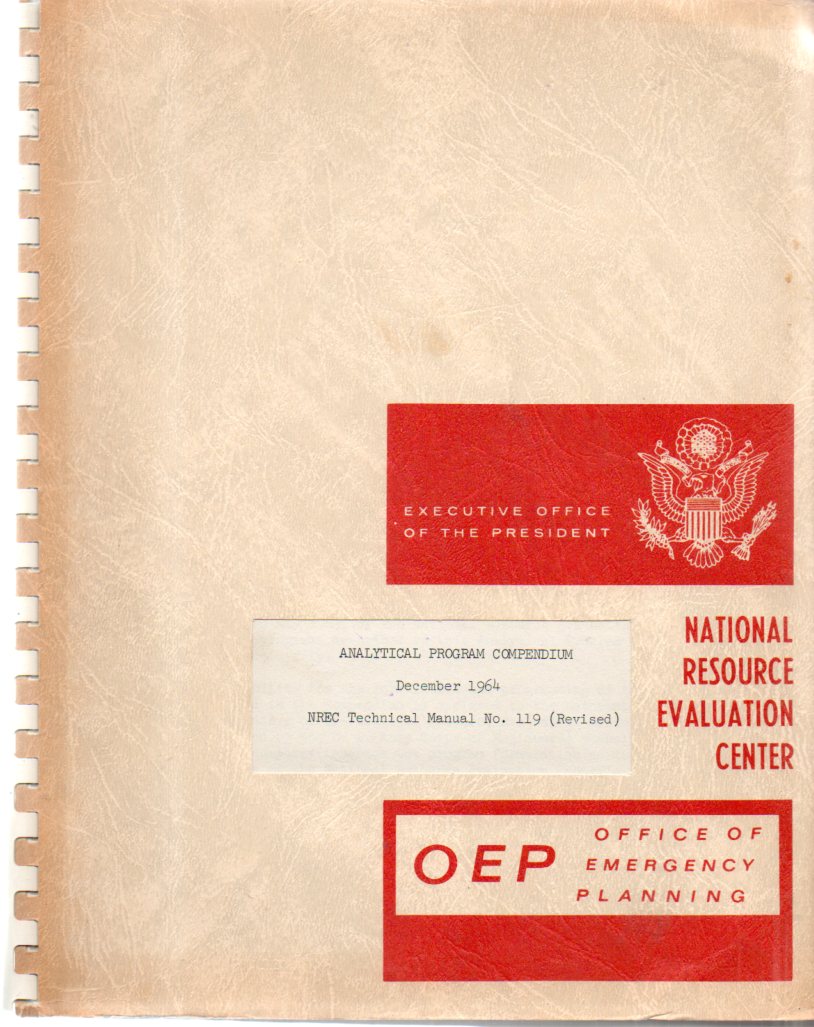
    This was an interesting read, though it took a little while to actually understand what it was I was reading.  Mathematics and Computation Laboratory, National Resource Evaluation Center, Analytical Program Compendium NREC Technical Manual No. 119 (Revised) was pritned on December 1964, housed in the covers of the  Executive Office of the President NREC/Office of Emergency Planning. The prose is mostly congestive, but after a bit you can pick up the rhythm and it becomes more user-friendly.  

    Preface signed by Joseph D. Coker, Chief, National resource Evaluation Center, who writes: “The Analytical Program Compendium gives a brief description of the National Resource Evaluation Center’s current general purpose analytical programs and replaces earlier editions of the NREC Glossary of Damage Assessment Programs. It is intended as a guide for users and potential users of these programs to indicate the various programs that are presently available and those that are being produced. Separate Technical Reports or Technical Manuals are available for the standard operating programs and for a number of those which are in preparation. Reference to these manuals and reports can be obtained in the Bibliography of Publications (Technical Manual No. 121) published by the NREC. The Compendium contains descriptions of the computer programs of a substantive nature.”  

    Nrec 664


    [Can’t live without this Cold War document? See out blog bookstore to purchase the original.]

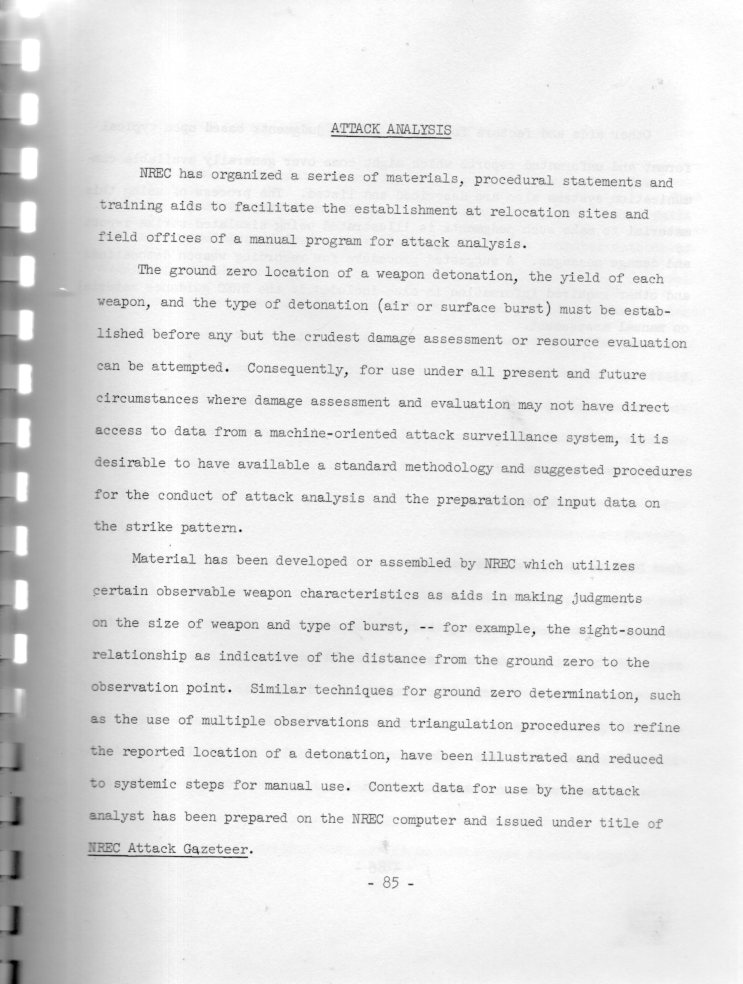
    The list of the contents of the 92-page work is pretty interesting, the book presented in eight sections (or “casualty classes programs”):  (I) Attack Analysis Programs; (II) Vulnerability Analysis Programs; (III) Damage Assessment Programs (Direct Effects, sections dedicated to nuclear shots Dusty III, Flame I, Jumbo III, Streak IV, Dart II, Dart III, Picnic, Ready I.(IV) Resource Evaluation Programs; (V) Economic Analysis Programs ; (VI) Resource Management Programs; (VII) Mapping and Display; (VIII) Manual Procedures for Damage Assessment and Resource Evaluation.  The last section describes programs of manual damage assessment (“developed by agency representatives for use when computer estimates are not available”).

    Nrec 663


    Under section III are described the various other programs computing availability of surviving resources and damages to the rest, and to assess capability and loss. For example:  Weapons Edit III (working on an 1103 AS or 1105 computer) calculates missile availability; Dusty III (fallout intensity “…at weapon oriented points”; Flame I (“computes an estimate of the extent of the spread of uncontrolled fire”) and can compute fire maps; Jumbo III (a casualty assessment program); Attack Environment III (“determines the blast effect from the dominant weapon and combines the separate effects of fallout and from from all weapons that affect each resource point”); Facility Assessment (Namepoint) III ( for physical damage to facilities); Time-Phased Accessibility  (“listing of accessibility of resources in various conditions of damage after an attack”); Population III (summing up casualties in populations after attack; Manpower III (translating population losses into labor losses and how it would affect x,y, and z); Livestock III (keeping tabs on livestock “and livestock products”); Streak IV (‘high speed estimate of blast and fallout casualties, estimates of damage and denial of facilities…”); Picnic (!, estimating casualties from biological or chemical weapons), and a number of other programs. 

    There are some other interesting programs for end game times: Net Inventory (“(a) routine (that) is a balance sheet between supply (inventory and production) and demands (requirements)” and Amounts of Production (“a routine (showing) the production based in facility damage and labor casualties; and of course Survival II, which computes “the total requirements…for regions”.

    Of course it was necessary to figure all of this stuff out so that in the event of The Big One there is a certain control over what is where and what is left and what is needed and so on.  

    There is no mention made to where these computers are housed. 

    It certainly seems that if there was to be a nuclear holocaust, it would be well-enumerated.  

    ·Posted by :

    ·in:


  • Underestimating the Mechanics of the Invasion of England, 1940

    JF Ptak Science Books    Post 2397                                  Part of a long series on the Display of Quantitative Data

    England was last invaded in 1688 by the Dutch republic, following twelve other attempts from 1066, but Adolf Hitler was half-determined to do so (and several of his leading generals who were not-at-all determined, anti-determined to do so) himself, trying to follow in the lost  footsteps of Napoleon with Operation Sea Lion (Unternehmen Seelöwe). Napoleon failed of course, as did his predecessors: three French, two Spanish, and an Austrian attempt since 1707. And so would Hitler, although he would never come close to implementing much outside of his terror attacks on cities in the U.K. and the war waged on the RAF (and particularly Fight Command)–control of the air being integral to any sort of invasion that he might try to mount.

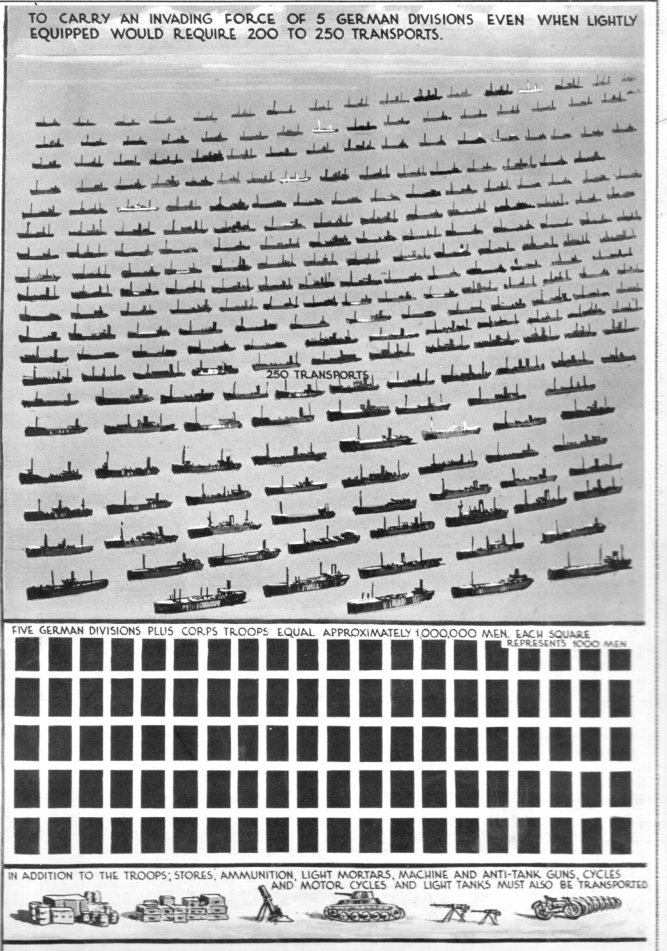
    It was at the beginning of this air attempt–the Battle of Britain–that the following interesting  small graphic appeared in the Illustrated London News  (June 29, 1940), a featurette on what it would require for the Germans to mount a successful invasion of England. Interestingly the Brits had just mobilized their own floatilla for the evacuation of Dunkirk just weeks (26 May-4 June 1940).  

    The German armada pales in comparison….

    Data vis German invasion England662


    Some part of it doesn’t make sense to me, (sitting here quietly in the future, not having Nazis flying overhead trying to kill my country)–like a convoy of troop carrier set at 250 to carry a million soldiers into the U.K.   Plus there were all of the stuff of invasion–food, supplies, support, materiel of all shapes and sizes and description, and on and on.  The D-Day invasion force used 6,939 vessels, 1,213 naval combat ships, 4,126 landing ships, 864 merchant vessels, and 736 other ships, not to mention the 3000+ aircraft and gliders, all in use toland 156k soldiers along a 50 mile front in Normandy. An utterly understated spectacular undertaking–and no doubt the Germans would have had to do something along similar lines, a lot of something that they just didn’t have. But no one knew this yet, not really.

    This small series of graphics probably served two purposes: one was to alert English readers that such an invasion was theoretically possible, and secondly, that, well, it was in some ways impossible, given the enormity of the task. So, beware, but do not fear, is what I think the message was here.  

    And by the way here are two bits of films about a successful Nazi invasion of England: 

    It Happened Here, 1966:


  • History of Dots: Dots of Death, 1937

    JF Ptak Science Books,  Quick Post                                                                         Part of the History of Dots series

    Data visualization traffic  death658

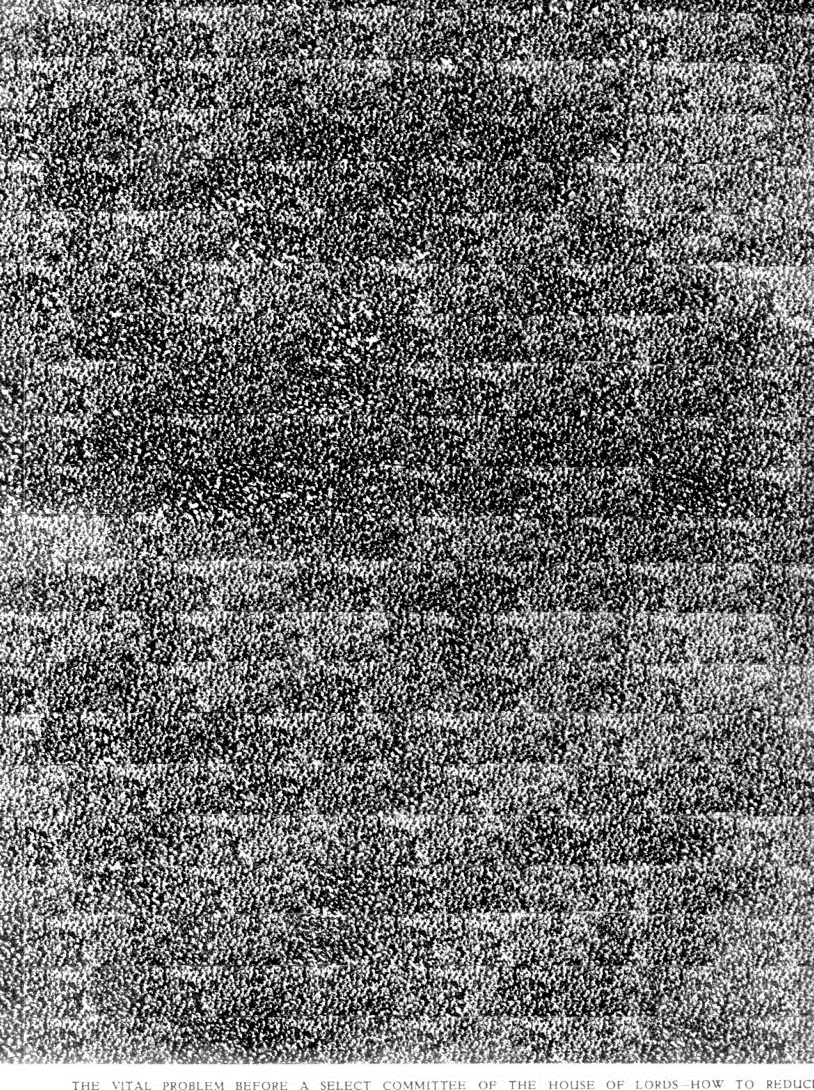
    This is one half of a very impressive, “what the holy heck” sort of photograph–even more so that it portrays the number of people killed in road accidents in England from 1928-1937.  67,100 people were killed–the number of injured was evidently 30 (!) times higher.  This is particularly impressive given that in all of the U.K. 2175 people were killed in 2012 compared to 36,000 for the U.S., which means 3.5/100,000 in the UK and 11.6/100,000 in the U.S. So things have gotten much better now than they were then, with a third of the fatalities for a much larger population. In any even the photo montage was a very compelling image, and was printed in the Illustrated London News, December 18, 1937, page 1110.  

    An extreme detail figuring about 2% of the image: 

    Data visualization traffic  death660

    Another detail, about 1/20th of the image:

    Data visualization traffic  death659

    ·Posted by :

    ·in:

    —

  • Color in Black & White (#4): Stained Glass Designs, 1937

    JF Ptak Science Books  Post 2396    

    Part of the series on the History of Blank, Empty, and Missing Things

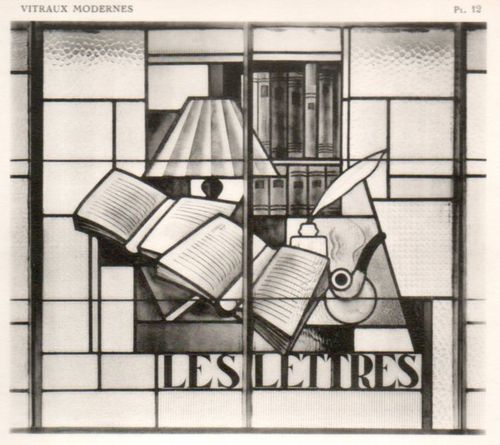
    Sometimes the suggestion of color is color enough, though I had never really thought about it in terms of stained glass windows before.  They do have an elegance, even in photographs (never having seen anything extensive in person, just bits and pieces). These designs weren’t in black and white in real life–they were just printed so, for unknown reasons, even though the portfolio in which they appeared was half-luxurious. (I have a book depicting the windows at Chartres that is also done in black and white.)  This makes a good and appropriate entry in a long series on this blog called Blank, Empty, and Missing Things, the “missing” part here being color outside of black and white.

    The following images are of modernist stained glass designs collected and curated by Robert Mallet-Stevens (1866-1945)–one of the leading between-the-wars French architects–for the International Exposition of 1937.  

    Stained glass414

    “L’Exposition de 1937, qui nous montre la ‘généralisation’ de l’architecture moderne, nous offre quelques vitraux de tout premier plan… Quand l’architecte voit dans l’espace des volumes bien ordonnés, le peintre verrier trace des lignes et oppose des couleurs heureuses… Je n’oserai dire que l’architecture moderne est en plein progrès, mais je puis affirmer que le vitrail ‘va très bien’!”   From he introduction, by Mallet-Stevens. (Basically, Mallet-Stevens is saying that the Expo is presenting the newest form of modernist architecture, and that the stained glass work in particular was powering ahead (“‘va très bien’!”)). 


  • Beautiful Lines: Depicting Voyages of Discovery, 850-1850

    JF Ptak Science Books   Quick Post

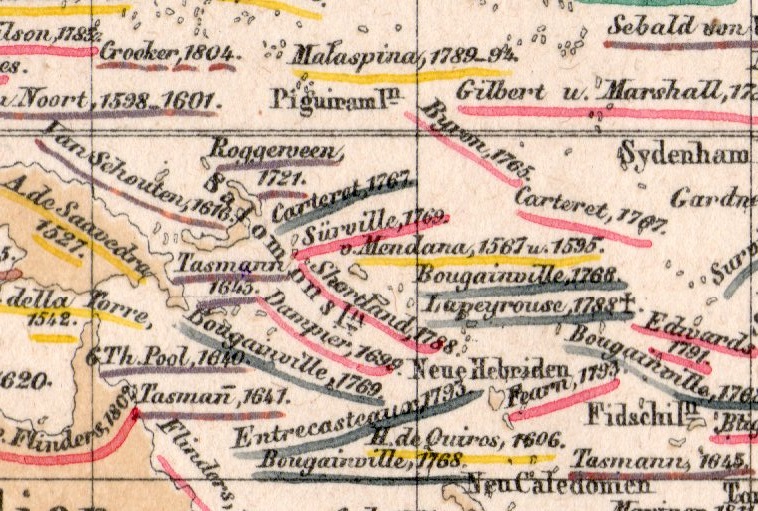
     This small detail (measuring about 1/3″ square) is from a fine, detailed, and oddly beautiful map (itself only about 12×9″) which was published in the atlas volume1 to accompany the best-selling encyclopedic presentation of the natural history knowledge of the world to that time, Baron Alexander von Humboldt’s Kosmos, which was published over a period of several from 1845-1862.  

    Map visualization ocean currents657

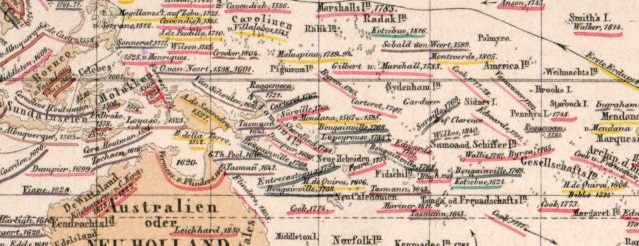
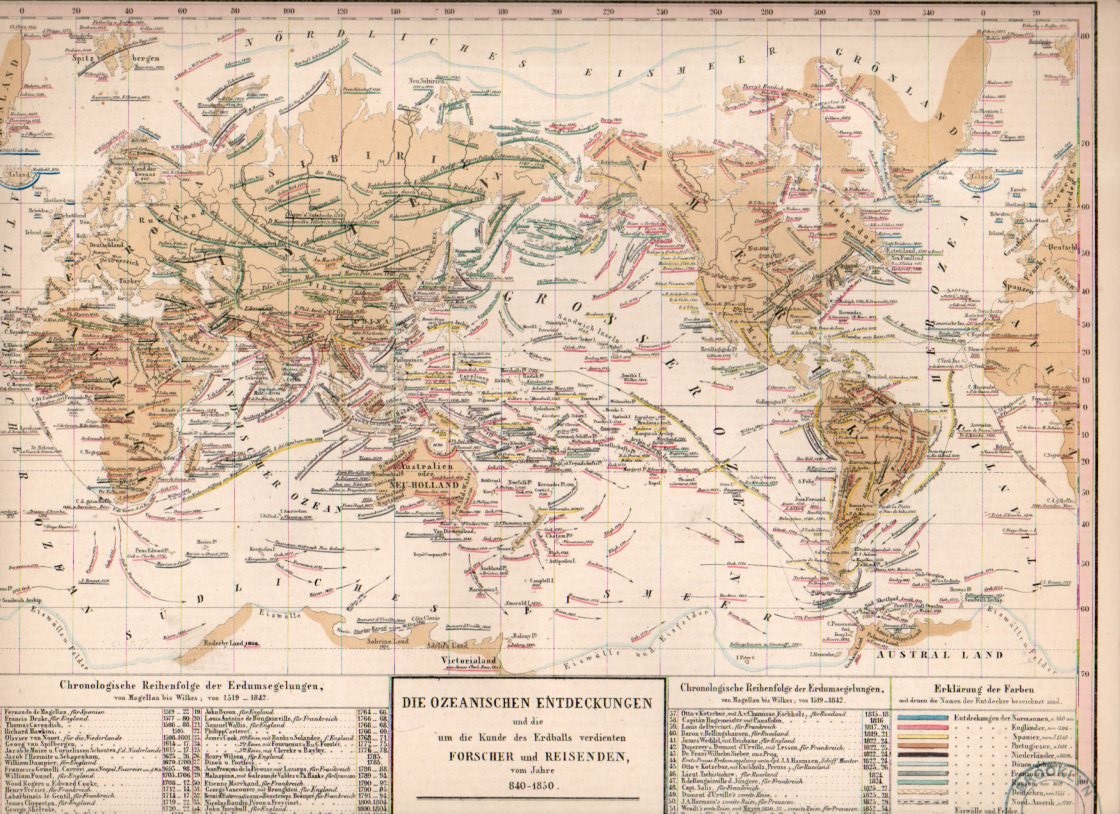
    The map is titled Die Ozeanischen Entdeckungen und die  um die Kunde des erdballs verdienten  Forscher  und Reisenden vom Jahre 840-1850, and depicts voyages of discovery for a milennium, 850-1850. It is a terrifically-detailed map, even among highly-detailed maps. (This detail is taken froma 1×2″ section seen here:)

    Map visualization ocean currents656


    And the full map:

    Map visualization ocean currents655

    Notes:

    1.  The atlas was by T. Bromme, Atlas zu Alex. V. Humboldt’s Kosmos in zweiundvierzig Tafeln mit erlauterndem Texte. Herausgegeben von Traugott Bromme. Stuttgart. Verlag von Krais & Hoffman. (with second title page) Atlas zur Physik der Welt in … Bromme, 1851.