A Daily History of Holes, Dots, Lines, Science, History, Math, Physics, Art, the Unintentional Absurd, Architecture, Maps, Data Visualization, Blank and Missing Things, and so on. |1.6 million words, 7500 images, 4.9 million hits| Press & appearances in The Times, Le Figaro, Mensa, The Economist, The Guardian, Discovery News, Slate, Le Monde, Sci American Blogs, Le Pont, and many other places… 5000+ total posts since 2008.

Category: Information, Quantitative Display of

  • The Future of Oil in 1921

    JF Ptak Science Books   Quick Post

    Oil production

    [Image source:http://www.railsandtrails.com/AutoFacts/1921p12-100-8.jpg]

    There wasn’t that much of a comparative draw on what was supposed to be the world’s total supply of oil, assumed to fill a barrel about 3×1 miles, or 65 billion barrels.  (Also I assume that they are talking about oil oil, total oil, not some derivative of crude/natural/refined petroleum products and so on.) That was supposed to be enough for 140 years at the  level of consumption, about 65 billion barrels, which sounds like a lot when you drinking up 500 million/year. And it should be noted that this was for U.S. consumption only–I don’t know what happened to the rest of the world on this one; probably it was a failure of gathering statistics rather than a myopic America-only viewpoint.

    But that was 1921, and there is no mention of the Middle East (which wouldn’t become a player for a few decades) and other oil-rich regions, and other factors too numerous to mention in this quick post, so it was very much a prediction of the moment more so than of the future. The other very problematic issue with the graph is assuming the “current rate of consumption”, which would absolutely and totally miss the explosion of oil-consuming vehicles and the production of pretroleum-inclusive products.  The bottom line is that in 2013 the total world production of all aspects of oil was about 32 billion barrels1, or half of what was thought to be the total world reserves of oil in 1921.    

    Footnotes

    1. U.S. Energy Information Administration, http://www.eia.gov/cfapps/ipdbproject/IEDIndex3.cfm?tid=5&pid=53&aid=1


  • Measuring Things with Mountains & the German Big Gun of WWI (1918)

    JF Ptak Science Books  Quick Post

    The story of the (very) long-range bombardment of Paris from points unknown is filled with questions in this article that appeared in the Scientific American on April 6, 1918.  The writer hadn’t an idea of the type of gun being used, the weight of the shell (yet), and just about all other details.  The author did wonder about the reasons for such a gun–that the idea of a long-range indescrimient bombing from a great distance just seemed to be beyond the wanting capacity of the countries fighting Germany.  

    The big gun was The Big Gun, later identified as the Paris Gun–a mysterious entity during the war, and after the war as well.  It turns out that when the Germany army retreated beginning in August that they also destroyed the weapon and just about anything connected to it.

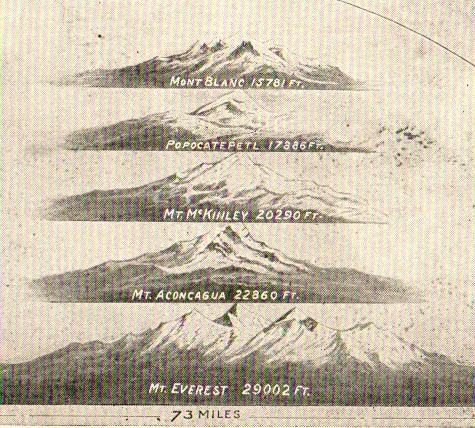
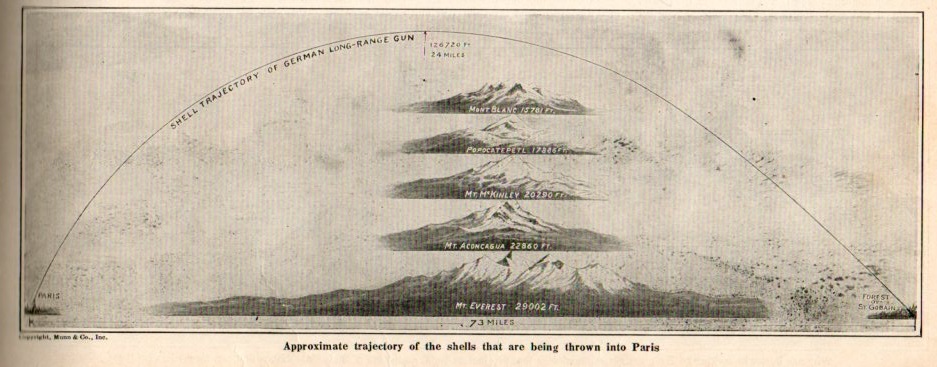
    The gun was extremely powerful.  At 256 tons it launched a 236-pound shell to a height never before achieved by humans launching/propelling stuff into the air–it left the barrel of the gun at about 1 mile/second, traveled 75 overland miles, reached a height of 26 miles…and then came down, exploding, killing.

    One very effective way of explaining the incredible height that the shell reached was measuring the zenith of its trajectory in terms of mountains:

    WWI--german gun569

    Which is a detail from:

    WWI--german gun568

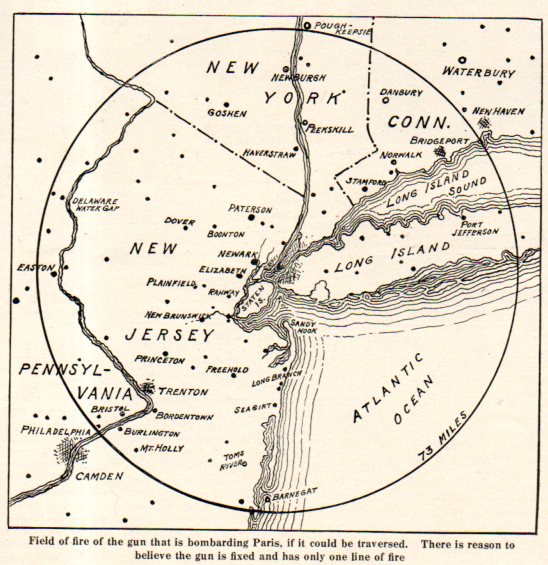
    And to give a more local understanding of the range of the gun:

    WWI--german gun567No doubt this map gave a true flavor and sense of dread to American readers on exactly what it meant to have to deal with a cannon whose reach was 75+ miles. 


  • Interesting Graphic: German Military Forces, 1929

    JF Ptak Science Books  Quick Post

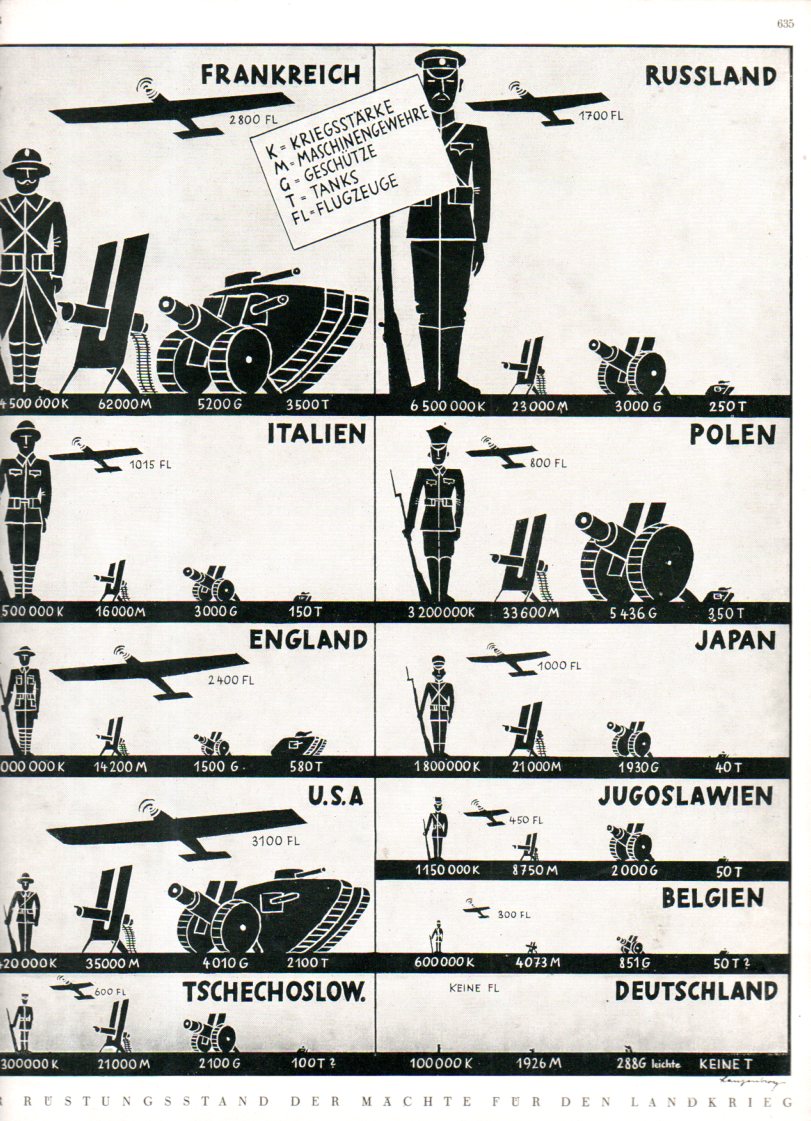
    Graphic Army strength 1929551

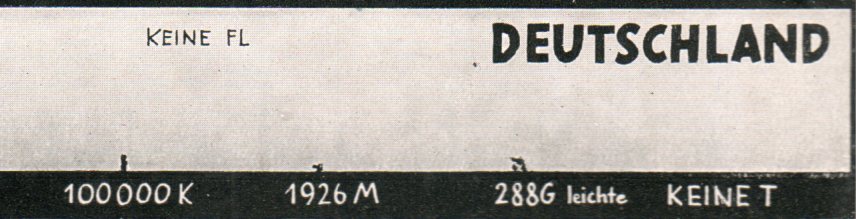
    This is for issue #4523, August, 1929 of the Illustrirte Zeitung (Leipzig), “Der Rustungsstand der Machte fur den Landkrieg”, which showed the comparative strengths of leading nations against that of Germany.  As seen in the detail, in 1929 Germany was still abiding by the Treaty of Versailles, which was the peace treaty ending WWI and signed in 1919. The 440-clause treaty spent the first two dozen or so clauses discussing the creation of President Wilson’s League of Nations, while the rest was a distribution of punishment and reparations against/on Germany.  The German military as directed by Versailles was limited to 100,000 soldiers, and had 1926 machine guns, and 2886 cannons.  as stipulated Germany could have no tanks and no air force, and was limited to six ships and no subs, and had to keep the Rhineland free of all armed forces.  This would all be completely changed by 1934, when the Nazis were already well on the way to having a competitive (and modern) fighting force which counted 4.5 million troops.  It would only get worse.  

    Graphic Army strength 1929550


  • Interesting Graphic Display for Aircraft Losses, 1917

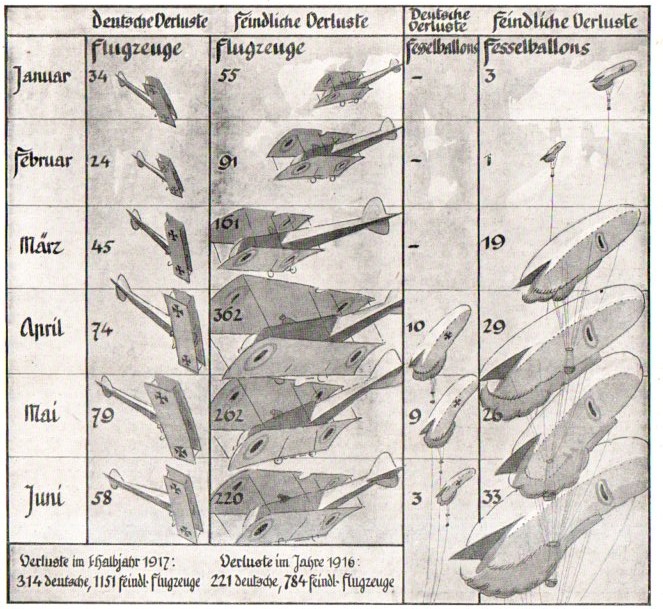
    JF Ptak Science Books   Quick PostGraphic aircraft losses 1917548

    This interesting graphic came in a browsing expedition in the July-December 1917 volume of the (Leipzig) Illustrirte Zeitung.  It appeared in the issue #3865 for July 17, 1917, in an article “Fliegererlebnisse” (“Aviation/Flying Experiences”) by Adolf Victor von Koerper. (Koerper was a very interesting man–aviator, early upper-echelon supporter of Adolf Hitler 1922-1926, and then accused and convicted and sentenced-to-death Hitler assassination conspirator.)  The chart shows the success of the German air force against the “Feindliche” (“Hostile”) aircraft, depicting losses (“verluste”) in airplanes and war balloons (“fesselballons”), for January-June, 1917.  According to this German losses were set at 314 aircraft and Allied forces at 1151, with a very high loss rate for (“Bloody”) April.  


  • A History of Writing for Children (1726)

    JF Ptak Science Books  Post 2373

    In the late 17th century John Comenius (1592-1670) wrote a book about universal (mostly practical) knowledge called The Visible World…, which also happens to be the first illustrated children’s book. It was a book about virtually anything, and everything, and certainly not a book about nothing, because sooner of later Comenius would get to the topic and deal with it, right or wrong.

    The book was originally written in 1676, and translated into English in 1726; in that edition the translator states the purpose of the work:   

    To entice witty children to it, that they may not conceit a torment to be in the school, but dainty/are., For it is apparent, that children (even from their infancy almost) are delighted with Pictures, and willingly please their eyes with these fights: And it will be very well worth the pains to have once brought it to pafs, that fcare-crows may be taken away out of Wifdom’s Gardens…”

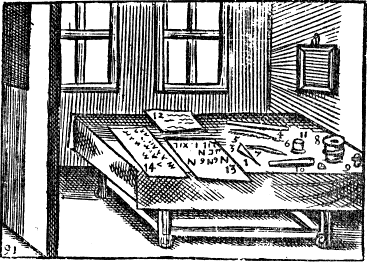
    The sections on writing and writing instruments and books are very engaging–they are short and concise, and all of the practicing elements of the illustrations are labelled and identified, which is a major bonus. 

    On Writing

    Children--writing

    [Images from John Comenius,  Orbis Senfualium Piélus: Omnium Principalium in Mundo Rerun/ &f m Vita Alопит,  translated as Pictura et Nomenclatur, the Visible World, or A Nomenclature, and Pictures of all Chief Things that are int he World, translated into English by Charles Hoof…1726.  See an earlier post here for more on Comenius. Image Source:  PROJECT GUTENBERG.]


  • Beautiful Lines: Depicting the Climate, 1851

    JF Ptak Science Books  Quick Post

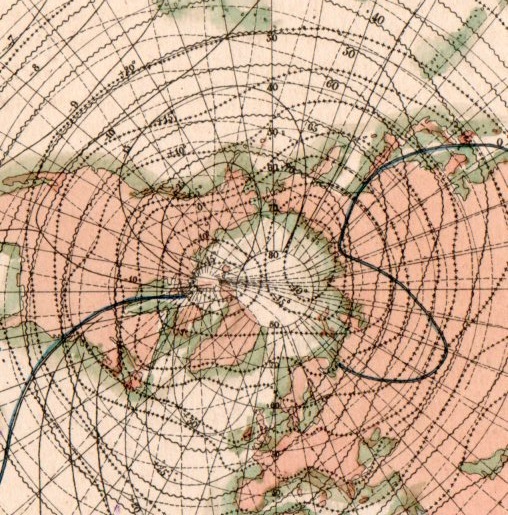
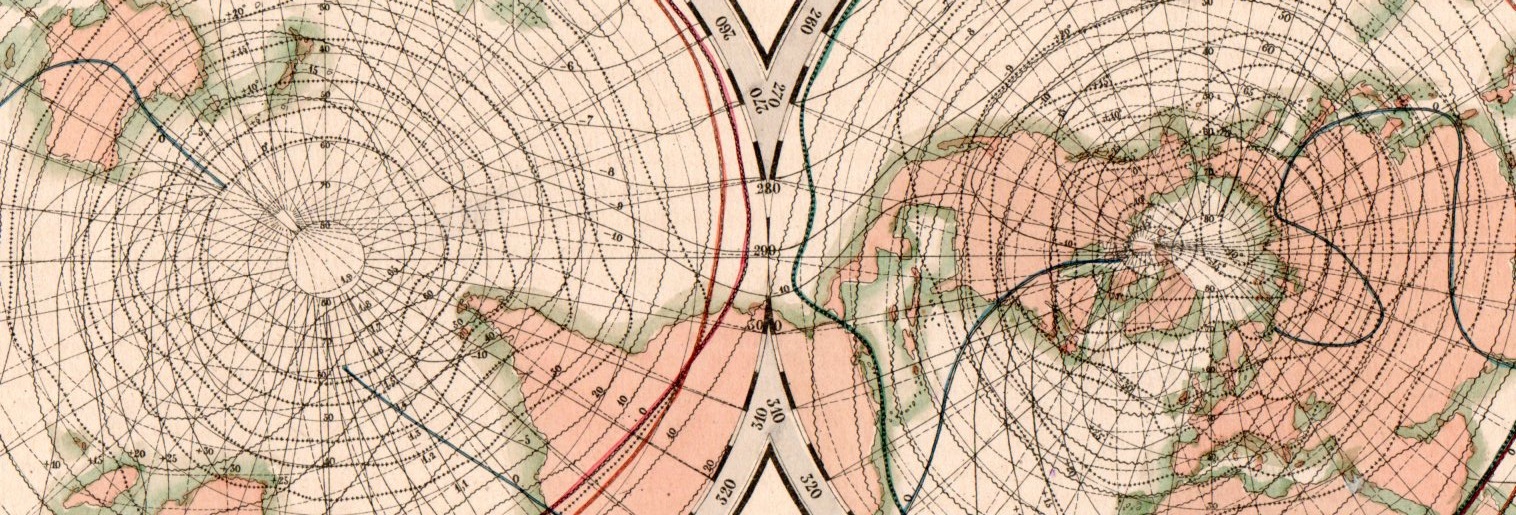
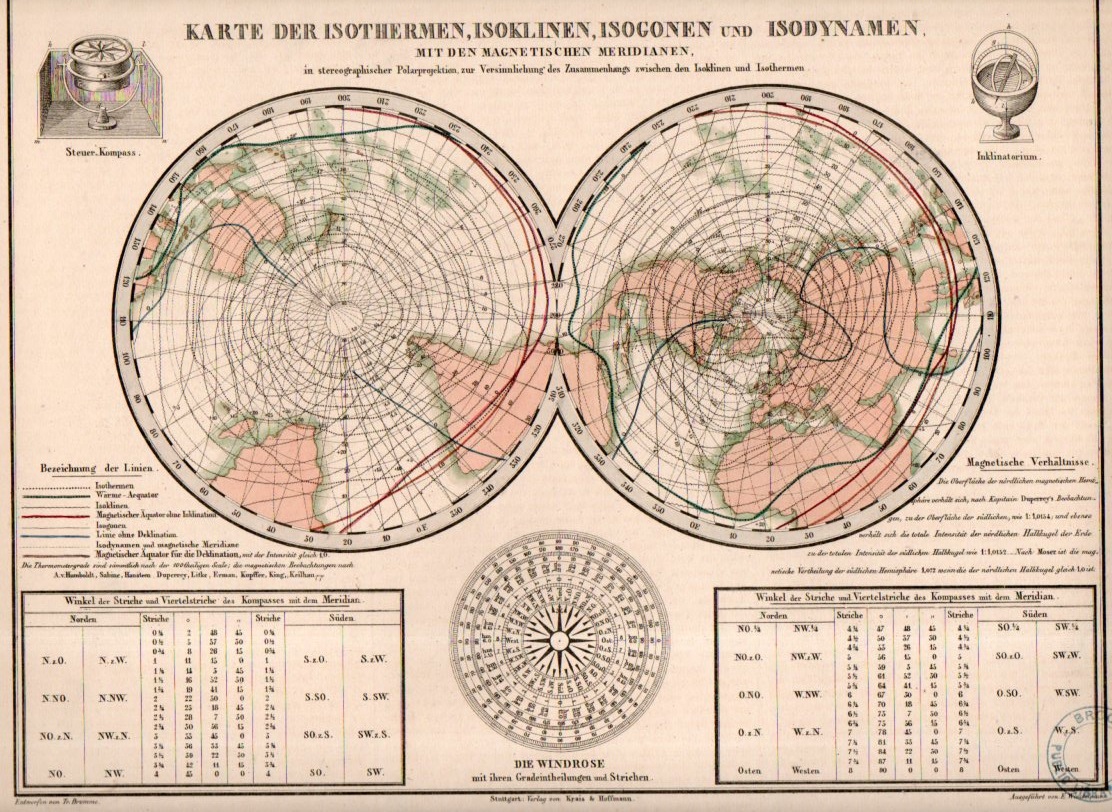
    This beautiful network of lines tells the early story of weather in cartographic form. They appear on Karte der Isothermen, Isoklinen, Isogonen und Isodynamen mit der Magnetischen Meridianen, and was published in the atlas volume1 to accompany the best-selling encyclopedic presentation of the natural history knowledge of the world to that time, Baron Alexander von Humboldt’s Kosmos, which was published over a period of several from 1845-1862. The map demonstrates and visualizes climatic information showing isothermes, isoclines, isogones and isodynamics, with the magnetic meridian.

    Map visualization isotherm653

    [This is a detail of the Northern Hemisphere section of the double-hemisphere map, which is reproduced below.]

    Map visualization isotherm654

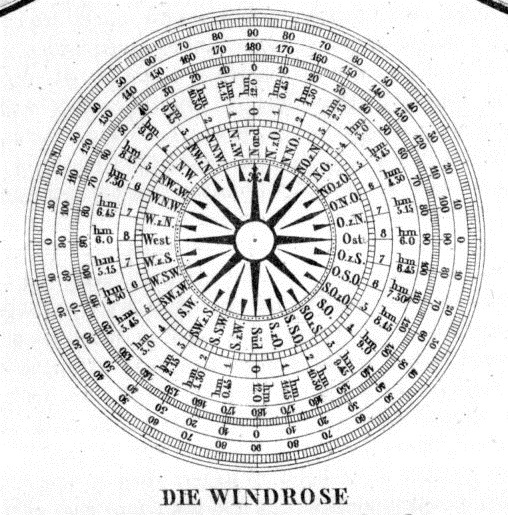
    At bottom there is also a beautiful 32-point wind rose:

    Map visualization isotherm651

    And this, the full version of the map:

    Map visualization isotherm650

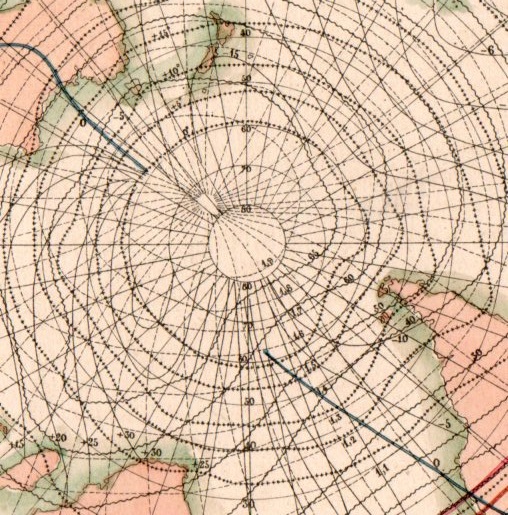
    And the detail of the Southern Hemisphere:

    Map visualization isotherm652

    Notes:

    1.  The atlas was by T. Bromme, Atlas zu Alex. V. Humboldt’s Kosmos in zweiundvierzig Tafeln mit erlauterndem Texte. Herausgegeben von Traugott Bromme. Stuttgart. Verlag von Krais & Hoffman. (with second title page) Atlas zur Physik der Welt in … Bromme, 1851. 


  • A Lively Evolutionary Tree of Coal

    JF Ptak Science Books

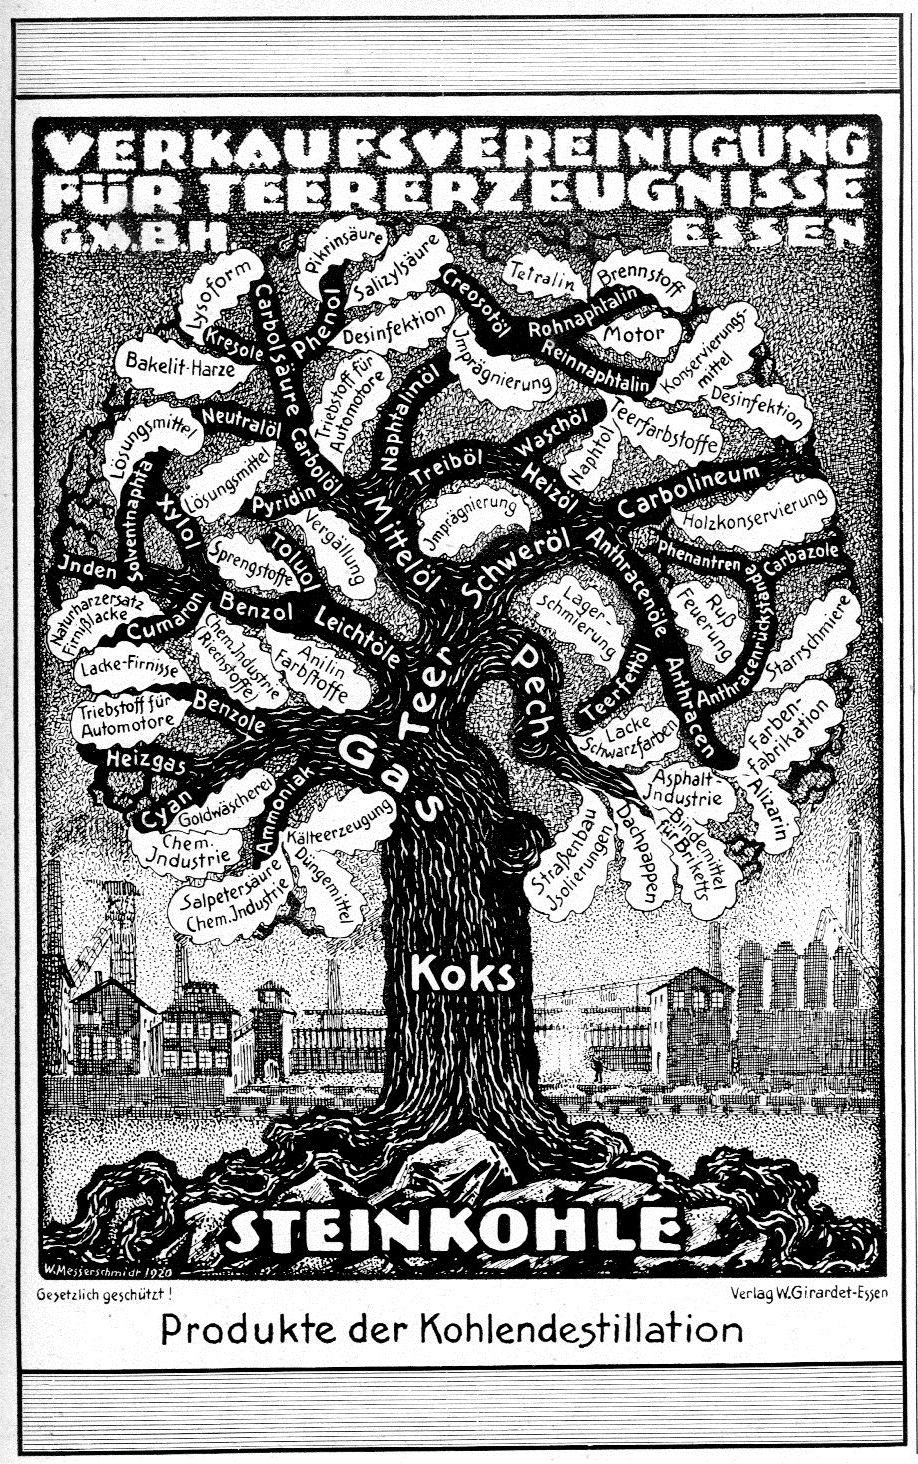
    I am happy to introduce a sub-category in the diagrams-employing -tree-structures category:  the Tree of Coal. It is an unusual diversion in the general quantitative display of data:

    Coal tree519

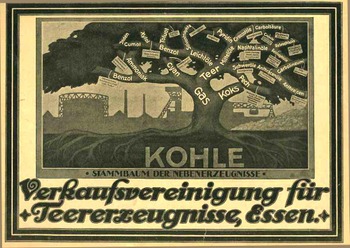
    This was found in the German Life magazine of its day, the Illustrirte Zeitung, in 1921, and is a very strong pictorial display of the evolution of coal products. It is strongly related to the “Verkaufsvereinigung fuer Teererzeugnisse” (of Essen) image which used this idea in 1922, also publishing in the  Illusrtriete Zeitung.. The great tree spring from a bed of coal (“kohle”) exhibiting the “stammbaum der nebenerzeugnisse” (roughly the “pedigree of our product”), with the trunk being gas, branching out into tar, coke and cyan and so on. It is interesting to see that in the Coal Tree above that the roots are firmly entwined over and through a coal pile, while below the roots are in soil.

    Even though it’s the lifeblood of the continuing industrial revolution, and even though we’re hundreds of years into a deep need with the products, the use of the tree just seems antithetical to it all on all levels of recognition.Tree coal


  • Marble Clouds and their Emotional Shadows: Cloud Geometries in Art

    JF Ptak Science Books   Post 1942 (Part I, reposting from 2012) 

    I silently laugh at my own cenotaph 
    	And out of the caverns of rain.  Percy B. Shelley, "The Cloud", 1820
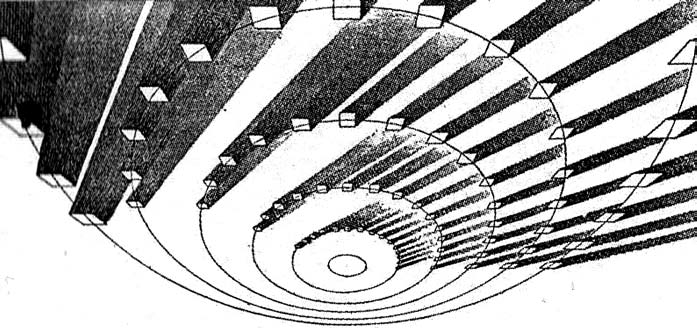
    [John Ruskin, Cloud Perspectival, 1860. Source for all Ruskin images:  “Cloud Studies: The Visible Invisible”, by Mary Jacobus, here.]

    John Ruskin (1819-1900) was still a very young man when he published the start of a series of works in art criticism,Modern Painters, in 18431.  To refer to it as a great work in critical theory is painting the work with a narrow brush, though–it had a very sweeping overall effect, and addressed all manner of issues integral to art, and was a developing vision of what art was looking at in the 19th century.  Ostensibly it began as a defense of the work of J.M.W. Turner and the way in which that man represented nature in his pre-Impressionist, pre-Expressionist work. Ruskin makes the case that the works that were so grating part of the art world i the 1830’s were highly consistent with centuries of representing nature in art–and not only that, but presenting evidence that turner did so like no other artist in history.  Ruskin would weave further volumes of Modern Painters through the body of his other work for the next 17 years, publishing the last installment in a fifth volume in 1860.

    Turner (1775-1851) was a great Romantic and a lot of that work tends towards a very full and very early expression of Impressionism and Expressionism, something that not everyone was ready for in the first quarter of the 19th century. This is particularly so in his paintings of clouds, and even more so in cloud/ocean interaction.  They are sweeping and breath-taking and very emotional works, in some ways like the late string quartets of Beethoven–powerful, provocative, internal dialogs of the deep power of nature. He must stand with John Constable as the Cloud Man of the 19th Century, or perhaps Constable stands with him.  They both in a way stand with Luke Howard, the scientist who was really the first classifier of clouds–an undertaking which in some impossible way escaped the recognition of the greatest classifiers it he history of science–and who did so in a paper in 1802, written at a time when Constable and Turner were both young artists.

    Turner and Constable both painted clouds like perhaps no others before them; and Ruskin, in his deep appreciation for the importance of the representation of nature int he art, also made a contribution to the understanding of clouds that was of an extraordinary nature. In the fifth volume of his Modern Painters Ruskin attempts a perspective study of clouds, and may have been about the first to do so. The illustrations of this effort I think are incredible, and remind me very much of installing a sort of rigidity to clouds, a cloud geometry, veritable studies of stones and blocks in the sky.  The imaging part of this exercise must have been an enormous thing back there in 1860, to think of clouds in a perspectival way, floating very large geometric objects in the sky. The astonishing results are seen (above) and following:
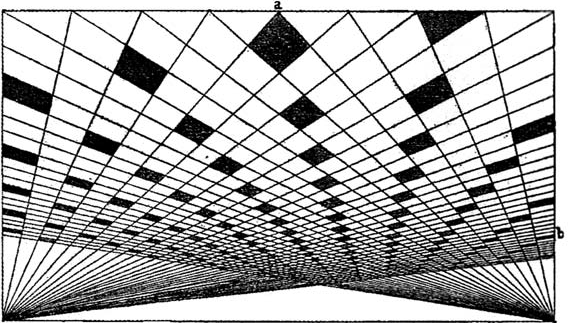
     And this:
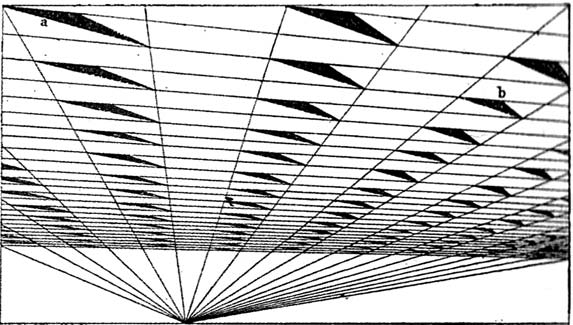
    [John Ruskin, Cloud Perspective: Curvilinear., Modern Painters, Vol. V, Plate LXV.]

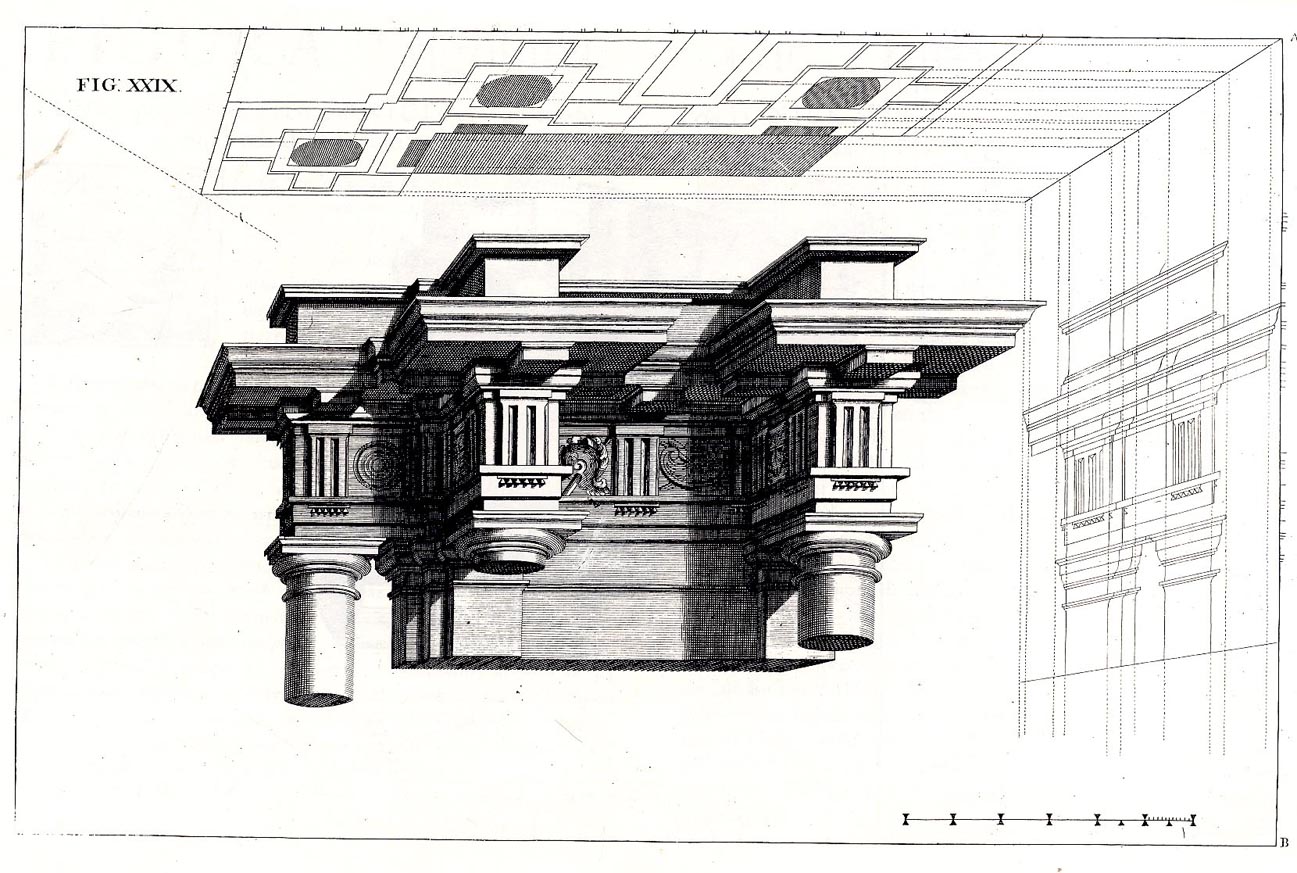
     In a way the first image reminds me of Andrea Pozzo’s work in his monumental   Rules and examples of perspective proper for painters and architects (1693):
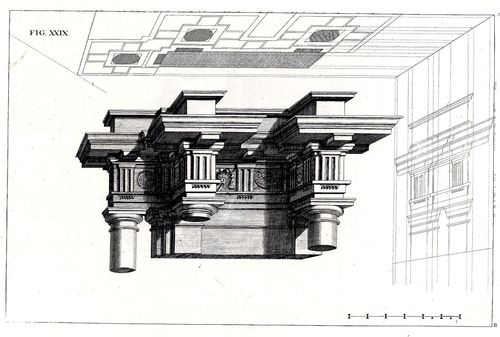
     Pozo

    but really more in the way that Pozzo’s work seems to be elevated and floating in a heavy perspectivist space, bigger and blockier sky-borne marble than with ruskin.  But still, the disembodied floatiness of the Pozzo work is ethereal.

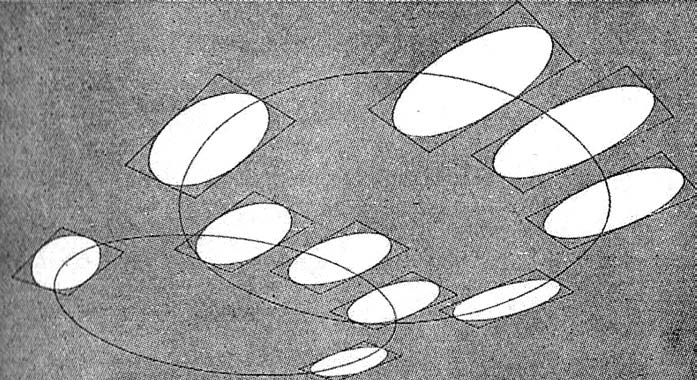
    Ruskin does round out his blocky and beautiful geometry, which definitely reminds me of work w=that would appear 90 years later:  Ruskin, again:
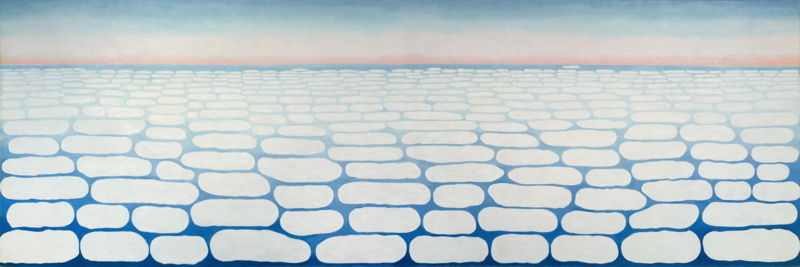
    And  Georgia O’Keefe’s Clouds III (1963), though her clouds tend towards a more rigid geometry in Clouds IV (1965, following):

    Clouds O'KeefeO’Keefe, Clouds Above the Sky III, 1963

    Clouds okeefe sky above iv 1965

    O’Keefe, Clouds Above the Sky IV, 1965

    Ms. Georgia is definitely seeing her clouds with different eyes than Ruskin, and they are entirely different creatures–but still, the two come together in my head as relatives. The clouds, I mean.

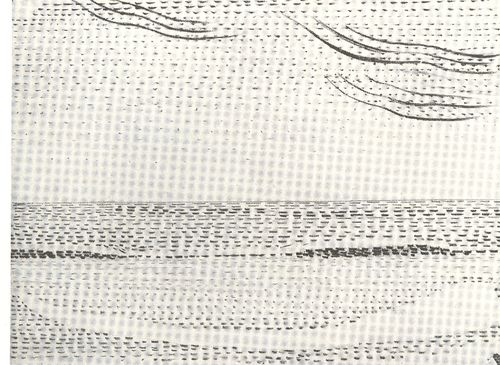
    I started looking around for early hard-line cloud geometries and thus far I haven’t found very much, though there is a tremendous example by Henry Van de Velde’s (1863-1957) “Sun at Ocean (Rhythmic Synthesis”) which I found in  Werner Hoffman’s Turning Points in Twentieth century Art, 1890-1917 and which was executed in 1888/9, looks to me to be absolutely incredible for its time, a nearly non-representational, proto-abstract something, done three decades before these genres came into being.
    Clouds van de velde
    I don’t know where the designer Van de Velde fits in the early history of non-representational art, but his effort in the second to last decade of the 19th century certainly seems to be very unusual for its time, and a good example of creative cloud representation. 

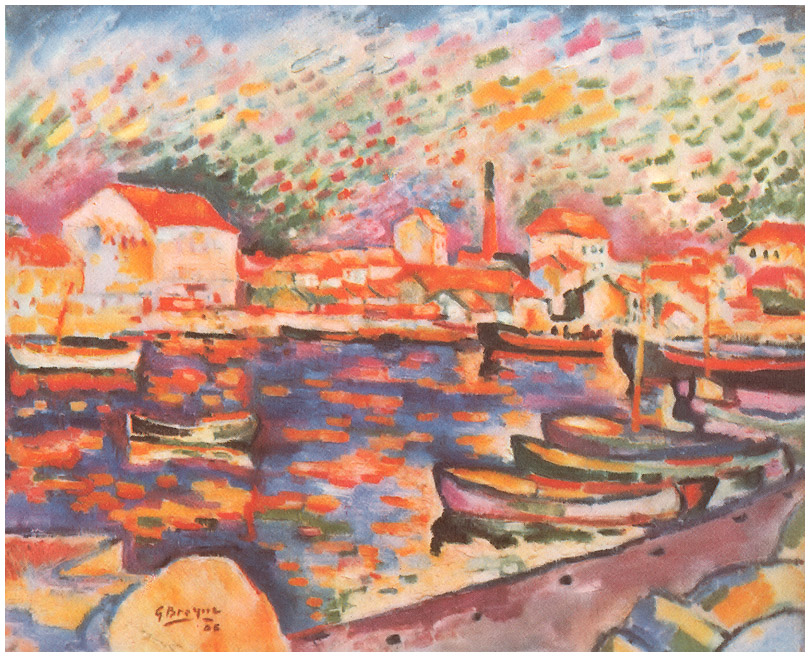
    Non-standard cloud imagery is much easier to finding the 20th century, like those of Georges Braque in his La Ciotat Harbor (1906):
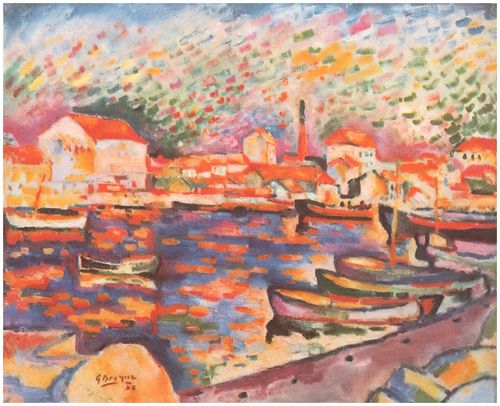
    Clouds braque
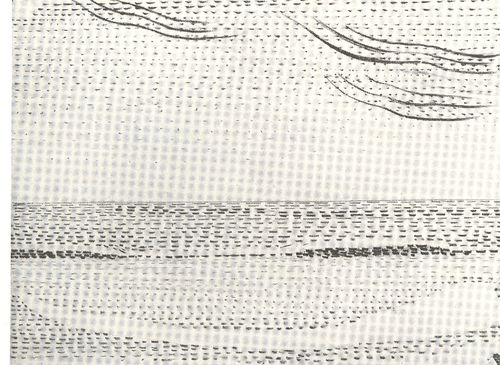
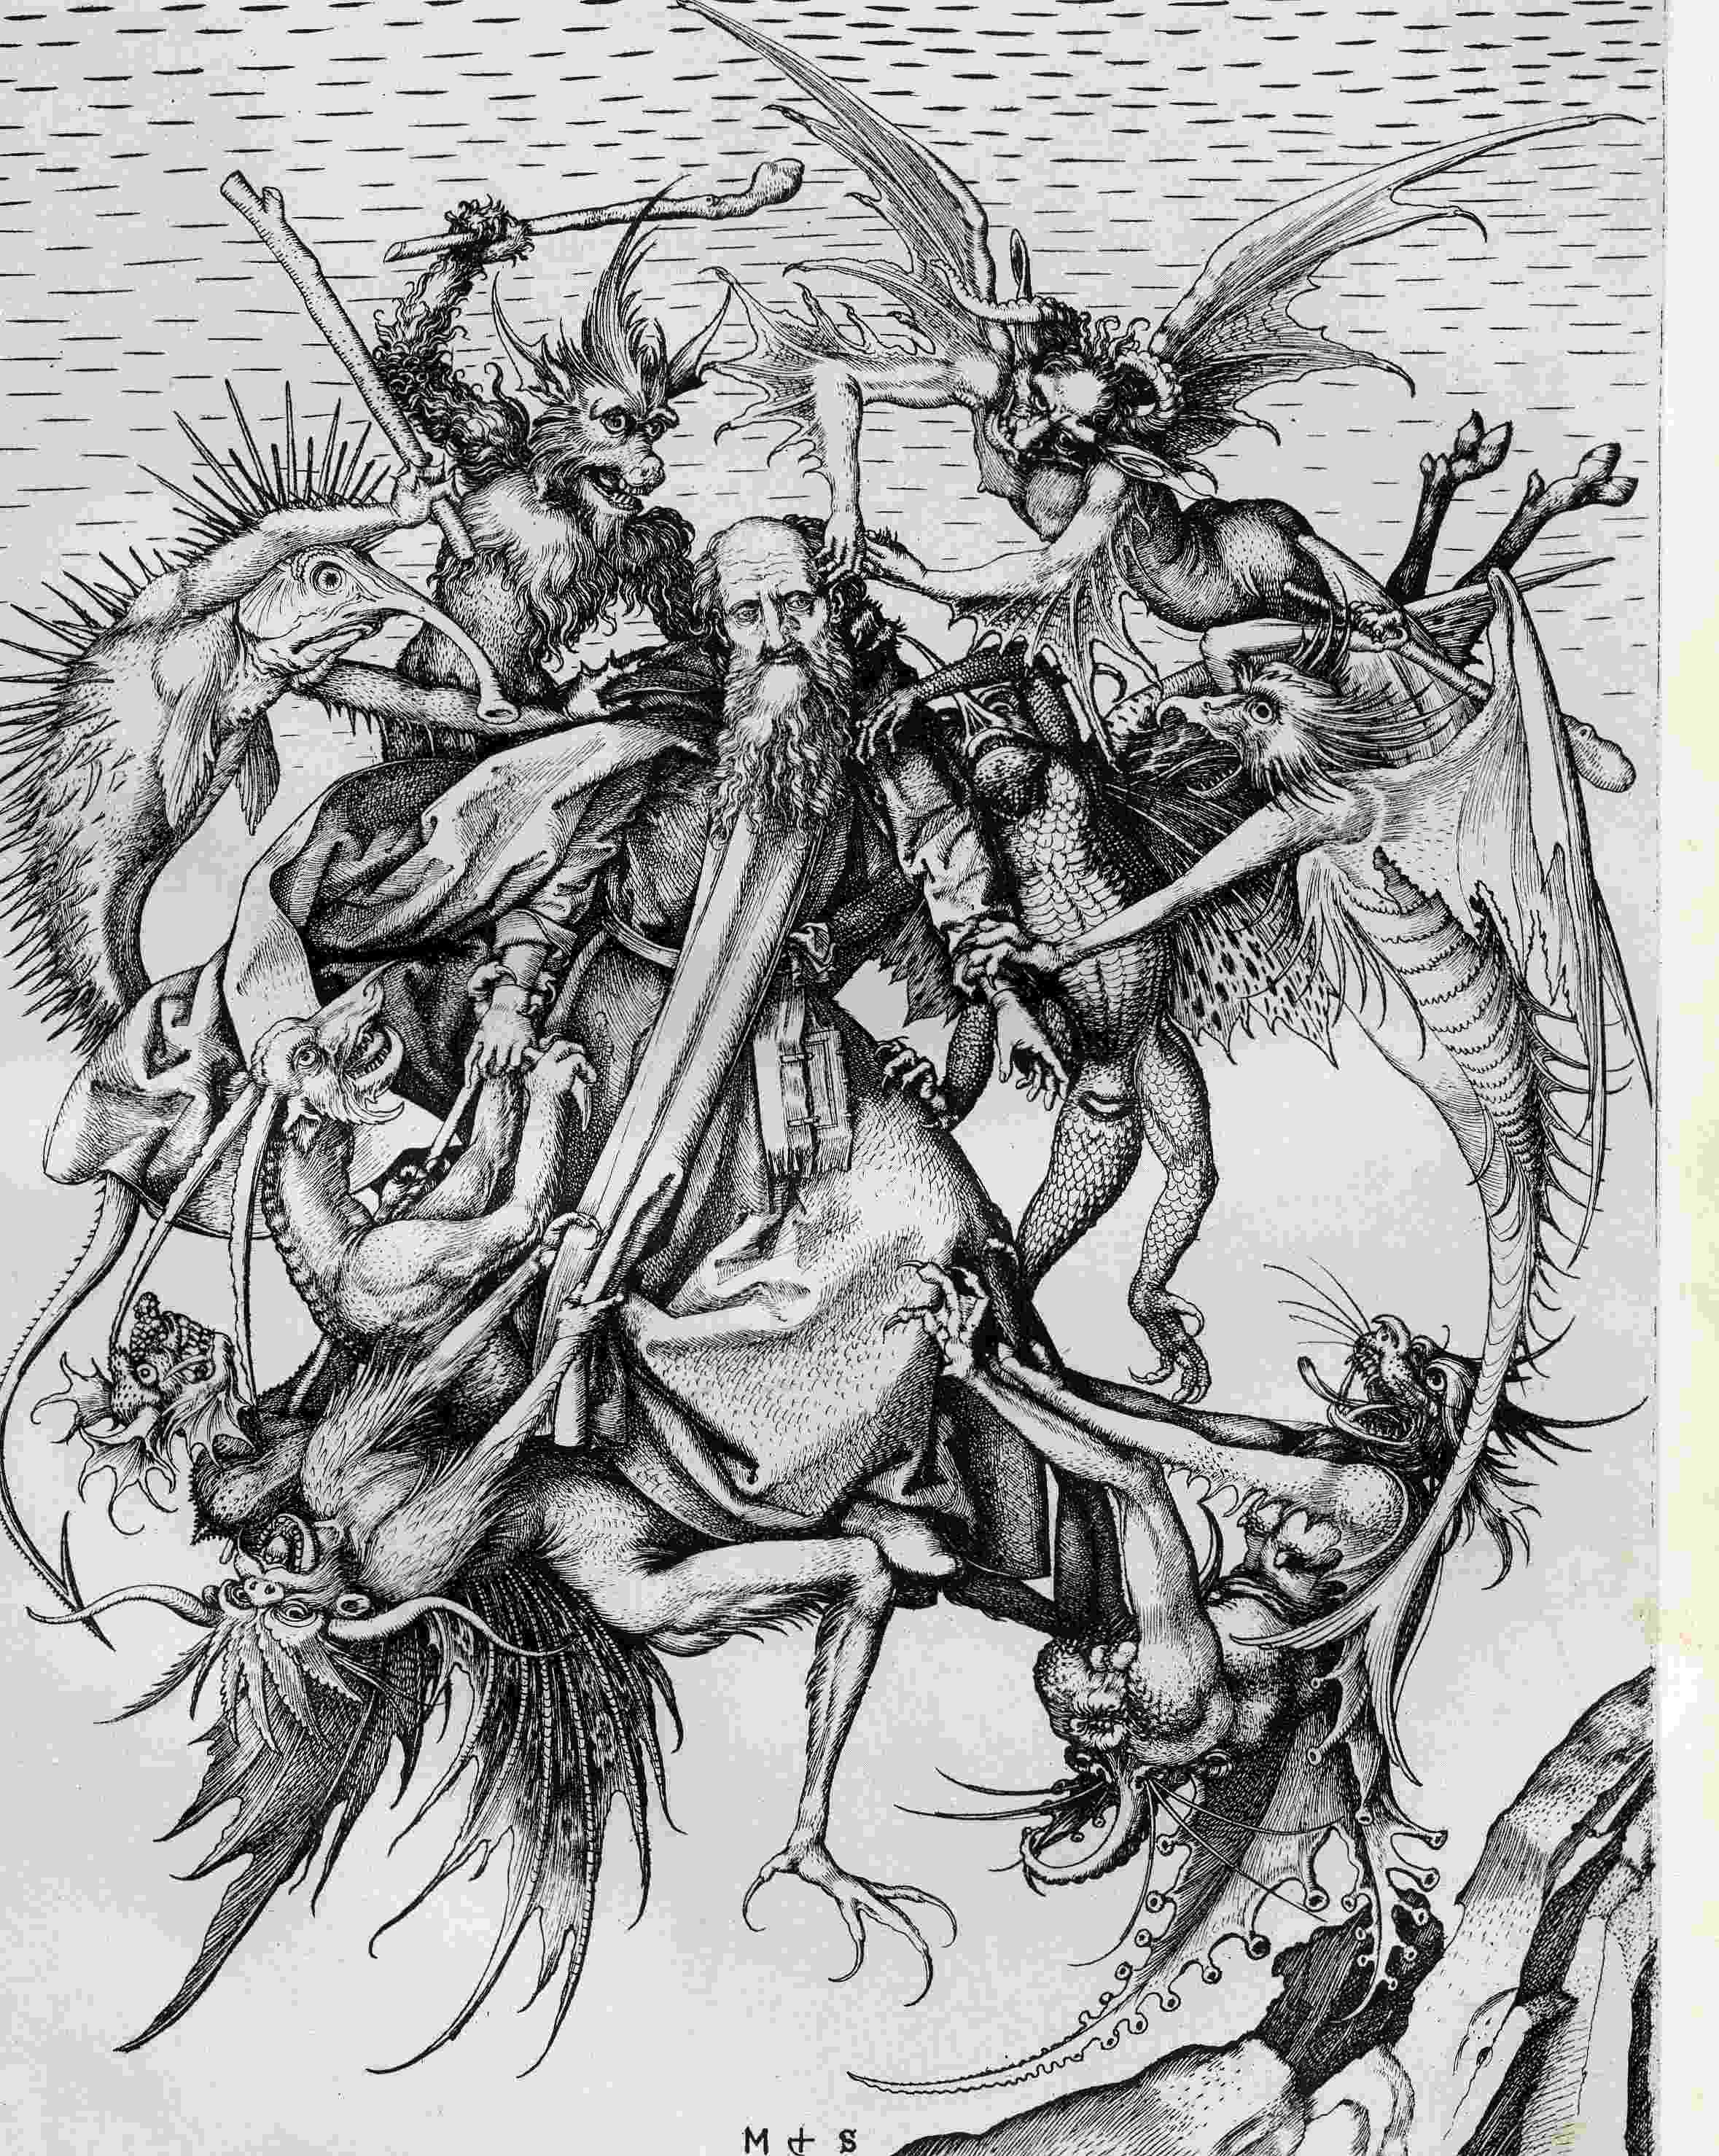
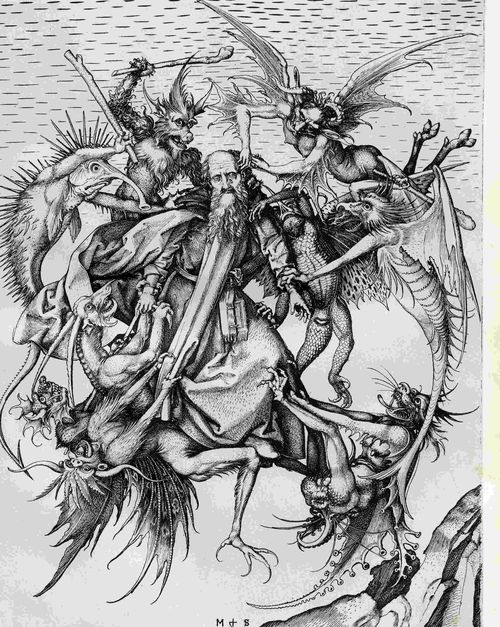
    Even this starts to have the look of something earlier, particularly if you turned the clouds-in-art clock way back, say, into the Renaissance. For example Martin Schoengauer‘s spectacular  The Temptation of St. Anthony, which was printed in 1470/5, has a beautiful, fluid circularity to it, full of an earthy roundness even as the saint is pursued by demons.  But the sky in the background is populated with nothing but dashes to suggest clouds, and which also starts to look something like the Fauvist and Expressionist works to come, 400/500 years later.
    Clouds schoengauer

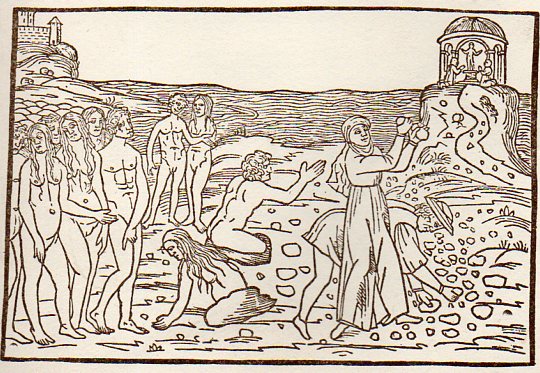
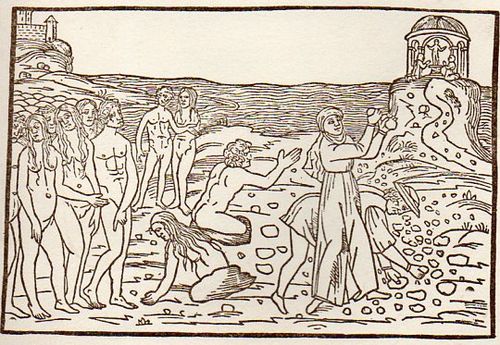
    (There are many examples of the sky being simply not represented at all, particularly in woodblock,

    like this image from Ovid (Accipe Studiose Lector P. Ouidij Metamorphosin...printed in Venice in 1509:
    Clouds no couds livy913

    “You could not see a cloud, because
    No cloud was in the sky:
    No birds were flying overhead —
    There were no birds to fly”.–Lewis Carroll, Through the Looking Glass.

    There are many non-sky images like this. 

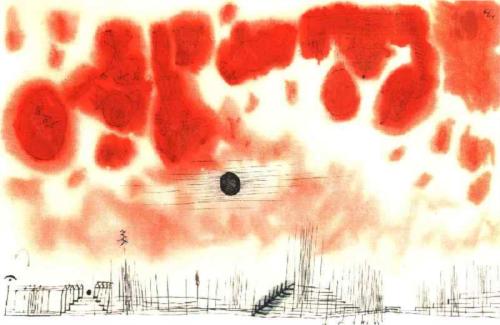
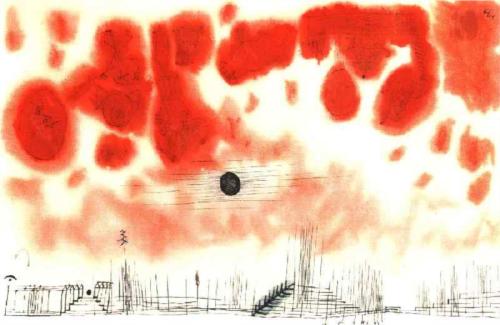
    Another interesting modern example is this Paul Klee (though it comes fairly late in that career, in 1940):
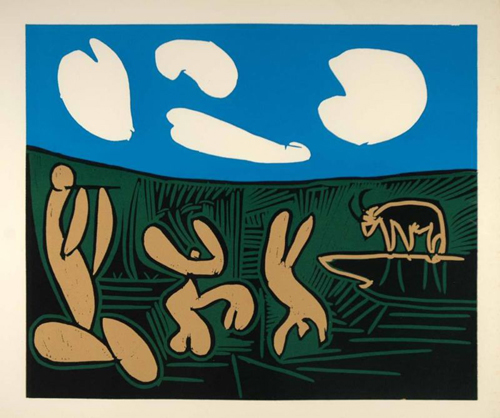
    Clouds Paul Klee 1940And an example from the ubiquitous Picasso, still later, in 1962:
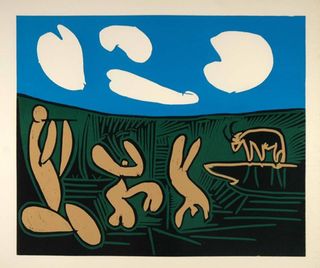
    Clouds Picasso

    But earlier images are harder to locate.  The obvious early-ish source (though still much later in the century) would be Van Gogh (say, with Starry Night) and Monet, though the fractalesque Van Gogh gets much closer to the re-interperative power of the Ruskin images than the reflected impressionist beauty of the Monet.

    Clouds Monet
    On a cursory look around the antiquarian painterly sky-world, it is becoming obvious that the cloud geometries of Ruskin are very uncommon. 

    Notes

    1.  For full text of Ruskin’s  Modern Painters , see  (1873)volume 5 for (1860) and  (1873)

  • Life Expectancy Graphs and Charts

    JF Ptak Science Books   Reference Tools

    I’ve put together several interesting graphs and maps displaying historic human life expectancies–perhaps they will be useful.  

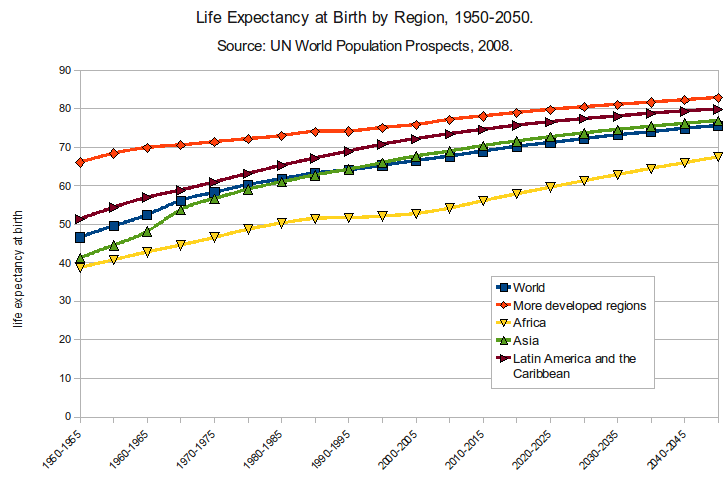
    • Life Expectancy at Birth by Region, 1950-1050
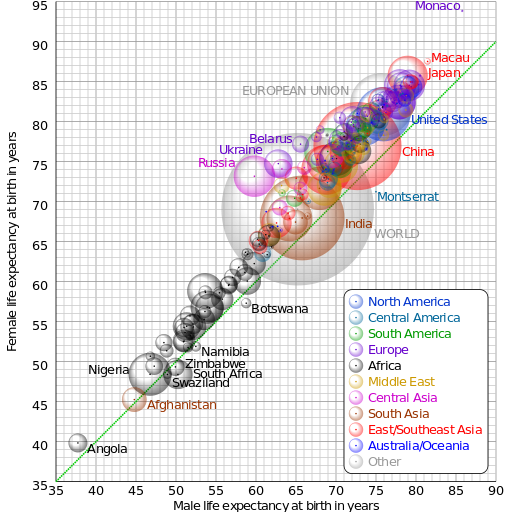
    • Male Life Expectancy via Region
    • Life Expectancy and Retirement Years
    • Life Expectancy by Region
    • Life Expectancy by Region, Concnetrating on Africa
    • Life Expectancy, U.S., 1850-2000
    • World Life Expectancy Map


    Life Expectancy--MapSource: http://upload.wikimedia.org/wikipedia/commons/2/29/Life_Expectancy_at_Birth_by_Region_1950-2050.png


    Life Expectancy graph

    Source: http://en.wikipedia.org/wiki/Life_expectancy#mediaviewer/File:Comparison_gender_life_expectancy_CIA_factbook.svg


  • Diagrams, the Display of Information, and Trees

    JF Ptak Science Books (An earlier post, expanded)


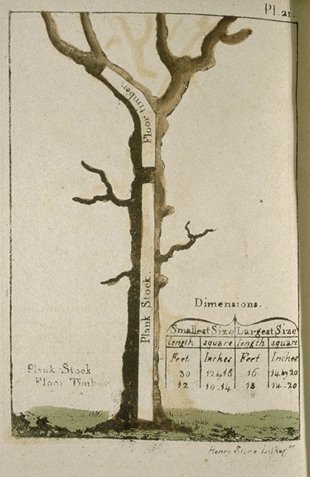
    I’m fond of images of trees, but mostly if they are forensic or employed to display relationships between ideas or data.  One of my favorites for the former is this great image from Peter Guillet’s  Timber Merchant’s Guide. Also, a Table, Whereby, at One View, May Be Seen the Solid and Superficial Measure of Any Square or Unequal Hewed Logs or Plank…1 (printed in Baltimore by J. Longrove in 1823).  Guillet was basically a tree dissector, a harvester of wood for the construction of naval ships.  His book shows how to make the best—the most efficient—use of various varieties of trees, displaying how to employ different sections of trees for different parts of a ship. The book must’ve been an indispensable handbook down at the mill.   At the every least, it certainly introduced a novel way of looking at trees.  

    Tree--timber guillet


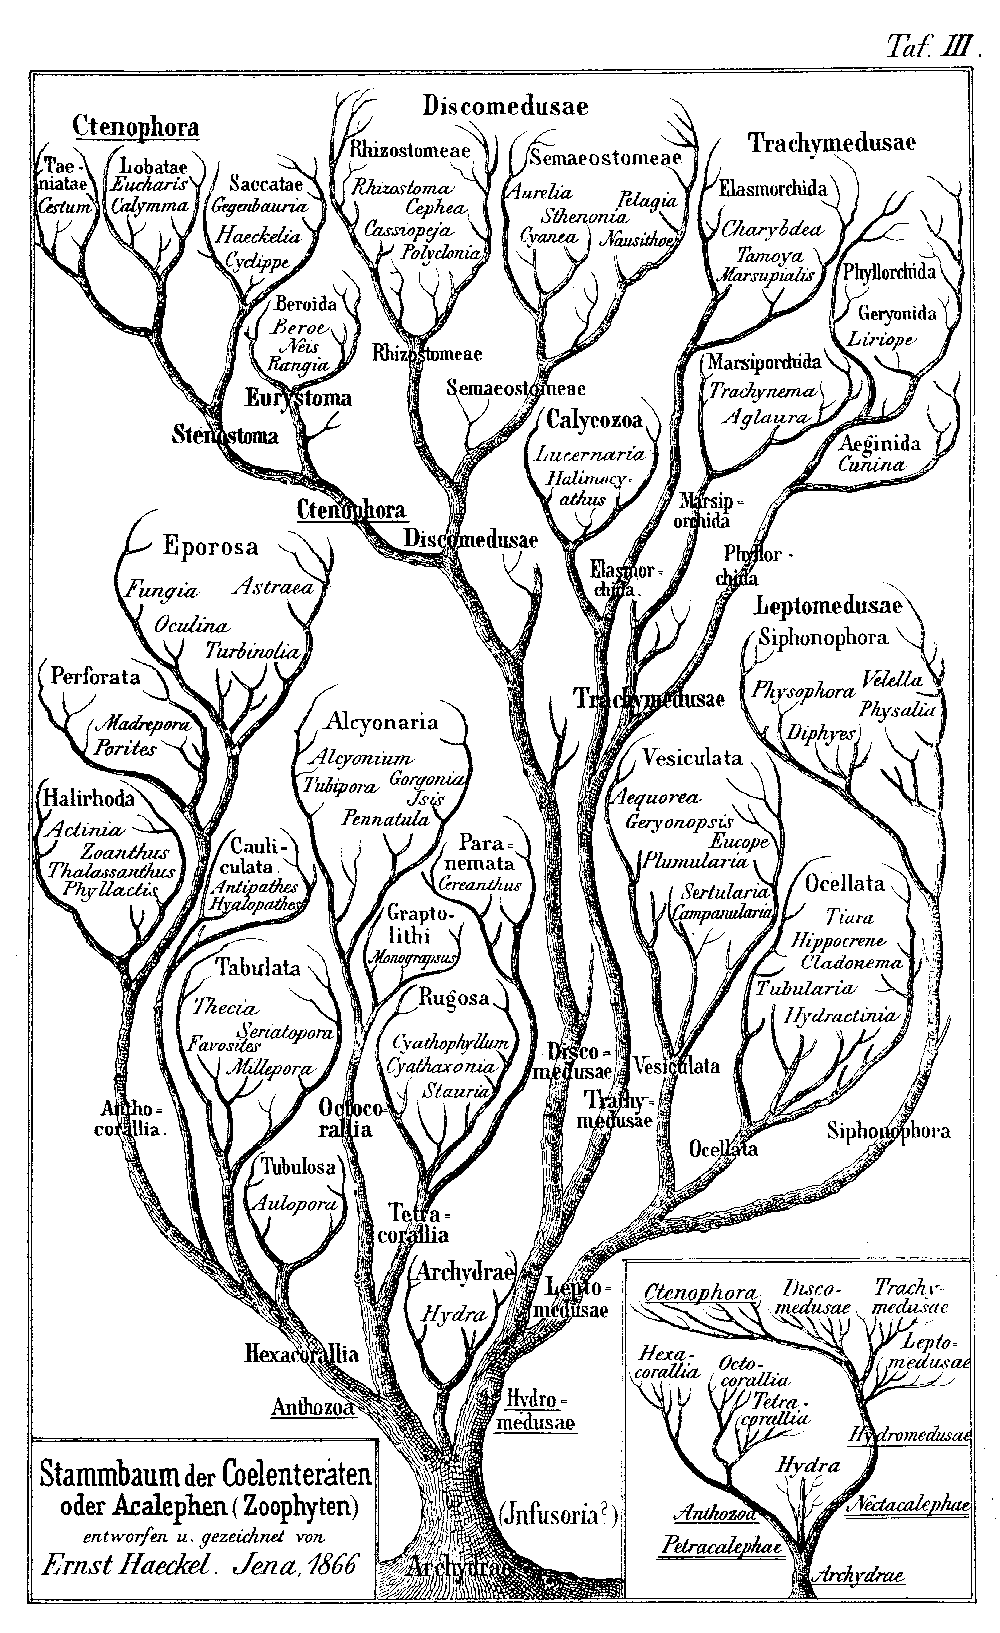
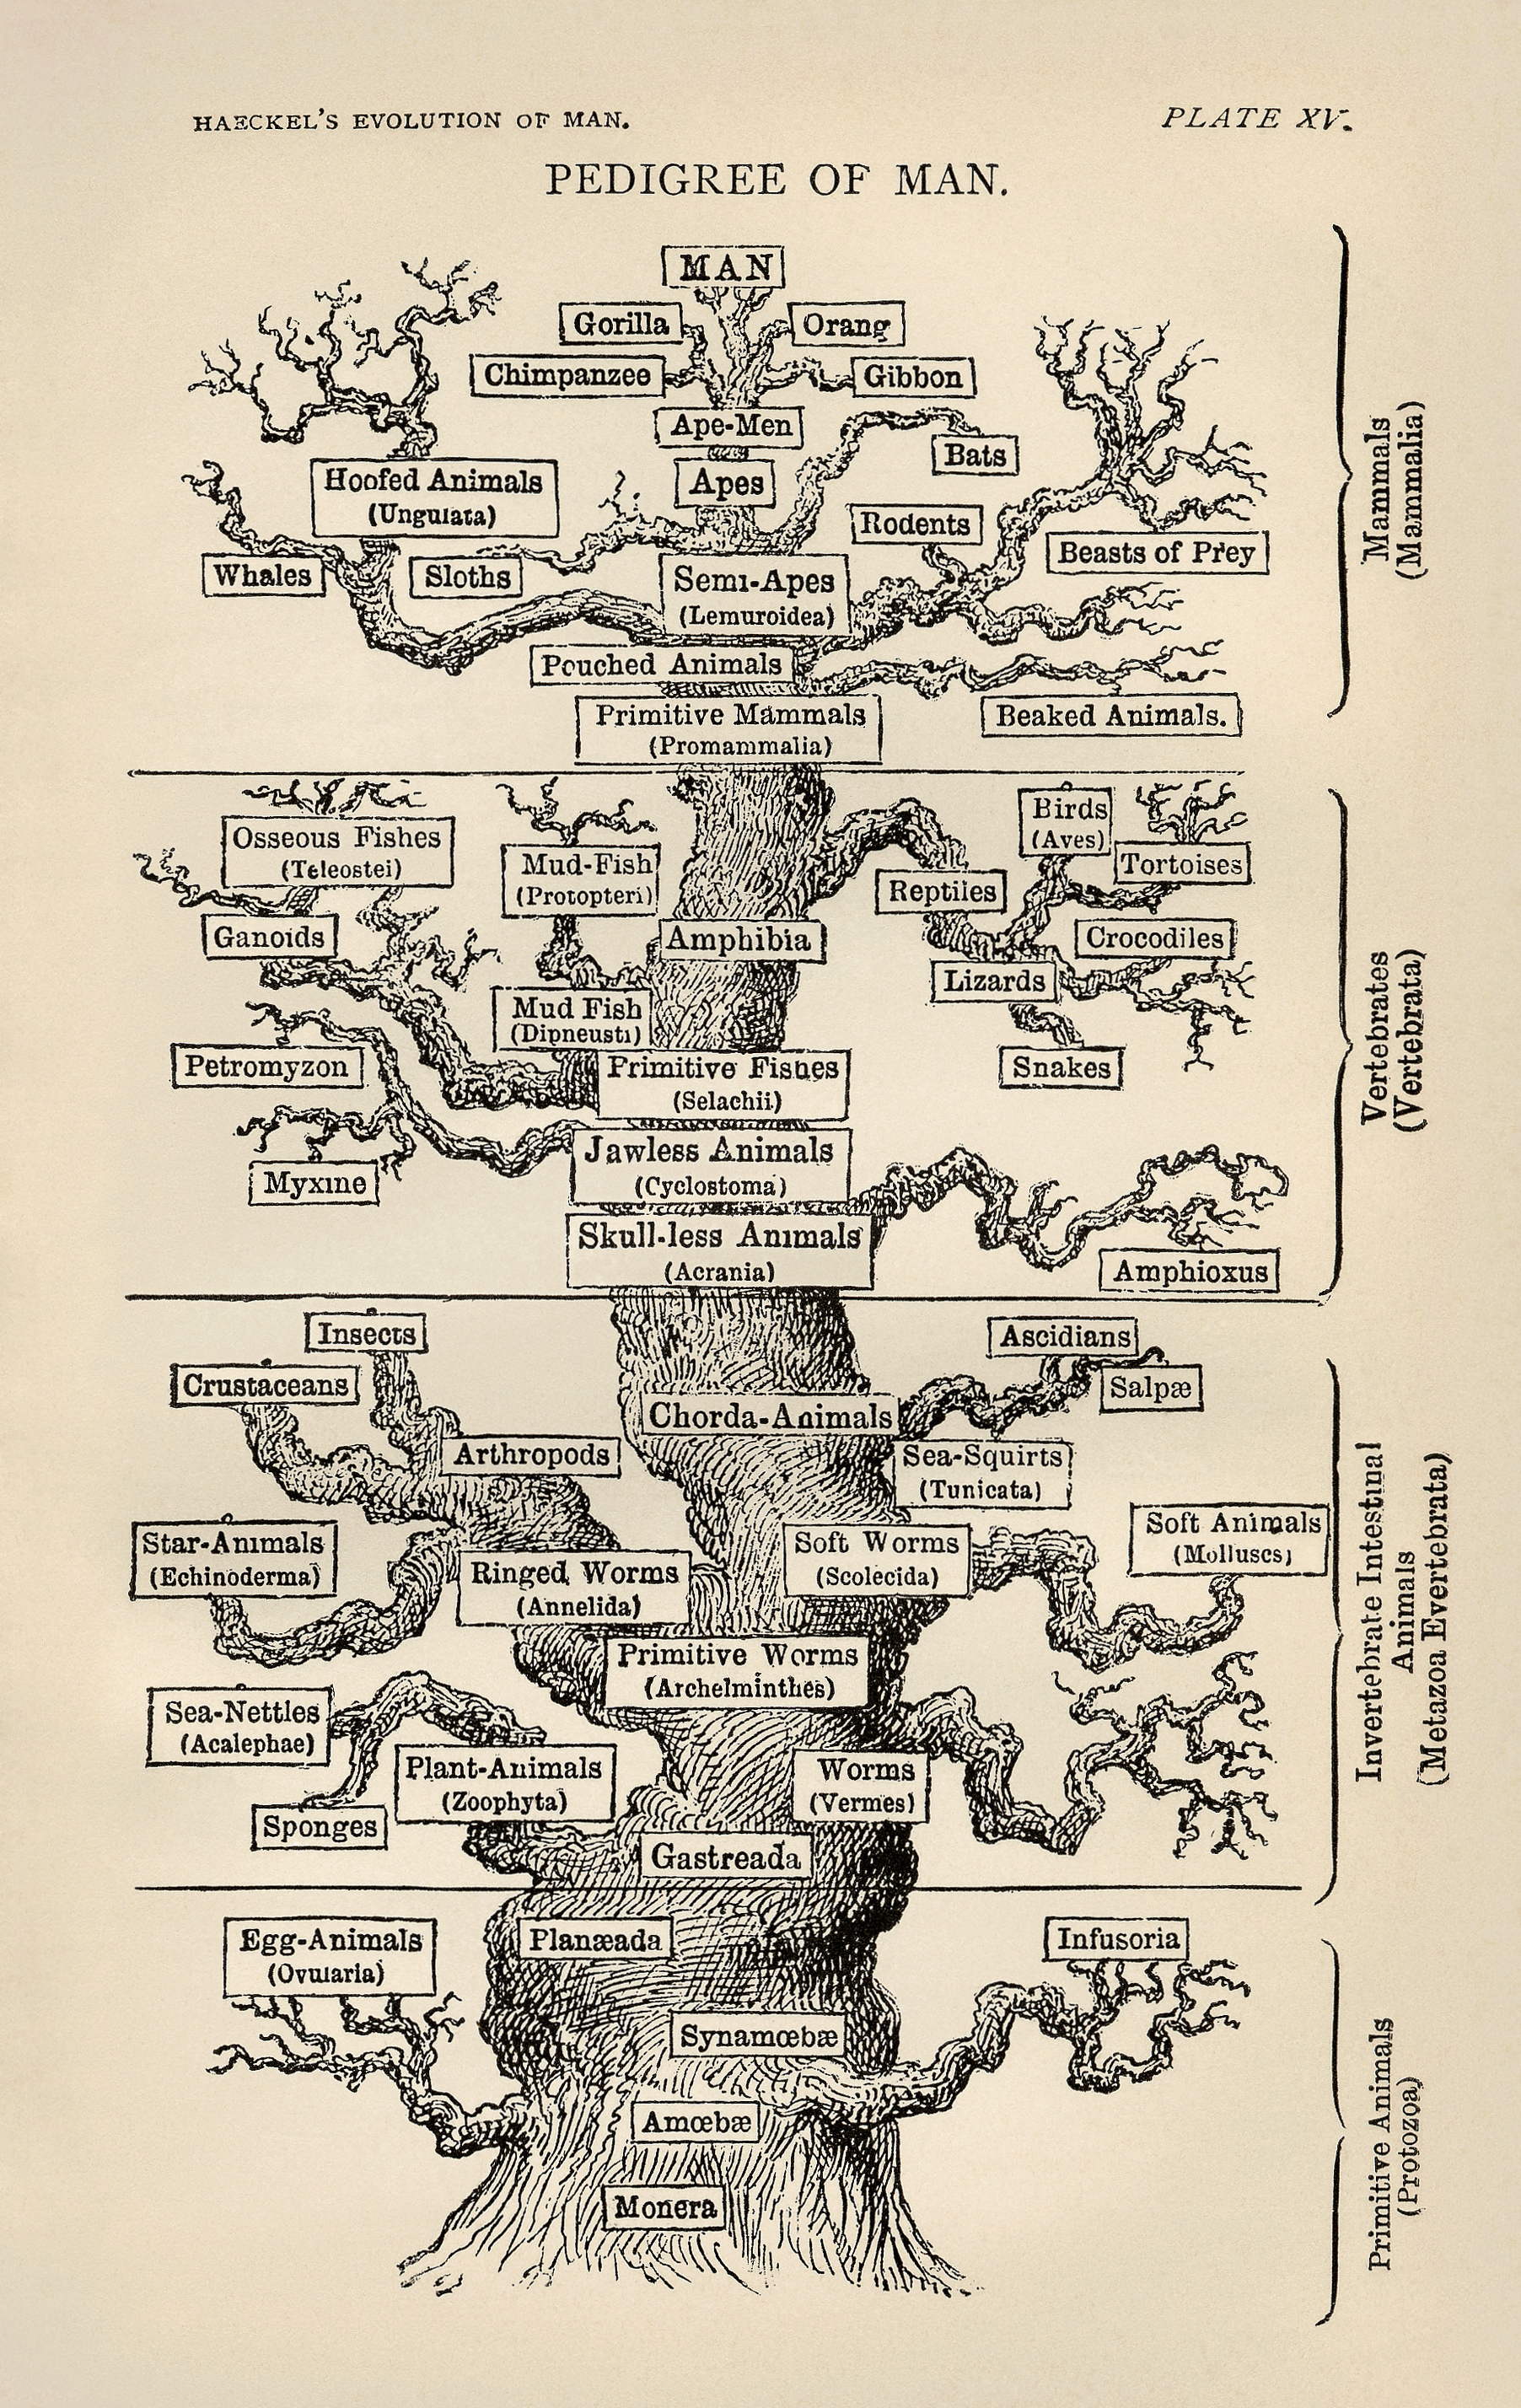
    This tree2 was a figure drawn by biologist and eminent Darwinian Ernst Haeckel3 (1834-1919), the branch spaces relating to intervals which were unrepresented in the fossil record. The image was perhaps the most popularly successful part of his two-volume double-wristbender—it was a difficult book, not well written or presented, with Charles Darwin himself finding it “impossible to read”.

    Tree-haeckel